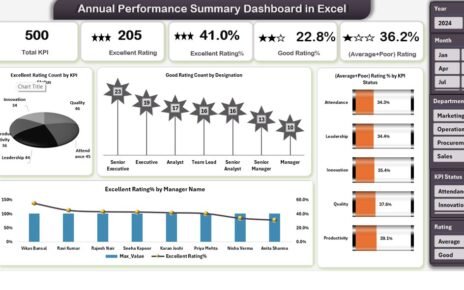
Managing employee performance throughout the year feels challenging for many organizations. You track KPIs, ratings, monthly performance, department trends, and
In today's fast-evolving agricultural sector, leveraging data-driven decision-making is crucial to enhance productivity, efficiency, and sustainability. The Smart Agriculture KPI
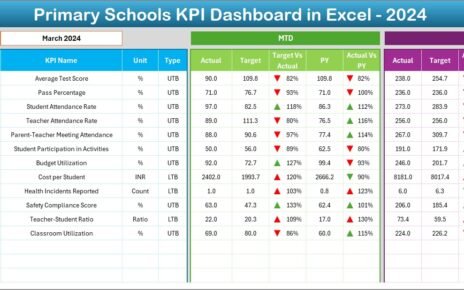
Managing a primary school involves many responsibilities. Teachers, administrators, and academic leaders must track student progress, teacher performance, attendance, learning