In today’s advanced manufacturing environment, 3D printing (additive manufacturing) has transformed how companies design, prototype, and produce products. Organizations now manufacture complex components faster, reduce material waste, and improve customization capabilities. However, despite these advantages, many manufacturers struggle to measure performance effectively.
Without proper monitoring, production delays increase, machine utilization drops, and operational costs rise. Therefore, companies need a structured system that helps them track performance continuously and make data-driven decisions.
This is exactly where the 3D Printing Manufacturing KPI Dashboard in Excel becomes a powerful solution.
This comprehensive guide explains everything you need to know about the 3D Printing Manufacturing KPI Dashboard in Excel, including its structure, features, benefits, implementation process, best practices, and frequently asked questions.
Click to Purchases 3D Printing Manufacturing KPI Dashboard in Excel
What Is a 3D Printing Manufacturing KPI Dashboard in Excel?
A 3D Printing Manufacturing KPI Dashboard in Excel is a ready-to-use performance monitoring tool designed to track key manufacturing metrics using structured Key Performance Indicators (KPIs).
Instead of analyzing scattered spreadsheets, production managers can view all important metrics in a single interactive dashboard. As a result, teams understand operational performance instantly and take corrective action quickly.
Moreover, Excel provides flexibility, automation, and easy customization. Therefore, organizations of all sizes can implement this dashboard without investing in expensive software.
Why Do 3D Printing Manufacturers Need KPI Tracking?
3D printing operations involve multiple moving parts. For example:
-
Machine performance
-
Material consumption
-
Print success rate
-
Production time
-
Quality control
-
Post-processing efficiency
When companies fail to track these areas properly, inefficiencies remain hidden. Consequently, productivity decreases.
However, KPI dashboards solve this problem because they transform raw production data into meaningful insights.
Key Reasons to Use KPI Tracking
-
Monitor real-time manufacturing performance
-
Compare actual vs target production results
-
Identify bottlenecks early
-
Improve equipment utilization
-
Reduce operational waste
-
Support strategic decision-making
Therefore, KPI tracking becomes essential for modern additive manufacturing facilities.
Click to Purchases 3D Printing Manufacturing KPI Dashboard in Excel
What Problems Does the Dashboard Solve?
Many manufacturing teams still rely on manual reports. Although spreadsheets exist, they often lack structure and automation.
Because of that, teams face several challenges:
-
Data scattered across multiple files
-
Manual calculations causing errors
-
Lack of performance visibility
-
Delayed decision-making
-
Difficulty comparing historical performance
The 3D Printing Manufacturing KPI Dashboard in Excel eliminates these issues by creating a centralized performance system.
Click to Purchases 3D Printing Manufacturing KPI Dashboard in Excel
Key Features of the 3D Printing Manufacturing KPI Dashboard in Excel
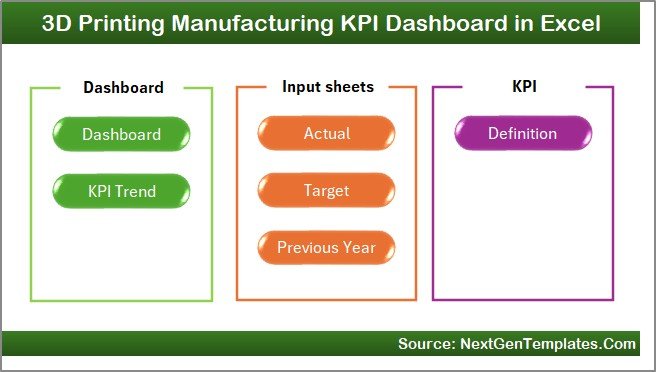
The dashboard includes 7 structured worksheets, each designed for a specific purpose. Together, they create a complete performance management system.
1. Home Sheet – Smart Navigation Center
The Home sheet acts as the index page of the dashboard.
Here, users find six navigation buttons that allow instant movement between sheets. As a result, users save time and access reports quickly.
Key Highlights:
-
Central navigation interface
-
Easy sheet switching
-
User-friendly design
-
Beginner-friendly layout
Therefore, even non-technical users can operate the dashboard easily.
Click to Purchases 3D Printing Manufacturing KPI Dashboard in Excel
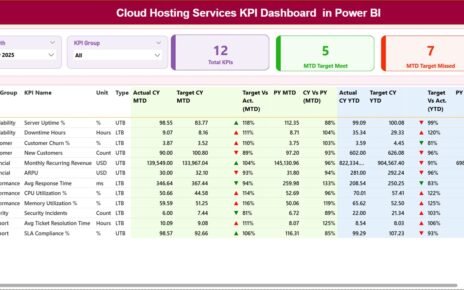
2. Dashboard Sheet – Main KPI Performance View

The Dashboard sheet represents the core of the entire system.
Here, users can select the reporting month from the dropdown available in cell D3. Immediately, the dashboard updates all calculations automatically.
What Does the Dashboard Display?
-
MTD (Month-To-Date) Actual values
-
Target values
-
Previous Year comparison
-
YTD (Year-To-Date) performance
-
Target vs Actual comparison
-
Previous Year vs Actual comparison
Additionally, conditional formatting displays up and down arrows, which instantly show performance trends.
Because of this visual approach, managers understand performance within seconds.
Click to Purchases 3D Printing Manufacturing KPI Dashboard in Excel
3. KPI Trend Sheet – Performance Analysis Over Time

The KPI Trend sheet allows deep analysis of individual KPIs.
Users select a KPI name from the dropdown in cell C3, and the dashboard automatically updates related information.
Information Displayed
-
KPI Group
-
Unit of measurement
-
KPI Type (Lower the Better / Upper the Better)
-
KPI Formula
-
KPI Definition
Furthermore, the sheet displays:
-
MTD Trend Chart
-
YTD Trend Chart
-
Actual vs Target vs Previous Year comparison
Therefore, managers easily analyze long-term performance trends.
4. Actual Numbers Input Sheet – Data Entry Area
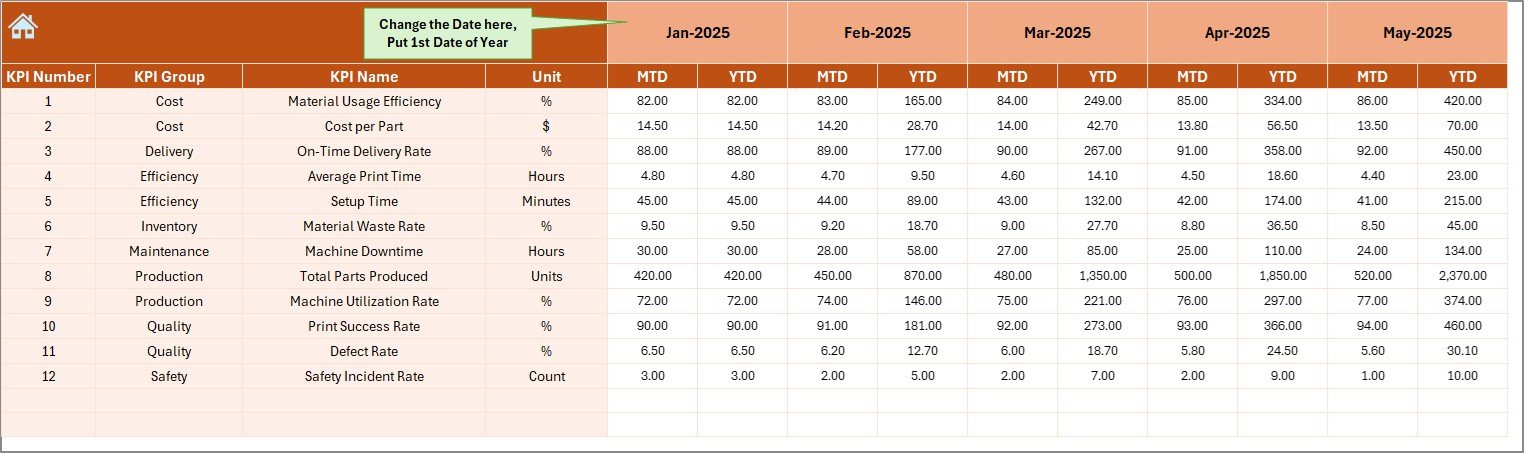
This sheet serves as the primary data input location.
Users enter actual production numbers for each KPI.
How It Works
-
Set the first month of the year in cell E1
-
Enter MTD and YTD values
-
Dashboard updates automatically
Because calculations connect dynamically, users avoid manual formula adjustments.
Click to Purchases 3D Printing Manufacturing KPI Dashboard in Excel
5. Target Sheet – Goal Management

The Target Sheet allows organizations to define performance expectations.
Users enter:
-
Monthly targets (MTD)
-
Yearly targets (YTD)
Afterward, the dashboard compares targets against actual performance automatically.
As a result, teams clearly understand whether they meet operational goals.
6. Previous Year Numbers Sheet – Historical Comparison

This sheet stores historical production data.
Users enter last year’s numbers using the same structure as current data.
Consequently, the dashboard enables:
-
Year-over-year comparison
-
Performance benchmarking
-
Trend evaluation
Historical context improves strategic planning significantly.
7. KPI Definition Sheet – KPI Documentation Hub
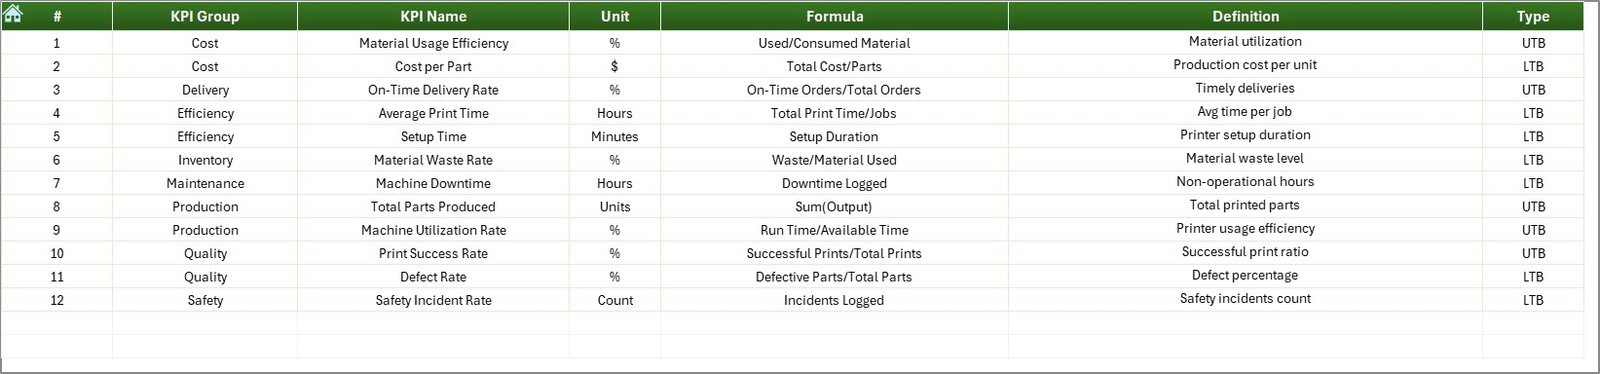
The KPI Definition sheet defines all performance metrics.
Users enter:
-
KPI Name
-
KPI Group
-
Unit
-
Formula
-
Definition
Because documentation remains centralized, teams maintain consistency across departments.
Click to Purchases 3D Printing Manufacturing KPI Dashboard in Excel
Which KPIs Can You Track in 3D Printing Manufacturing?
Organizations can customize KPIs according to operational needs.
Common 3D Printing KPIs
-
Print Success Rate
-
Machine Utilization Rate
-
Material Waste Percentage
-
Production Cycle Time
-
Build Completion Rate
-
Energy Consumption per Print
-
Post-Processing Time
-
Quality Defect Rate
-
On-Time Delivery Rate
-
Cost per Printed Part
Tracking these KPIs ensures operational efficiency.
How Does the Dashboard Improve Decision-Making?
Data alone does not improve performance. However, visual insights enable faster decisions.
The dashboard helps managers:
-
Identify underperforming machines
-
Optimize production schedules
-
Reduce downtime
-
Improve print accuracy
-
Control operational costs
Therefore, decision-making becomes proactive instead of reactive.
Click to Purchases 3D Printing Manufacturing KPI Dashboard in Excel
Advantages of 3D Printing Manufacturing KPI Dashboard in Excel
Using this dashboard provides several operational and strategic benefits.
✅ Improved Performance Visibility
Managers instantly see operational performance without complex analysis.
✅ Faster Decision Making
Visual indicators highlight issues immediately.
✅ Data Centralization
All KPIs remain in one structured file.
✅ Easy Customization
Excel allows modifications without coding.
✅ Cost-Effective Solution
Companies avoid expensive BI software investments.
✅ Better Accountability
Teams clearly understand targets and outcomes.
How to Implement the Dashboard Successfully?
Implementation remains simple when organizations follow a structured approach.
Step-by-Step Implementation
-
Define manufacturing KPIs
-
Enter KPI definitions in the definition sheet
-
Set yearly targets
-
Input actual production data monthly
-
Review dashboard insights regularly
-
Conduct monthly performance reviews
Consistency ensures maximum results.
Click to Purchases 3D Printing Manufacturing KPI Dashboard in Excel
Best Practices for the 3D Printing Manufacturing KPI Dashboard
To achieve the best outcomes, organizations should follow proven practices.
✔ Maintain Data Accuracy
Always validate input numbers before analysis.
✔ Update Data Regularly
Enter data monthly to maintain dashboard relevance.
✔ Use Standard KPI Definitions
Ensure all departments follow the same measurement logic.
✔ Monitor Trends, Not Just Numbers
Focus on improvement patterns instead of single-month results.
✔ Train Team Members
Ensure users understand how KPIs impact operations.
✔ Review Targets Periodically
Adjust goals according to business growth.
Click to Purchases 3D Printing Manufacturing KPI Dashboard in Excel
How Does This Dashboard Support Continuous Improvement?
Continuous improvement depends on measurable insights.
Because the dashboard highlights performance gaps, teams can:
-
Analyze root causes
-
Implement corrective actions
-
Measure improvement results
-
Optimize workflows
Over time, productivity increases significantly.
Who Can Benefit from This KPI Dashboard?
This dashboard suits multiple roles within manufacturing organizations.
Ideal Users
-
Production Managers
-
Plant Supervisors
-
Operations Heads
-
Quality Managers
-
Manufacturing Analysts
-
Business Owners
Even small manufacturing startups can use it effectively.
Click to Purchases 3D Printing Manufacturing KPI Dashboard in Excel
Why Use Excel Instead of Complex Software?
Many organizations assume advanced analytics requires expensive tools. However, Excel offers powerful capabilities.
Benefits of Excel-Based Dashboards
-
Easy to learn
-
Widely available
-
Highly flexible
-
No licensing complexity
-
Quick deployment
Therefore, Excel remains a practical choice for KPI management.
Common Mistakes to Avoid While Using KPI Dashboards
Even strong dashboards fail when used incorrectly.
Avoid these mistakes:
-
Tracking too many KPIs
-
Ignoring data updates
-
Setting unrealistic targets
-
Focusing only on results, not causes
-
Lack of user training
Avoiding these issues ensures long-term success.
Future of KPI Monitoring in 3D Printing Manufacturing
Additive manufacturing continues to evolve rapidly.
In the future, KPI dashboards will integrate with:
-
IoT-enabled machines
-
Real-time sensors
-
AI-driven analytics
-
Predictive maintenance systems
However, structured KPI tracking remains the foundation of smart manufacturing.
Conclusion
The 3D Printing Manufacturing KPI Dashboard in Excel provides a powerful yet simple way to monitor production performance. Instead of relying on manual reports, organizations gain real-time insights through structured KPIs and automated visualizations.
Because the dashboard centralizes data, compares targets, and highlights trends, managers make faster and smarter decisions. Moreover, Excel’s flexibility ensures easy adoption without technical barriers.
Therefore, companies that implement KPI dashboards improve efficiency, reduce waste, and achieve sustainable manufacturing growth.
Click to Purchases 3D Printing Manufacturing KPI Dashboard in Excel
Frequently Asked Questions (FAQs)
What is a KPI dashboard in 3D printing manufacturing?
A KPI dashboard tracks important production metrics such as print success rate, machine utilization, and production efficiency in a visual format.
Is this dashboard suitable for small manufacturing companies?
Yes. Since it uses Excel, small and medium businesses can implement it easily without additional software costs.
How often should data be updated?
Organizations should update data monthly or weekly depending on production volume.
Can I customize KPIs in the dashboard?
Yes. Users can add, modify, or remove KPIs using the KPI Definition sheet.
Do I need advanced Excel skills to use it?
No. The dashboard uses structured input sheets and dropdown selections, making it beginner-friendly.
Can the dashboard compare performance with previous years?
Yes. The Previous Year Numbers sheet enables year-over-year performance analysis.
How does conditional formatting help?
Conditional formatting uses visual arrows to show performance improvement or decline instantly.
Is this dashboard useful for continuous improvement programs?
Absolutely. KPI tracking helps organizations identify gaps and measure improvement progress effectively.
Click to Purchases 3D Printing Manufacturing KPI Dashboard in Excel
Visit our YouTube channel to learn step-by-step video tutorials