Cybersecurity teams work in a high-pressure environment where threats evolve daily and incidents need quick responses. Organizations want to detect issues early, respond faster, and reduce the impact of cyberattacks. However, security leaders cannot take confident decisions without real-time visibility. A Cybersecurity Incident KPI Dashboard in Power BI solves this problem. It gives clear insights, tracks every key security metric, and highlights issues before they become major risks.
This article explains everything about the Cybersecurity Incident KPI Dashboard in Power BI. You will learn how it works, how each page supports security decision-making, and how teams can use it to improve their performance. You will also explore its advantages, best practices, and answers to common questions.
Click to Purchases Cybersecurity Incident KPI Dashboard in Power BI
What Is a Cybersecurity Incident KPI Dashboard in Power BI?
A Cybersecurity Incident KPI Dashboard in Power BI is a ready-to-use reporting tool that helps organizations track security incidents, monitor vulnerabilities, and measure response efficiency. It collects data from an Excel file and presents it in a simple and visual format. As a result, security teams understand trends, compare results with targets, and focus on the areas that need attention.
The dashboard focuses on MTD (Month-to-Date) and YTD (Year-to-Date) performance, KPI groups, targets, and comparison with previous year data. It helps leaders monitor incident trends, threat reduction achievements, and operational efficiency.
Because it uses Excel as the data source, anyone can update the numbers without technical skills.
Why Do Cybersecurity Teams Need a KPI Dashboard?
Cybersecurity teams deal with continuous threats. Incidents, alerts, and vulnerabilities appear at any time. Without a dashboard, the information stays scattered and unclear. A KPI dashboard brings everything into one place so that teams:
-
track incidents in real time
-
compare performance with targets
-
identify weak points
-
allocate resources quickly
-
improve response speed
-
support audits and compliance
This dashboard helps everyone—from analysts to CISOs—understand the organization’s risk posture and take timely action.
Key Features of the Cybersecurity Incident KPI Dashboard in Power BI
The dashboard contains three powerful pages, each built to handle a specific part of cybersecurity monitoring.
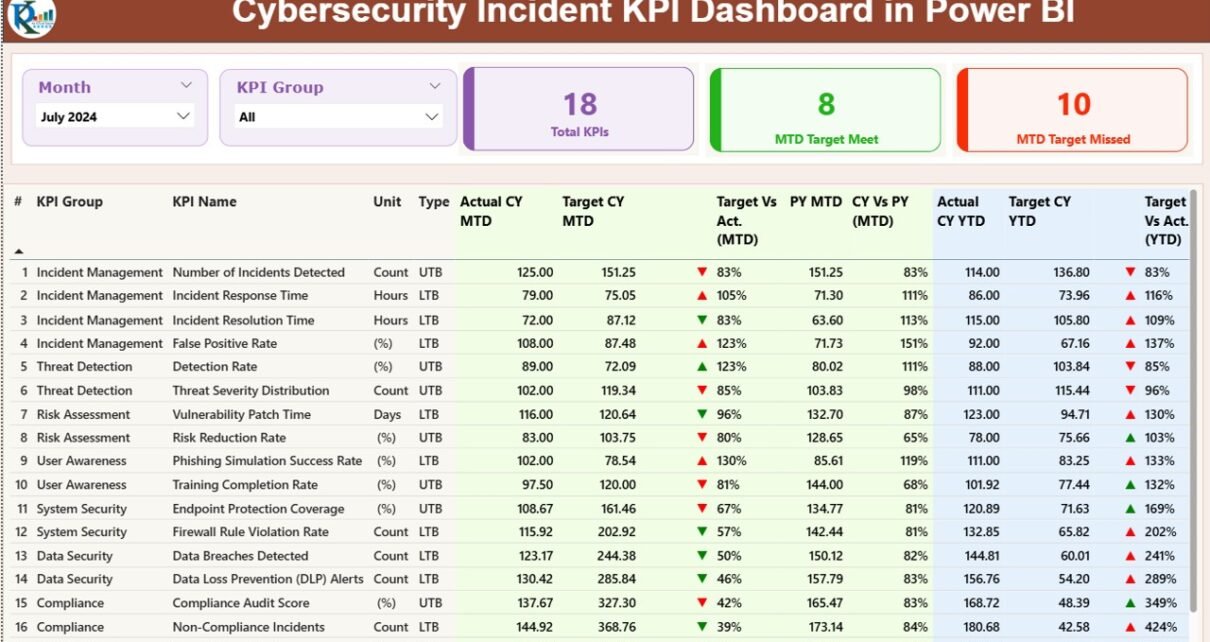
1. Summary Page: The Main Performance View

The Summary Page acts as the central page of the dashboard. It gives a quick view of all KPIs and allows users to switch between months and KPI groups using slicers.
Top Section
At the top of the page, users see:
-
Month slicer
-
KPI Group slicer
-
Cards showing:
-
Total KPIs count
-
MTD Target Meet count
-
MTD Target Missed count
-
These cards immediately show whether the team meets expectations.
Detailed Data Table
Below the cards, the dashboard displays a large table containing the following details:
-
KPI Number: Sequence number of the KPI
-
KPI Group: Category of the KPI
-
KPI Name: Name of the KPI
-
Unit: Unit of measurement
-
Type: LTB (Lower the Better) or UTB (Upper the Better)
MTD Metrics Shown in the Table
The dashboard also shows MTD performance using several data points:
-
Actual CY MTD: Current month-to-date actual value
-
Target CY MTD: Current month-to-date target
-
MTD Icon: ▲ (green) for positive performance and ▼ (red) for poor performance
-
Target Vs Actual (MTD): Actual MTD value divided by Target MTD value
-
PY MTD: Previous year MTD value
-
CY Vs PY (MTD): Comparison between current MTD and previous year MTD
These values help teams measure monthly cybersecurity performance.
YTD Metrics Shown in the Table
The dashboard also shows year-to-date performance:
-
Actual CY YTD: Current year YTD actual value
-
Target CY YTD: Current year YTD target
-
YTD Icon: Indicator showing KPI status for YTD
-
Target Vs Actual (YTD): Actual YTD value divided by Target YTD value
-
PY YTD: Previous year YTD number
-
CY Vs PY (YTD): Comparison between current YTD and previous year YTD
MTD and YTD insights allow cybersecurity managers to monitor short-term and long-term performance at the same time.
2. KPI Trend Page: Track MTD and YTD Movement
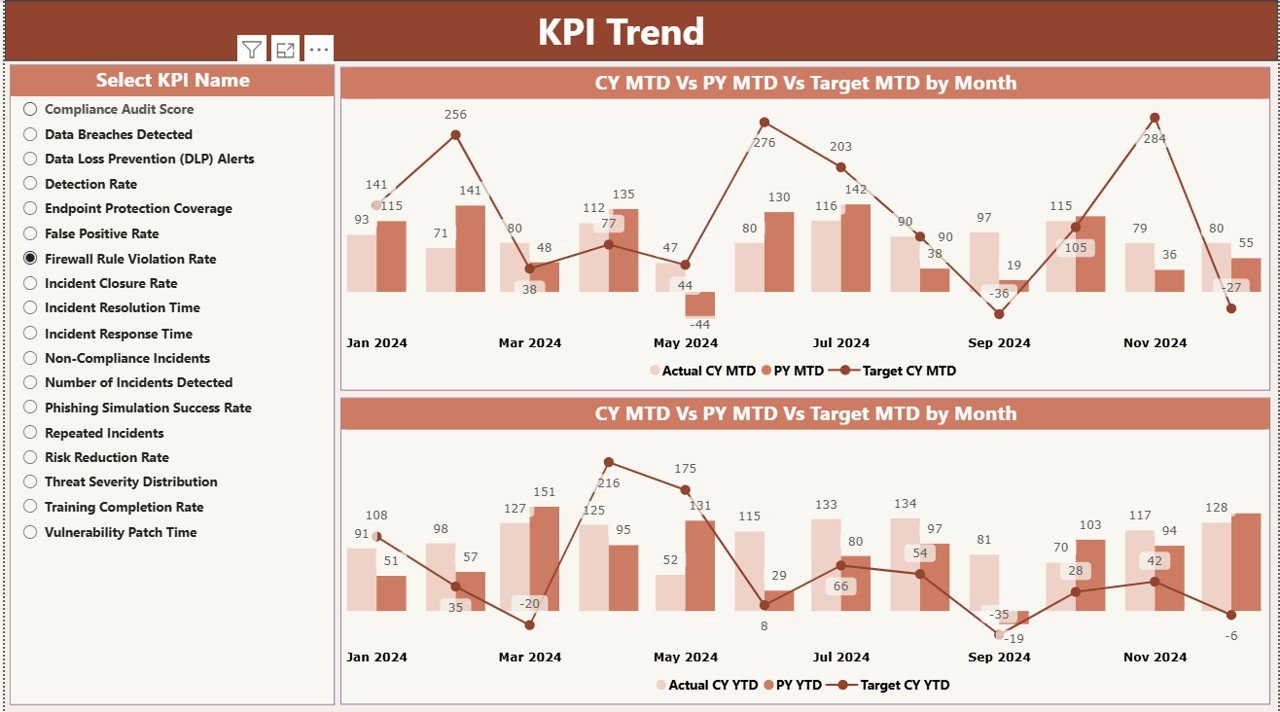
The KPI Trend page gives deeper visual insights into how KPIs behave over time. Teams can select a KPI from the slicer on the left and view its performance across months.
This page contains two combo charts:
-
Chart 1: Current Year Actual, Previous Year Actual, and Target for MTD
-
Chart 2: Current Year Actual, Previous Year Actual, and Target for YTD
These trend charts help identify:
-
rising threats
-
reduced vulnerabilities
-
improvement areas
-
patterns across months
The ability to compare current data with past performance helps teams make smarter decisions.
Click to Purchases Cybersecurity Incident KPI Dashboard in Power BI
3. KPI Definition Page: Detailed KPI Knowledge
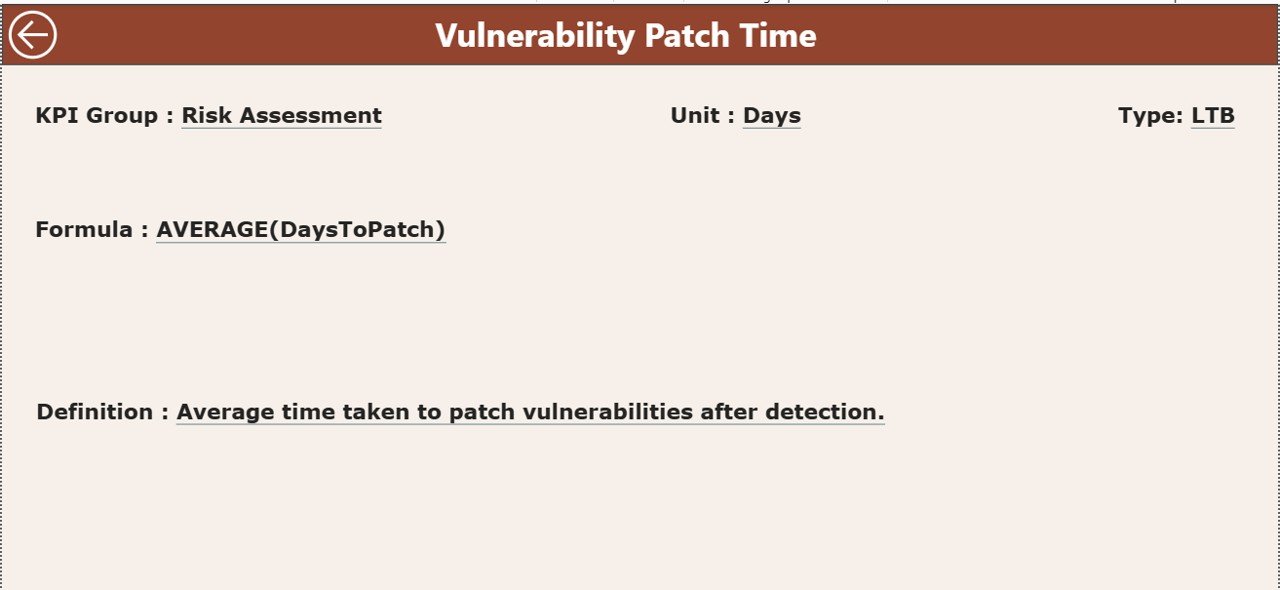
This page works as a drill-through page. Users can click on any KPI in the Summary Page and view its complete details:
-
Formula
-
Definition
-
KPI Number
-
Unit
-
Group
-
Type (UTB or LTB)
This page stays hidden until the user drills through. A back button helps users return to the Summary Page. This feature creates a smooth and user-friendly reporting experience.
Excel-Based Data Input Structure
The dashboard uses three Excel worksheets to collect data. This makes updating numbers very easy.
1. Input_Actual Sheet
In this sheet, users fill:
-
KPI Name
-
Month (first date of each month)
-
MTD Actual
-
YTD Actual
This sheet captures actual performance data.
2. Input_Target Sheet
In this sheet, users fill:
-
KPI Name
-
Month
-
MTD Target
-
YTD Target
This sheet captures the targets for each KPI.
3. KPI Definition Sheet
This sheet contains:
-
KPI Number
-
KPI Group
-
KPI Name
-
Unit
-
Formula
-
Definition
-
Type (UTB or LTB)
This data makes KPI reporting transparent and consistent.
Why the Cybersecurity Incident KPI Dashboard Matters Today
Cyber threats keep growing every day. Attackers use advanced tools, and organizations must stay alert. Because of this, cybersecurity teams cannot rely on manual reporting or scattered spreadsheets. They need quick insights that help them act before damage happens.
This dashboard matters because it helps teams:
-
monitor security health
-
respond faster
-
align with compliance requirements
-
identify areas of risk
-
track incident closure rates
-
measure team efficiency
-
improve the security posture
-
reduce false positives and noise
As a result, organizations protect their data and meet regulatory expectations.
How Does This Dashboard Improve Cybersecurity Decision-Making?
The dashboard improves decision-making because it:
-
shows real performance instantly
-
highlights gaps between actual and target
-
compares performance with previous year
-
allows users to explore detailed trends
-
gives drill-down capability
-
helps teams understand KPI definitions
-
keeps data neat and structured
When leaders see clear visuals, they take faster and smarter decisions. The dashboard removes confusion and brings clarity.
What KPIs Does a Cybersecurity Incident Dashboard Usually Track?
Every dashboard can track different KPIs, depending on the organization. However, most cybersecurity dashboards include metrics such as:
-
Number of incidents
-
Incident detection time
-
Incident response time
-
Mean time to detect (MTTD)
-
Mean time to respond (MTTR)
-
Number of vulnerabilities
-
Patch compliance
-
Malware detections
-
Phishing attempts blocked
-
Data breach attempts
-
Endpoint protection status
-
Identity and access violations
Measuring these KPIs helps teams stay aware of threats and performance levels.
Advantages of a Cybersecurity Incident KPI Dashboard in Power BI
A dashboard provides many benefits. Below are the biggest advantages with explanations.
1. Clear Visibility Into All Incidents
The dashboard gives real-time visibility of incidents and trends. Teams understand what happens, when it happens, and how frequently it happens.
2. Faster Decision-Making
Because the dashboard shows simple visuals, leaders take quick decisions without reading long reports.
3. Better Resource Allocation
Teams identify high-risk areas and assign resources effectively.
4. Stronger Compliance Support
Many regulations require organizations to track and report performance. The dashboard simplifies this process.
5. Improved Response Efficiency
MTD and YTD insights help the team measure how fast they detect and resolve incidents.
6. Transparent KPI Reporting
The KPI Definition Page ensures everyone knows how each KPI works.
7. Easy Data Updates
Excel-based input sheets make data entry straightforward.
8. Consistent Performance Monitoring
Monthly and yearly comparisons help teams maintain consistency.
Best Practices for the Cybersecurity Incident KPI Dashboard
To get maximum value from this dashboard, teams can follow these best practices.
1. Update Data Every Month
Always update MTD and YTD numbers at the start of every month.
2. Review KPI Definitions Regularly
Ensure all KPIs remain relevant to current security needs.
3. Track Trends, Not Just Values
Observe MTD and YTD movement to identify hidden patterns.
4. Keep KPI Groups Simple
Avoid adding too many categories; keep KPIs grouped for clarity.
5. Use the Slicers Effectively
Switch between months and KPI groups to explore different views.
6. Compare Current and Previous Year
Use the PY comparison to assess long-term security improvement.
7. Take Action on Red Indicators
Always follow up on KPIs that show ▼ red icons.
8. Share Insights With Stakeholders
Discuss trends with leadership teams, auditors, and security partners.
Conclusion
A Cybersecurity Incident KPI Dashboard in Power BI gives organizations the clarity, control, and confidence they need to manage cyber risks. It transforms raw Excel data into meaningful insights that drive real action. With its Summary Page, KPI Trend Page, and KPI Definition Page, teams understand their performance instantly. MTD, YTD, target comparisons, and previous year insights help track progress continuously.
When cybersecurity teams use this dashboard, they respond faster, stay organized, and improve their security posture. As threats keep growing, this dashboard becomes an essential tool for every organization.
Frequently Asked Questions (FAQs)
1. What is a Cybersecurity Incident KPI Dashboard?
It is a Power BI tool that tracks cybersecurity KPIs using visuals, comparisons, and detailed metrics.
2. Who should use this dashboard?
Cybersecurity analysts, SOC teams, IT managers, CISOs, and audit teams can use it.
3. Why does the dashboard use Excel as the data source?
Excel makes data updates simple. Anyone can edit or replace the data without technical skills.
4. Can this dashboard track monthly and yearly performance?
Yes, it tracks MTD and YTD performance for every KPI.
5. Does the dashboard support drill-through?
Yes, users can drill through to view KPI definitions, formulas, and detailed descriptions.
6. Can organizations add more KPIs?
Yes, organizations can add more KPIs by updating the KPI Definition sheet.
7. What makes this dashboard useful for cybersecurity teams?
It improves visibility, accelerates decision-making, and strengthens security posture.
Visit our YouTube channel to learn step-by-step video tutorials