Audit teams spend an average of 40% of their time hunting for data instead of analyzing it, according to ACCA’s 2024 digital audit survey. The Compliance and Audit Dashboard in Power BI flips that ratio — 5 KPI cards, 11 interactive visuals, and multi-level slicers across 5 dedicated pages give auditors, compliance officers, and risk leads a single view of audits, findings, remediation cost, and auditor performance.
This dashboard is built for internal audit, compliance, and risk teams who need enterprise-grade visibility without the $80 to $250 per user per month that enterprise GRC platforms charge. Setup takes under 10 minutes — connect the .pbix file to your audit tracker, click Refresh, and every chart and card updates. This blog post walks through every page, every visual, and answers the most common questions about deploying the Compliance and Audit Dashboard in Power BI for SOX, ISO 27001, HIPAA, GDPR, and PCI-DSS programs.
Key Features of the Compliance and Audit Dashboard in Power BI
This Power BI template packs five production-ready pages into one .pbix file. Here is what you get out of the box:
- 5 KPI cards — Total Audits, Total Findings, Total Open Findings, Total Resolved Findings, and Total Remediation Cost sit at the top of the Overview page.
- 11 interactive visuals — spread across Risk Analysis, Framework Compliance, Auditor Performance, and Trend Analysis pages.
- Multi-framework support — SOX, ISO 27001, HIPAA, GDPR, and PCI-DSS covered out of the box; add NIST CSF or SOC 2 without rebuilding.
- Slicers on every page — Department, Region, Compliance Framework, Audit Type, Risk Level, Finding Severity, Priority, and Year.
- Auditor scorecard — Average Satisfaction Score by Auditor, Duration Days by Department, and audit status mix.
- Full edit access — plain .pbix file, no locked sections, no password protection, no telemetry.
- Publishes anywhere Power BI runs — Power BI Desktop, Power BI Service, and the Power BI mobile app.
The design goal is simple: give an internal audit team of 3-10 people the same analytical firepower as a Fortune-500 GRC stack, for a one-time $17.99.
Dashboard Pages Explanation
Page 1 — Overview
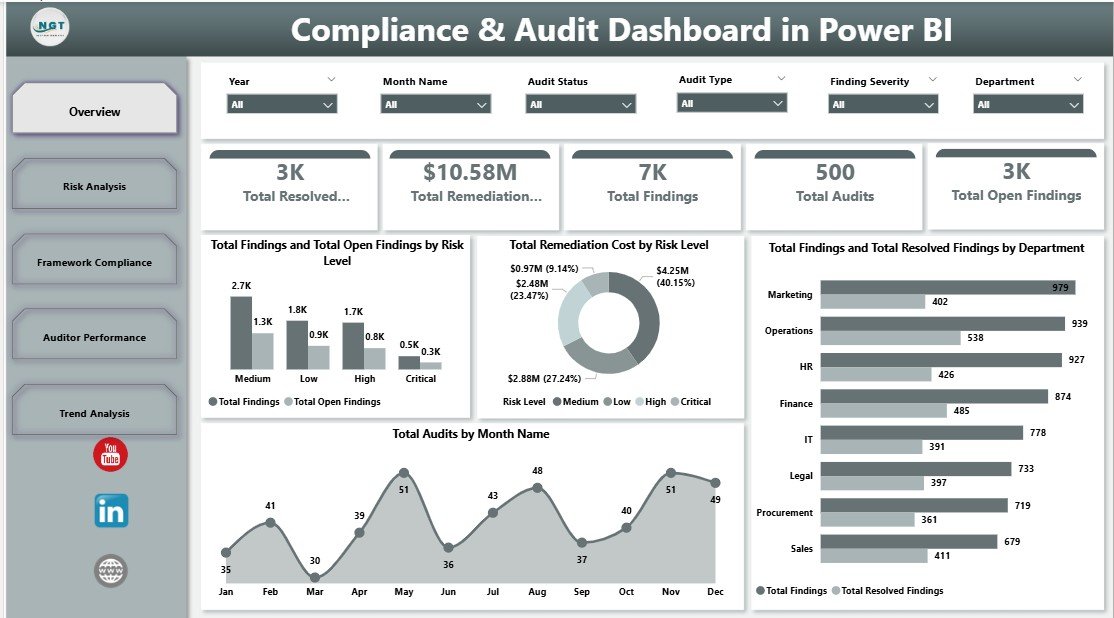
The Overview page is the executive summary. Five KPI cards across the top — Total Audits, Total Findings, Total Open Findings, Total Resolved Findings, and Total Remediation Cost — give the audit committee an at-a-glance snapshot. Four supporting visuals drill deeper:
- Total Findings and Total Open Findings by Risk Level — Compares total findings against unresolved ones across Low, Medium, High, and Critical risk bands so teams can see where remediation is lagging.
- Total Remediation Cost by Risk Level — Shows where cost concentrates. Typically, Critical and High risk findings drive 70-80% of total spend, which is an immediate prioritization signal.
- Total Findings and Total Resolved Findings by Department — Compares raw finding volume with closure rate per department, highlighting which teams are keeping up and which are falling behind.
- Total Audits by Month Name — Surfaces the annual audit cadence so audit committees can plan resourcing around peak months like year-end SOX testing.
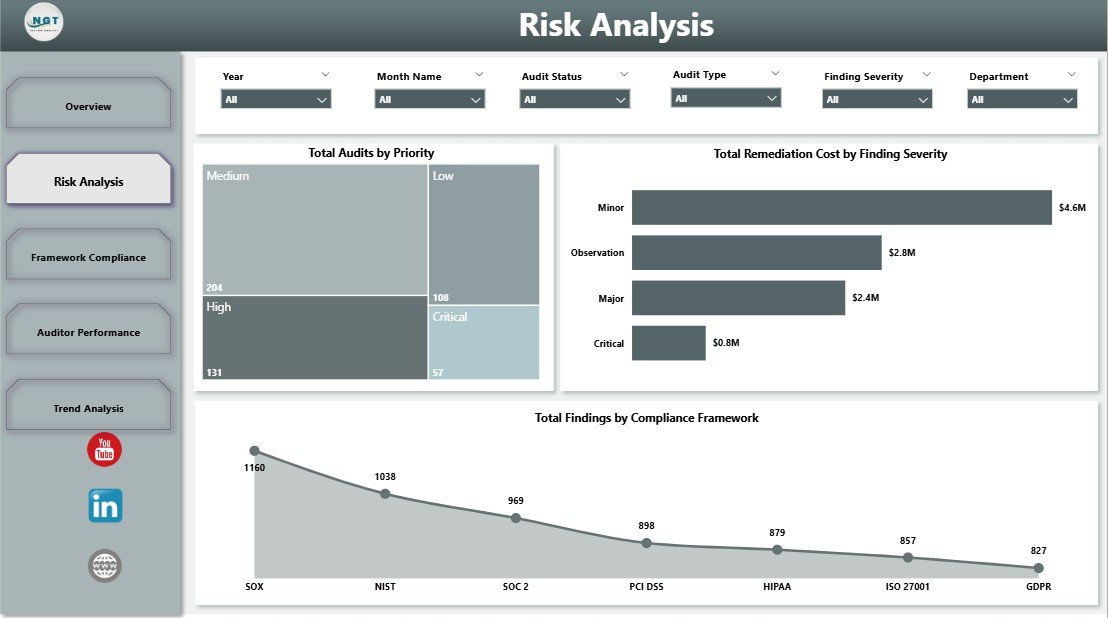
Page 2 — Risk Analysis
The Risk Analysis page zooms into where the program is most exposed and how much it costs to fix the damage.
- Total Audits by Priority — Splits audit workload across priority bands so audit leaders can confirm high-priority engagements are getting their fair share of hours.
- Total Remediation Cost by Finding Severity — Quantifies the dollar impact of each severity tier, helping CFOs justify investment in preventive controls.
- Total Findings by Compliance Framework — Breaks findings down by SOX, ISO 27001, HIPAA, GDPR, and PCI-DSS so compliance leads see which frameworks are driving the backlog.
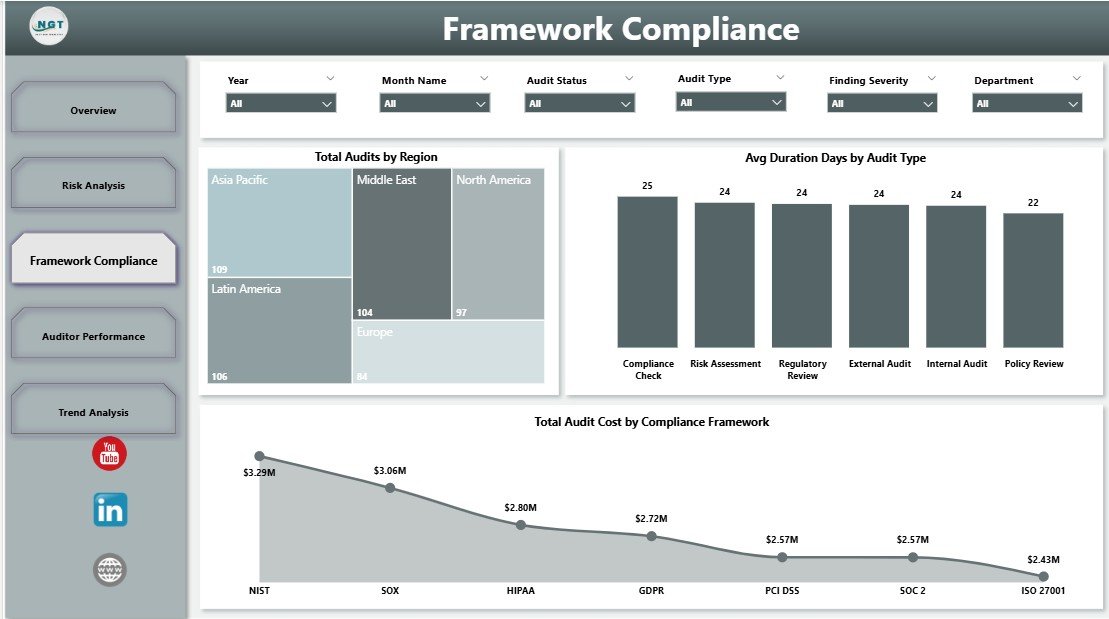
Page 3 — Framework Compliance
Compliance leads often need to answer “where does each framework stand?” in board meetings. This page answers exactly that.
- Total Audits by Region — Shows audit distribution across regions (North America, EMEA, APAC, LATAM) so global compliance teams can spot coverage gaps.
- Avg Duration Days by Audit Type — Compares how long internal, external, IT, and operational audits typically run, helping set realistic timelines for the next audit cycle.
- Total Audit Cost by Compliance Framework — Reveals which frameworks consume the most audit budget, useful input for annual GRC planning.
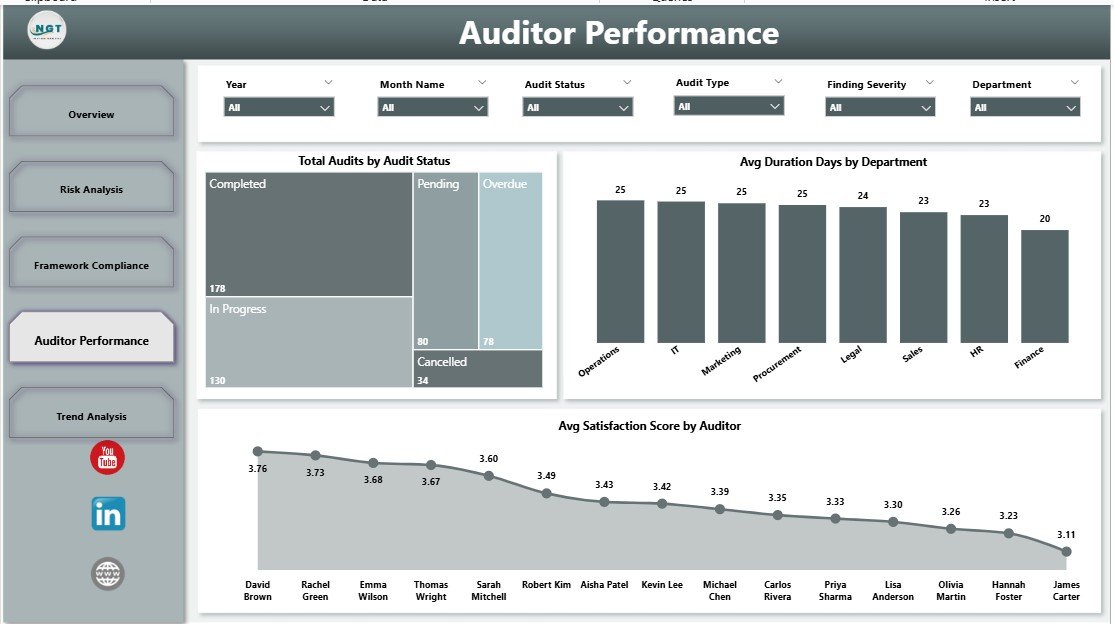
Page 4 — Auditor Performance
Managing an audit team means knowing who is delivering and where the process friction lives. This page puts both on one screen.
- Total Audits by Audit Status — Tracks the mix of Planned, In-Progress, Completed, and Overdue engagements at any point in the year.
- Avg Duration Days by Department — Shows which departments typically take longest to close an audit, pointing to process friction or resourcing issues.
- Avg Satisfaction Score by Auditor — Ranks individual auditors by stakeholder feedback score, useful for performance reviews and matching auditors to engagements.
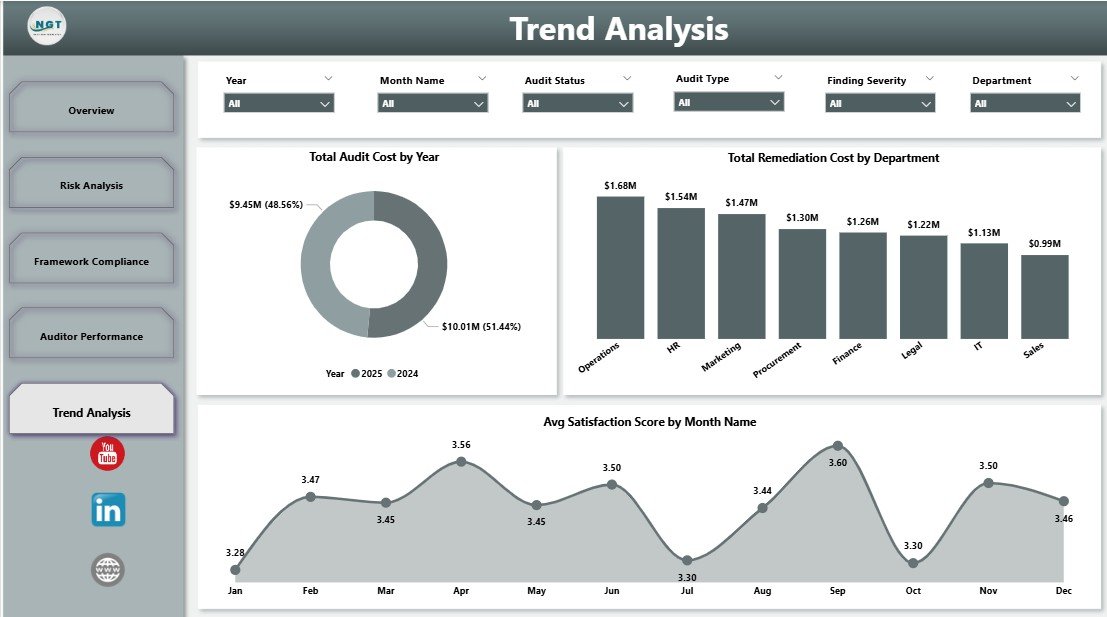
Page 5 — Trend Analysis
The last page zooms out to multi-year patterns — essential input for annual planning and audit committee narratives.
- Total Audit Cost by Year — Charts multi-year audit spend to reveal whether the program is becoming leaner or more expensive over time.
- Total Remediation Cost by Department — Highlights which departments carry the biggest remediation bill, a direct pointer to where control investments pay back fastest.
- Avg Satisfaction Score by Month Name — Tracks stakeholder satisfaction seasonality, often exposing burnout during peak audit months.
Compliance and Audit Dashboard in Power BI vs. Tableau vs. Paid GRC SaaS — Feature Comparison
| Feature | Compliance and Audit Dashboard in Power BI | Tableau / Qlik GRC Template | AuditBoard / LogicGate / MetricStream |
|---|---|---|---|
| Cost | $17.99 one-time ✅ | $70 / user / month (Tableau) | $80–$250 / user / month |
| Platform | Power BI Desktop (free) | Tableau Desktop / Qlik Sense | Proprietary web SaaS |
| Setup time | Under 10 minutes ✅ | 2–5 days | 4–12 weeks implementation |
| Frameworks covered (SOX, ISO, HIPAA, GDPR, PCI) | All 5 out of the box ✅ | Template-dependent | All 5 |
| Customizable DAX / visuals | Full edit access ✅ | Full edit | Limited without admin role |
| Year-1 cost at 5 users | $17.99 (one-time) ✅ | ~$4,200 | $4,800–$15,000+ |
| Lifetime access, no subscription | Yes ✅ | No | No |
For compliance and audit teams that want enterprise-grade visibility without paying enterprise-grade license fees, the Compliance and Audit Dashboard in Power BI sits in the sweet spot.
Who Should Use This Template
Perfect for:
- Internal audit managers at 50–2,000 person companies running 10–50 audits per year
- Compliance officers tracking SOX, ISO 27001, HIPAA, GDPR, or PCI-DSS programs
- Risk and governance leads who need a fast, presentable view for audit committee meetings
- Big-four and mid-market consulting firms building client audit reports in Power BI
- Finance controllers reporting remediation cost to the CFO
Not a fit if:
- You are a Fortune-500 enterprise needing SOC 2 Type II, SSO, role-based access, and a full audit trail of every change (use AuditBoard or MetricStream instead)
- You work in a regulated industry requiring a FedRAMP or HITRUST-certified GRC platform
- Your team works exclusively on macOS — Power BI Desktop is Windows-only
Real-World Use Cases
Priya runs internal audit at a 600-person fintech. She uses the Compliance and Audit Dashboard in Power BI to present monthly findings-resolution rates to the audit committee — filtered to the engineering and product departments where SOX controls concentrate. She publishes the report to Power BI Service and sends the link to the CFO the day before every audit committee meeting, saving her the 4-hour PowerPoint exercise she used to do. Annual savings versus AuditBoard: around $12,000.
Daniel is a senior manager at a Big-Four consulting firm. He customizes the Power BI model for each client engagement — swaps the color palette to match the client’s brand, loads their audit tracker data, and delivers a branded dashboard on day three instead of spending a week building one from scratch. His team now reuses this template on every compliance advisory engagement.
Ana heads compliance at a mid-size healthcare provider subject to HIPAA. She filters the Framework Compliance page to HIPAA and GDPR, shows regulators exactly which controls have open findings, and uses the Remediation Cost by Department chart to justify her next year’s budget request to the CFO. Before the dashboard, this was a two-week reporting project each quarter.
Advantages of the Compliance and Audit Dashboard in Power BI
Three concrete advantages stand out versus both DIY Excel audit reports and enterprise GRC SaaS:
- One-time cost vs. per-user-per-month subscription. At $17.99 one-time, the template pays for itself on day one. For a 5-person audit team, year-1 savings versus AuditBoard can exceed $12,000; versus Tableau licensing alone, savings exceed $4,000.
- Familiar Power BI interface. Anyone on your team who has used Power BI before is productive in 10 minutes. No new tool to learn, no implementation consultant required, no multi-week rollout.
- Multi-year view out of the box. The Trend Analysis page gives you the 3-year “is the program improving?” view that most teams build from scratch every year — a 20-40 hour exercise saved.
Power BI’s licensing model helps here. You can start with free Power BI Desktop, share .pbix files over email, and upgrade to Pro ($10/user/month) only when you need live sharing via the service. Microsoft’s Power BI licensing documentation covers the tiers in detail.
Opportunities for Improvement
Being honest about what this template does not do keeps expectations realistic:
- No workflow engine. This dashboard reports on audit data — it does not route finding approvals, capture signoffs, or manage remediation tickets. For that you need AuditBoard or a Jira/ServiceNow workflow.
- Windows-only at the desktop level. Power BI Desktop runs only on Windows. Mac and Linux users need to publish the .pbix from a Windows machine or a virtual Windows environment, then view it in the browser through Power BI Service.
- Self-service data refresh. You refresh the model yourself. If you want scheduled refreshes against a SQL data warehouse, you need a Power BI Pro license and on-premises data gateway — a small but real cost above the template itself.
- No built-in data input forms. The dashboard reads data; it does not collect it. Pair it with an Excel or SharePoint list as the data entry surface.
Best Practices
Teams who get the most out of the Compliance and Audit Dashboard in Power BI tend to follow a handful of patterns:
- Keep the source data tab pristine. Never rename the columns the DAX measures reference. If you need extra fields, add them to the right of the existing columns so the measures keep working.
- Refresh on a schedule. If you publish to Power BI Service, set an automatic daily refresh so the audit committee always sees a fresh view.
- Use bookmarks for canned views. Create bookmarks for “SOX only,” “HIPAA only,” “Critical risk only” so your team can jump to them in one click.
- Lock down the gold model in Power BI Service. Publish the .pbix once as the team’s “source of truth” and restrict edit access; let analysts build their own reports on top of the dataset via Analyze in Excel.
- Export to PowerPoint for board packs. The File → Export → PowerPoint option creates a branded slide deck in 30 seconds — perfect for the quarterly audit committee pack.
Explore Relevant Templates
- Also available as: Compliance and Audit Dashboard in Excel — same 5 pages, same KPIs, Excel pivot model for teams without Power BI. Read the full Excel walkthrough here.
- Corporate Governance Dashboard in Power BI — board-level governance metrics alongside audit findings.
- Financial Auditing Dashboard in Power BI — focused on financial statement audits, variances, and control testing.
- ESG Environmental Dashboard in Power BI — the natural companion for sustainability and ESG reporting audits.
- 💎 Save 50%+ — Get all 8 GRC templates in the Safety & Compliance Commander Bundle for $74.99.
Frequently Asked Questions
What KPIs does the Compliance and Audit Dashboard in Power BI track?
The Compliance and Audit Dashboard in Power BI tracks 5 KPI cards — Total Audits, Total Findings, Total Open Findings, Total Resolved Findings, and Total Remediation Cost — plus 11 interactive visuals across risk, framework, auditor, and multi-year trend views.
How does this compare to AuditBoard or LogicGate?
The Compliance and Audit Dashboard in Power BI costs $17.99 one-time versus $80 to $250 per user per month for AuditBoard or LogicGate. It covers the same SOX, ISO 27001, HIPAA, GDPR, and PCI-DSS frameworks but without SSO, role-based access, or an embedded workflow engine — it is a reporting layer, not a full GRC platform.
How long does setup take for the Compliance and Audit Dashboard in Power BI?
Setup takes under 10 minutes. Open the .pbix file in Power BI Desktop, paste your audit data into the data model keeping the column headers intact, and click Refresh. All 5 KPI cards and 11 visuals update automatically — no DAX rewriting needed for the standard columns.
Does the template work with Power BI Service and Power BI mobile?
Yes. The Compliance and Audit Dashboard in Power BI publishes to Power BI Service on the free tier for personal use, Pro license for sharing, and Premium per user for large organizations. Once published, all 5 pages render on the Power BI mobile app for iOS and Android.
Which compliance frameworks does the template support?
Out of the box the Compliance and Audit Dashboard in Power BI supports SOX, ISO 27001, HIPAA, GDPR, and PCI-DSS. Because the Framework field is a simple dimension, you can add internal frameworks like NIST CSF, SOC 2, or custom control libraries without rebuilding the model.
Can I customize the charts, DAX measures, and colors?
Yes. The Compliance and Audit Dashboard in Power BI is a plain .pbix file with full edit access — swap colors, rename measures, add new pages, or rebuild visuals. There are no locked sections, no password protection, and no telemetry back to NextGenTemplates.
Is the data secure — does anything phone home?
No data leaves your machine. The Compliance and Audit Dashboard in Power BI is a self-contained .pbix file. When published to Power BI Service, data is stored inside your organization’s Microsoft tenant — NextGenTemplates has no access to your audit data at any point.
About the Author
Built by PK — Microsoft Certified Professional with 15+ years of Excel, Google Sheets, and Power BI experience. Founder of NextGenTemplates, reaching 300K+ subscribers across YouTube channels. Every template is hand-built and tested before release.
Conclusion
Compliance and audit teams do not need a $15,000-a-year GRC platform to run a credible program. The Compliance and Audit Dashboard in Power BI delivers 5 KPI cards, 11 visuals, multi-framework coverage (SOX, ISO 27001, HIPAA, GDPR, PCI-DSS), and a multi-year trend view — for $17.99, one time, with lifetime access and no per-user fees.
👉 Click here to Purchase the Compliance and Audit Dashboard in Power BI
Instant download · One-time payment · No subscription · Lifetime access
🎥 For step-by-step tutorials, visit Youtube.com/@PK-AnExcelExpert.
📅 Last updated: April 2026