DevOps KPI Dashboard in Power BI 3
19
Nov 2025
0Comments Off on DevOps KPI Dashboard in Power BI 3
PK
Meet PK, the founder of PK-AnExcelExpert.com! With over 15 years of experience in Data Visualization, Excel Automation, and dashboard creation. PK is a Microsoft Certified Professional who has a passion for all things in Excel. PK loves to explore new and innovative ways to use Excel and is always eager to share his knowledge with others. With an eye for detail and a commitment to excellence, PK has become a go-to expert in the world of Excel. Whether you're looking to create stunning visualizations or streamline your workflow with automation, PK has the skills and expertise to help you succeed. Join the many satisfied clients who have benefited from PK's services and see how he can take your Excel skills to the next level!
https://www.pk-anexcelexpert.com
Related Articles
Energy Dashboard in Excel
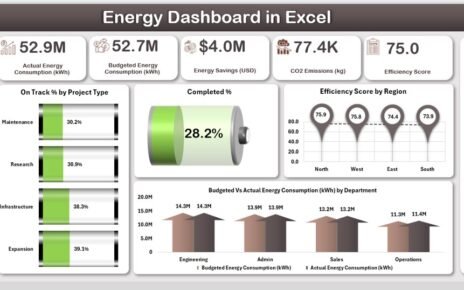
Energy efficiency is no longer a choice—it is a necessity for organizations that want to reduce costs, improve sustainability, and
Infographics in Power BI dashboard
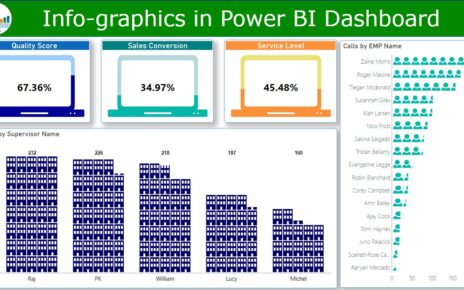
In this article, you will learn how to use Infographic Designer Visual in Power BI. This Visual can improve the
Smart Cities Purchasing Dashboard in Power BI
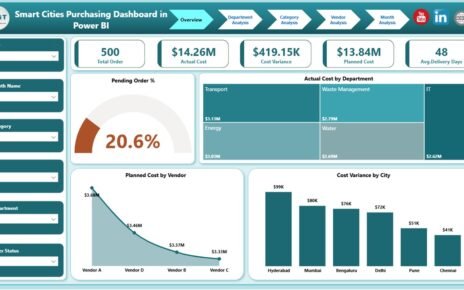
Modern smart cities depend on data, transparency, and speed. Every purchasing decision impacts public spending, service quality, and citizen trust.


