Every organization wants to work within its budget. Yet, financial teams struggle because numbers often stay scattered across spreadsheets, emails, and outdated reports. When leaders cannot see real-time budget performance, they make delayed or incorrect decisions. Because every decision impacts operational efficiency, cost control, and profitability, companies need a smart way to measure and monitor their financial status.
A Budget Adherence KPI Dashboard in Power BI solves this challenge instantly. It brings all budget-related KPIs into one simple, visual, and interactive dashboard. Finance managers, controllers, and department heads can track actual spending, compare it with targets, and analyze deviations easily. Since Power BI offers automation, visual storytelling, and real-time analysis, teams can make decisions faster and with full confidence.
In this detailed article, you will learn what a Budget Adherence Dashboard is, how it works, its key features, advantages, best practices, and answers to common questions. Whether you manage operations, finance, procurement, or project budgets, this guide helps you understand every part of the dashboard.
Click to Purchases Budget Adherence KPI Dashboard in Power BI
What Is a Budget Adherence KPI Dashboard in Power BI?
A Budget Adherence KPI Dashboard in Power BI is a ready-to-use financial monitoring tool that tracks how well an organization sticks to its planned budget. It shows monthly and yearly spending trends, actual vs target comparison, KPI performance, target achievement rates, and previous year comparisons.
You can easily track:
-
Actual spending
-
Target spending
-
Monthly budget performance (MTD)
-
Year-to-date metrics (YTD)
-
Variances
-
Trend analysis
-
KPI group performance
-
KPI definitions and formulas
Since the dashboard uses Power BI, users see auto-updated visuals, slicers, charts, and tables. This eliminates manual reporting and saves hours every month.
Why Do Businesses Need a Budget Adherence Dashboard?
Organizations deal with hundreds of financial transactions every month. Because teams track them manually, they miss trends and unusual deviations. A dashboard gives clarity and helps leaders control costs before they escalate.
You need a Budget Adherence Dashboard because it:
-
Shows real-time budget vs actual performance
-
Identifies overspending early
-
Improves forecasting accuracy
-
Helps departments plan smarter
-
Reduces manual work and reporting time
-
Creates transparency across teams
-
Supports quick financial decision-making
With a dashboard, finance teams stop guessing and start managing budgets with confidence.
Key Features of the Budget Adherence KPI Dashboard in Power BI
The Budget Adherence Dashboard comes with three intuitive pages, each designed to simplify financial monitoring.
Let’s explore them one by one.
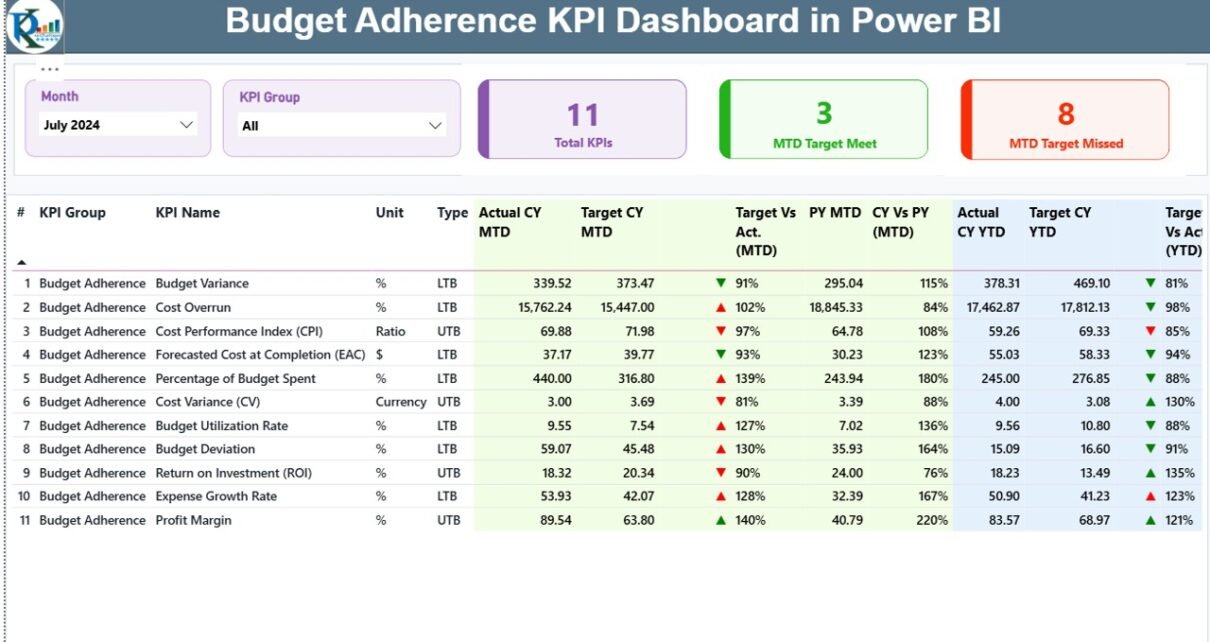
1. Summary Page – Complete KPI Overview
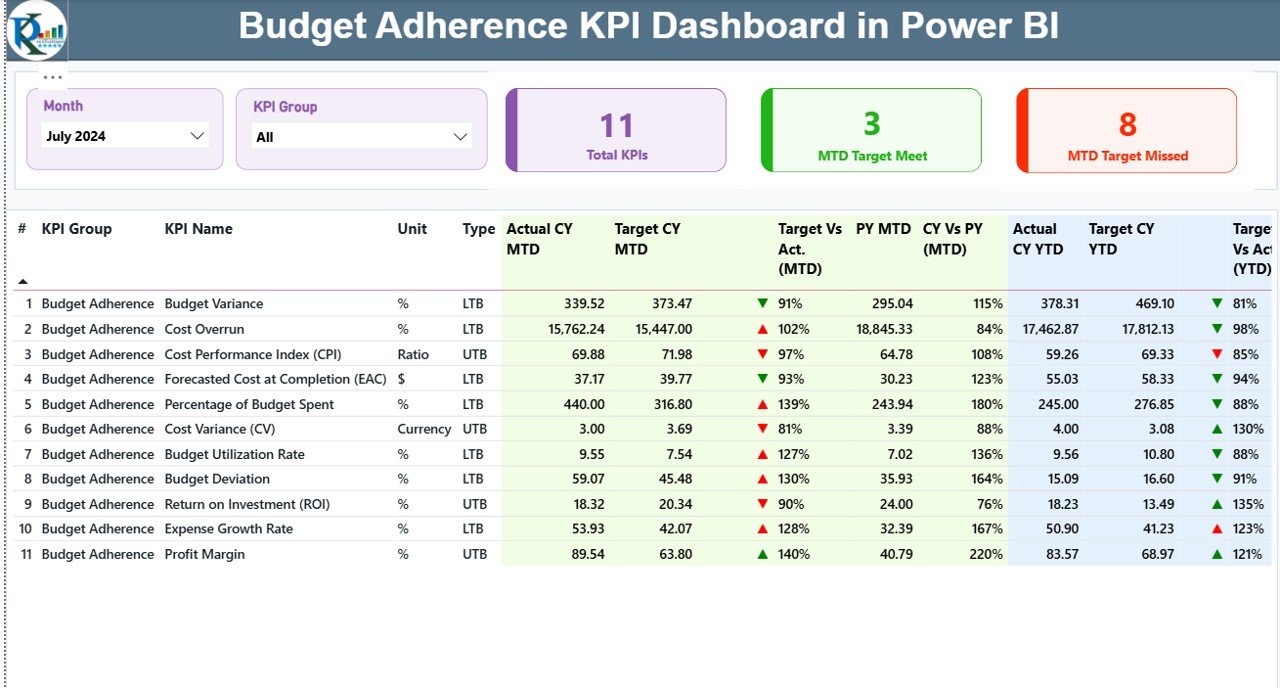
The Summary Page acts as the main control center of the dashboard. It includes everything users need to understand the budget adherence status at a glance.
Top Highlights of the Summary Page
-
Month Slicer – Select the month to view the updated numbers instantly.
-
KPI Group Slicer – Filter KPIs by group to make analysis more focused.
-
Three KPI Cards:
-
Total KPIs count
-
MTD Target Met
-
MTD Target Missed
-
These cards give quick performance signals as soon as you open the dashboard.
Detailed KPI Table
Below the cards, you see a detailed table with the following information for every KPI:
-
KPI Number – Sequence number
-
KPI Group – The category of the KPI
-
KPI Name – Name of the KPI
-
Unit – Measurement unit
-
Type – UTB (Upper the Better) or LTB (Lower the Better)
-
Actual CY MTD – Current year’s actual value for MTD
-
Target CY MTD – MTD target value
-
MTD Icon – ▲ or ▼ with green/red colors to show performance
-
Target vs Actual (MTD) – Percentage of target achieved
-
PY MTD – Previous year’s MTD value
-
CY vs PY (MTD) – Comparison percentage
-
Actual CY YTD – Current year YTD numbers
-
Target CY YTD – YTD target numbers
-
YTD Icon – Visual signal for YTD performance
-
Target vs Actual (YTD) – Target achievement percentage
-
PY YTD – Previous year YTD number
-
CY vs PY (YTD) – YTD comparison
This powerful table helps managers understand both short-term and long-term financial performance.
Click to Purchases Budget Adherence KPI Dashboard in Power BI
2. KPI Trend Page – Clear Visual Comparison
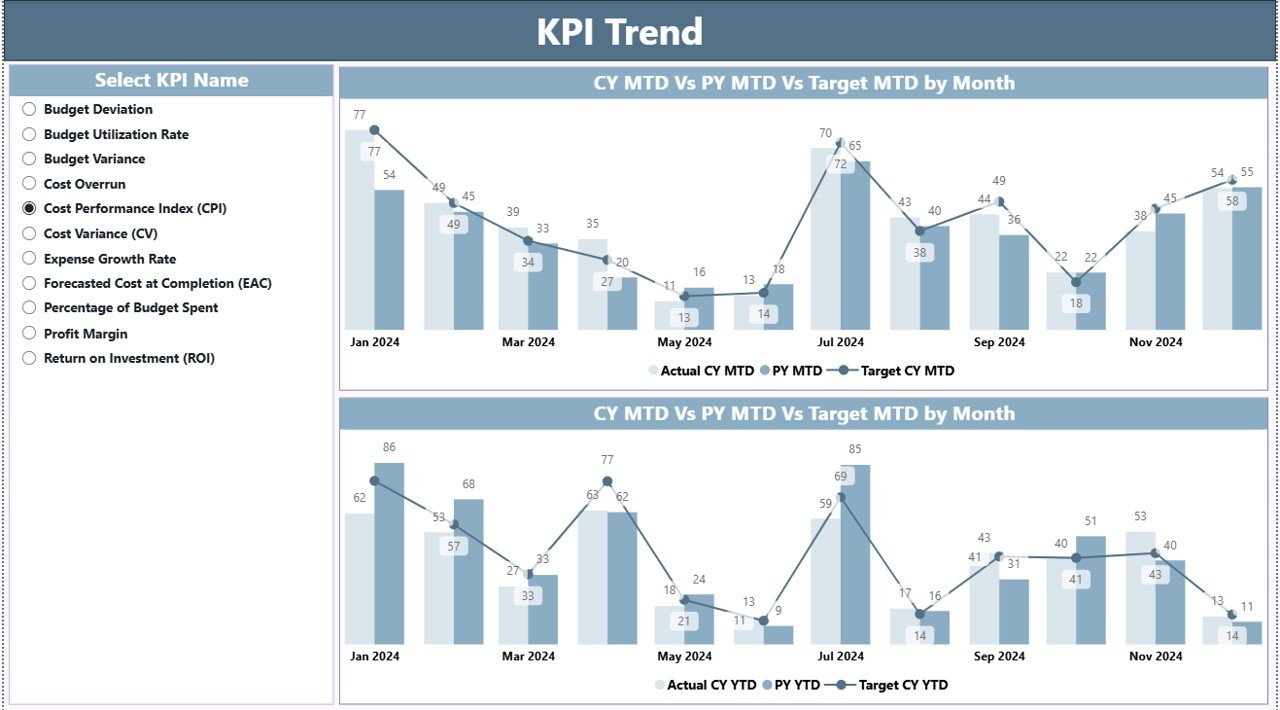
The KPI Trend Page helps users track budget performance over time.
Here you can see:
-
A slicer to pick any KPI
-
Two combo charts that show MTD and YTD trends
-
Lines and bars that compare:
-
Current year actuals
-
Previous year actuals
-
Targets
-
This page helps users understand:
-
How KPIs change month by month
-
Whether performance is improving
-
How close or far KPIs are from targets
-
How current numbers compare to past years
Since the page focuses on trends, teams get complete financial visibility.
3. KPI Definition Page – Complete Understanding of Every KPI
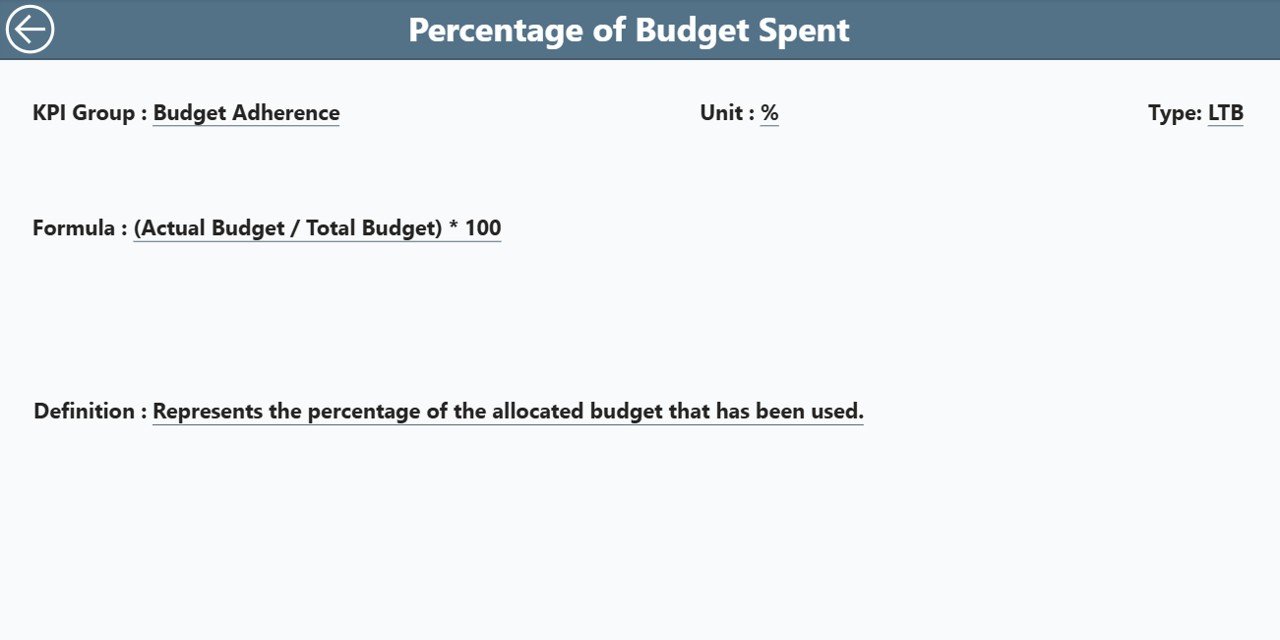
The KPI Definition Page is a hidden drill-through page. You can open it by right-clicking a KPI from the Summary Page and selecting the drill-through option.
It includes:
-
KPI Number
-
KPI Group
-
KPI Name
-
Unit
-
Formula
-
KPI Definition
-
KPI Type (UTB or LTB)
This page helps new users understand the exact meaning and logic behind each KPI.
To return to the main page, simply click the Back Button available in the top-left corner.
Excel Data Structure Behind the Dashboard
Click to Purchases Budget Adherence KPI Dashboard in Power BI
The dashboard uses an Excel file as the backend data source. The file contains three important sheets:
1. Input_Actual Sheet
This sheet captures:
-
KPI Name
-
Month (use the first date of the month)
-
MTD actual
-
YTD actual
Simply fill in your organization’s numbers, and the dashboard updates itself.
2. Input_Target Sheet
This sheet includes:
-
KPI Name
-
Month
-
MTD target
-
YTD target
Targets help evaluate financial discipline and forecast accuracy.
3. KPI Definition Sheet
This page stores metadata:
-
KPI Number
-
KPI Group
-
KPI Name
-
Unit
-
Formula
-
Definition
-
Type (UTB or LTB)
These details ensure consistent KPI logic across departments.
How Does a Budget Adherence Dashboard Help Organizations?
A Budget Adherence Dashboard improves performance across several areas:
1. Better Budget Visibility
You see how each department performs against its budget instantly. Because of real-time visibility, decision-making becomes smoother.
2. Faster Identification of Variances
You catch overspending and underspending before they grow. This helps teams take quick corrective action.
3. Improved Forecasting
With trends and comparisons, forecasting becomes more accurate and reliable.
4. Stronger Financial Control
The dashboard helps leaders enforce financial discipline because every KPI stays trackable.
5. Enhanced Collaboration
Departments share the same dashboard, which reduces confusion, emails, and manual reporting.
Advantages of a Budget Adherence KPI Dashboard in Power BI
A dedicated section helps highlight the direct benefits. Here are the most valuable advantages:
1. Real-Time Monitoring
You get real-time updates for spending, targets, and variances. This keeps your financial planning strong and accurate.
2. Easy Visualization
Charts, slicers, cards, and color-coded indicators make data easy to understand.
3. Accurate Performance Comparison
With MTD and YTD comparisons, you evaluate performance from every angle.
4. Historical Trend Understanding
Trends show movement over time, helping leaders predict future outcomes.
5. Zero Manual Reporting
Automation reduces workload and removes human errors.
6. Clear KPI Alignment
Users understand each KPI’s logic because of the built-in KPI Definition page.
7. Better Decision Making
Leaders make smarter decisions because they see insights clearly and instantly.
Best Practices for Using the Budget Adherence KPI Dashboard in Power BI
To get maximum benefits, follow these best practices:
1. Update Data Regularly
Fill the Actual and Target sheets every month to keep insights accurate.
2. Use KPI Groups Effectively
Categorize KPIs based on departments or financial areas. This improves clarity and improves analysis.
3. Keep KPI Definitions Clear
Make formula and definitions short and simple, so anyone can understand them easily.
4. Track Trends Frequently
Review the Trend Page weekly or monthly to notice changes early.
5. Use Icons Wisely
Green arrows show positive performance, while red arrows show gaps. These visual hints support quick decisions.
6. Conduct Monthly Review Meetings
Use the Summary Page during meetings so everyone stays aligned.
7. Start with Fewer KPIs
Choose only the KPIs that matter most. Add new KPIs gradually to avoid clutter.
8. Automate Refresh Scheduling
Use Power BI Gateway to refresh the Excel file automatically.
Conclusion
A Budget Adherence KPI Dashboard in Power BI transforms the way organizations manage their financial performance. It gives real-time visibility, supports faster decisions, simplifies reporting, and keeps teams aligned with financial goals. Since the dashboard shows MTD and YTD performance, historical comparison, and trend insights, leaders stay fully prepared to manage budgets more efficiently.
With clear structure, easy navigation, and drill-through capabilities, this dashboard works as an essential tool for every finance-driven organization.
Frequently Asked Questions (FAQs)
1. What is budget adherence?
Budget adherence means staying within the planned spending limits while achieving business goals.
2. Who should use a Budget Adherence KPI Dashboard?
Finance teams, department heads, project managers, controllers, and senior leadership use it to track financial performance.
3. Do I need technical skills to use this dashboard?
No. The dashboard uses simple slicers, charts, and tables that anyone can understand easily.
4. Can I customize the KPIs?
Yes. You can add or remove KPIs by updating the KPI Definition sheet.
5. How often should I update the data?
You should ideally update the data monthly. However, weekly updates make insights more accurate.
6. Does the dashboard work with other data sources?
Yes. You can switch from Excel to SQL, SharePoint, or cloud storage anytime.
7. Why does Power BI work well for financial dashboards?
Power BI offers automation, strong visuals, faster insights, and easy data modeling, making it perfect for financial reporting.
Visit our YouTube channel to learn step-by-step video tutorials