Derivatives trading involves high risk, fast decisions, and constant performance pressure. Traders, portfolio managers, and risk teams must track results daily, monthly, and yearly to stay profitable and compliant. However, when trading data stays scattered across multiple sheets, decision-making slows down and mistakes increase. That is exactly why a Derivatives Trading KPI Dashboard in Excel becomes a powerful and practical solution.
In this detailed blog post, you will learn what a Derivatives Trading KPI Dashboard in Excel is, how it works, why trading teams need it, and how it improves performance tracking. In addition, the article explains dashboard sheets, KPI logic, trend analysis, advantages, best practices, and frequently asked questions—all in simple and clear language.
Click to Purchases Derivatives Trading KPI Dashboard in Excel
What Is a Derivatives Trading KPI Dashboard in Excel?
A Derivatives Trading KPI Dashboard in Excel is a ready-to-use performance tracking tool designed to monitor key trading KPIs in one centralized Excel file. Instead of using multiple reports and manual calculations, this dashboard converts raw trading data into clear KPIs, comparisons, trends, and visual signals.
Moreover, the dashboard is fully built in Excel, which means no Power BI, no coding, and no complex tools. Because derivatives trading depends on fast and accurate insights, this dashboard helps traders and managers track MTD and YTD performance, targets, and historical comparisons with ease.
Why Do Derivatives Trading Teams Need a KPI Dashboard?
Derivatives trading includes futures, options, swaps, and other financial contracts. Because of market volatility, traders must monitor performance continuously. However, many teams face common challenges such as:
-
Manual KPI calculations
-
Delayed performance visibility
-
Difficulty comparing targets vs actuals
-
No clear trend analysis
-
Inconsistent KPI definitions
As a result, trading decisions rely more on assumptions than data. A Derivatives Trading KPI Dashboard in Excel solves these problems by giving traders one trusted performance view.
How Does the Derivatives Trading KPI Dashboard in Excel Work?
This dashboard follows a simple and structured workflow that keeps it both powerful and easy to use.
Step 1: Input Trading Data
Users enter actual, target, and previous year trading data in dedicated input sheets.
Step 2: KPI Logic and Calculations
Excel formulas calculate MTD, YTD, target comparisons, and historical comparisons automatically.
Step 3: Interactive Dashboard Analysis
Users analyze KPIs through dropdowns, conditional formatting icons, and trend charts.
Because everything happens inside Excel, teams can start immediately.
Click to Purchases Derivatives Trading KPI Dashboard in Excel
What Are the Key Features of the Derivatives Trading KPI Dashboard in Excel?
This dashboard includes seven well-structured worksheets designed for smooth navigation and strong analysis.
How Does the Home Sheet Improve Navigation?
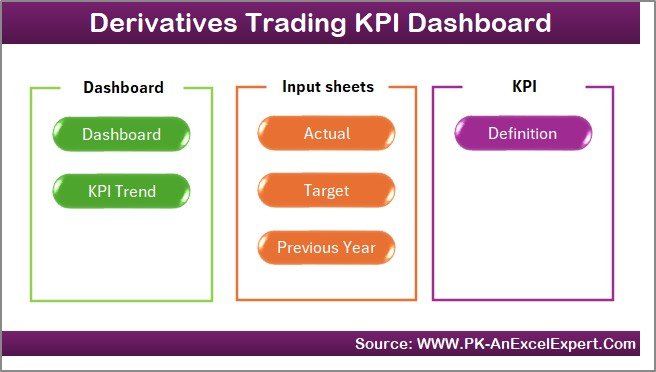
The Home Sheet works as an index page for the entire dashboard.
Key Benefits of the Home Sheet
-
Six navigation buttons
-
One-click access to major sections
-
Organized and professional structure
Instead of scrolling across sheets, users jump directly to the required page.
Why Is the Dashboard Sheet the Most Important?
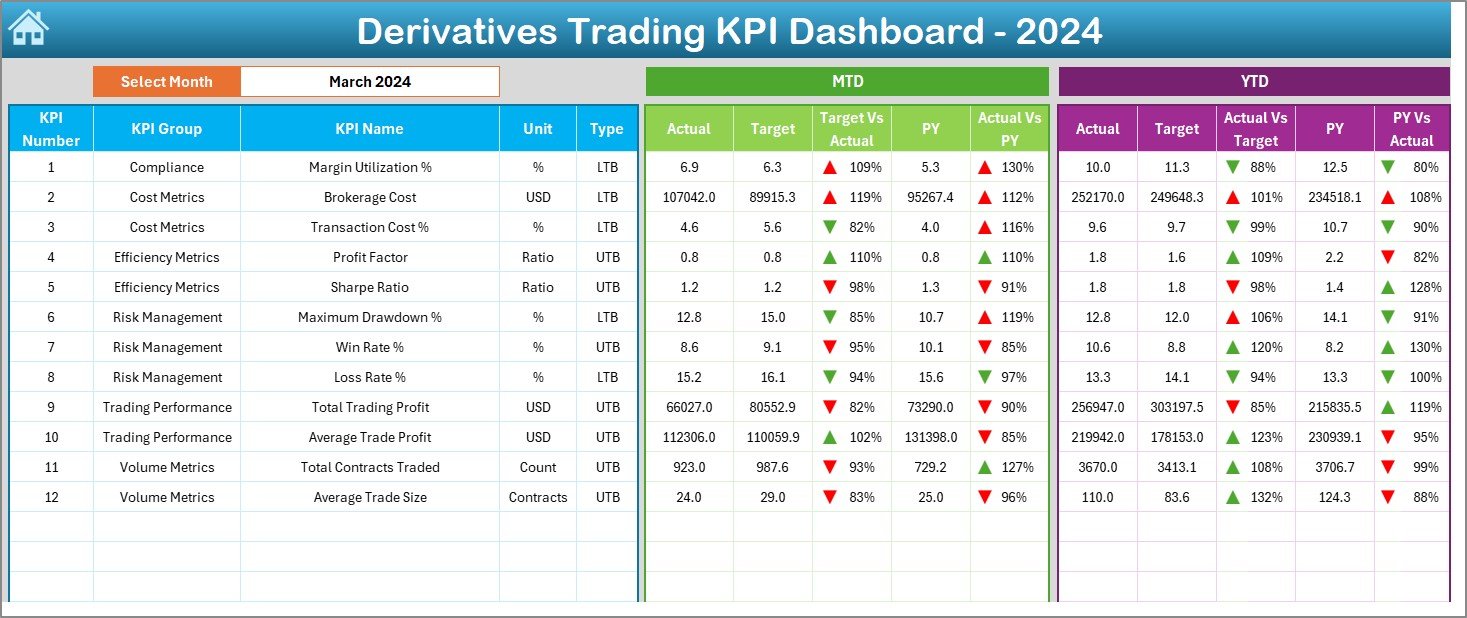
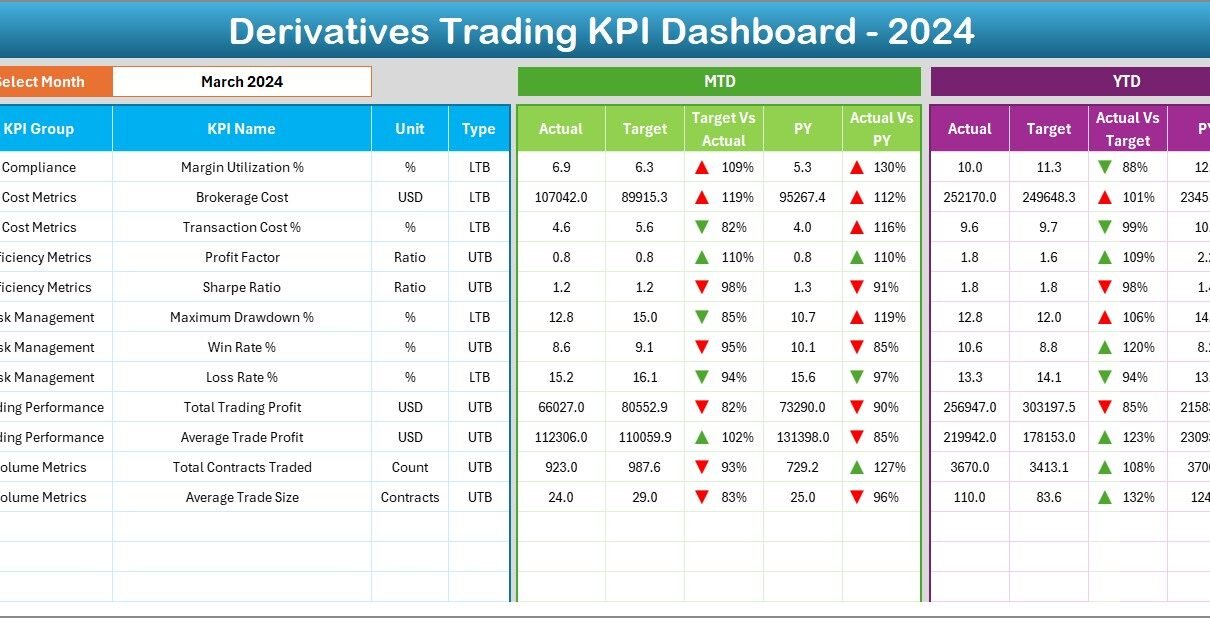
The Dashboard Sheet is the main performance overview page.
How Does Month Selection Work?
On cell D3, users select the month from a dropdown list. Once selected, the entire dashboard updates automatically for that month. As a result, traders can switch between periods instantly.
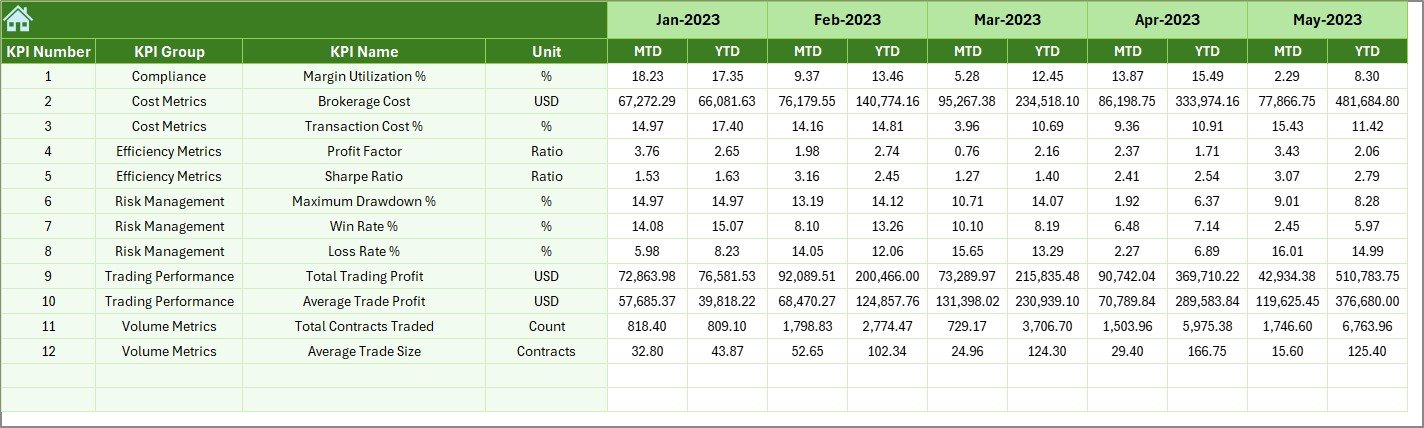
What KPIs Does the Dashboard Sheet Display?
The dashboard displays KPIs for both MTD and YTD, ensuring complete visibility.
MTD KPIs Displayed
-
MTD Actual
-
MTD Target
-
MTD Previous Year
-
Target vs Actual (MTD)
-
PY vs Actual (MTD)
Excel shows up and down arrows using conditional formatting to highlight performance status.
YTD KPIs Displayed
-
YTD Actual
-
YTD Target
-
YTD Previous Year
-
Target vs Actual (YTD)
-
PY vs Actual (YTD)
Because both MTD and YTD appear together, traders can judge short-term execution and long-term performance in one view.
How Does Conditional Formatting Help Traders?
Conditional formatting uses ▲ and ▼ arrows to communicate performance instantly.
-
Green Up Arrow (▲) – Positive performance
-
Red Down Arrow (▼) – Negative performance
Instead of reading numbers, users understand performance direction immediately.
What Is the KPI Trend Sheet and Why Is It Important?
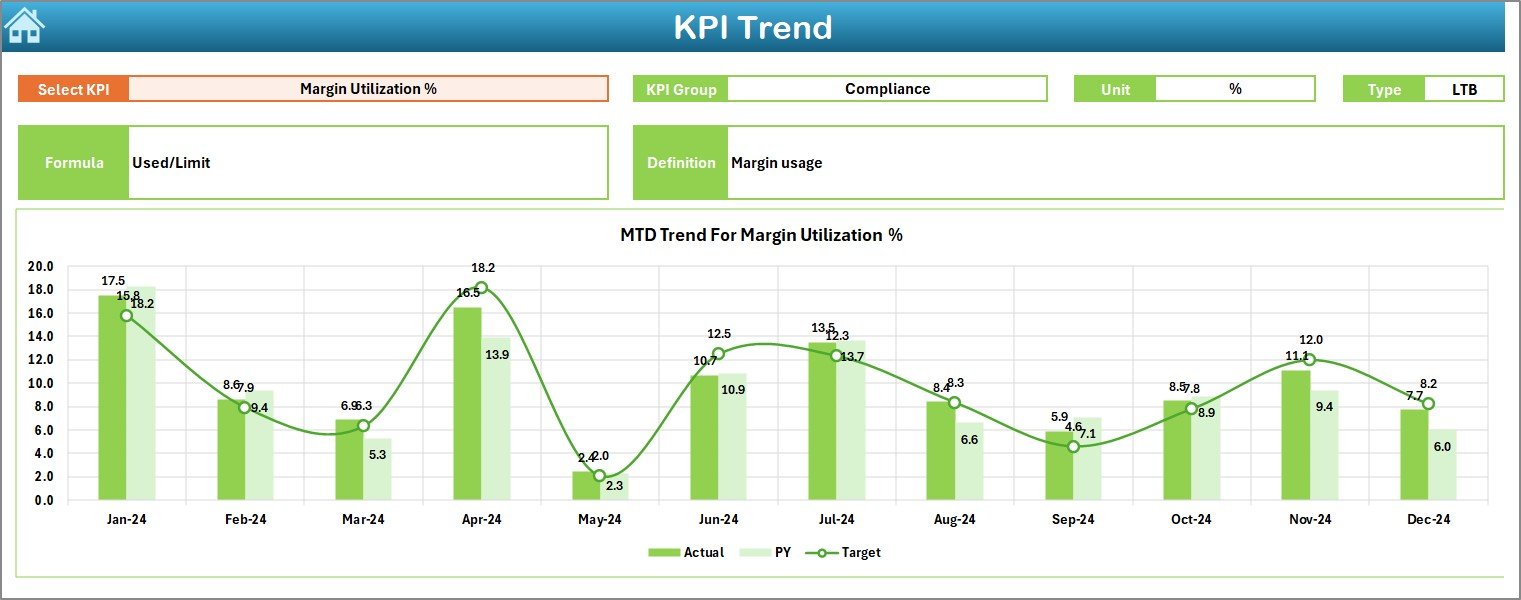
The KPI Trend Sheet focuses on trend analysis for individual KPIs.
How Do Users Select a KPI?
On cell C3, users select a KPI name from a dropdown. Once selected, the sheet updates automatically.
What KPI Details Are Shown?
The dashboard displays:
-
KPI Group
-
KPI Unit
-
KPI Type (Lower the Better / Upper the Better)
-
KPI Formula
-
KPI Definition
This section ensures clarity and avoids KPI misinterpretation.
How Do MTD and YTD Trend Charts Work?
The Trend Sheet shows:
-
MTD trend chart
-
YTD trend chart
Each chart compares:
-
Actual values
-
Target values
-
Previous year values
As a result, traders can identify patterns, seasonality, and performance shifts.
Click to Purchases Derivatives Trading KPI Dashboard in Excel
What Is the Actual Numbers Input Sheet Used For?
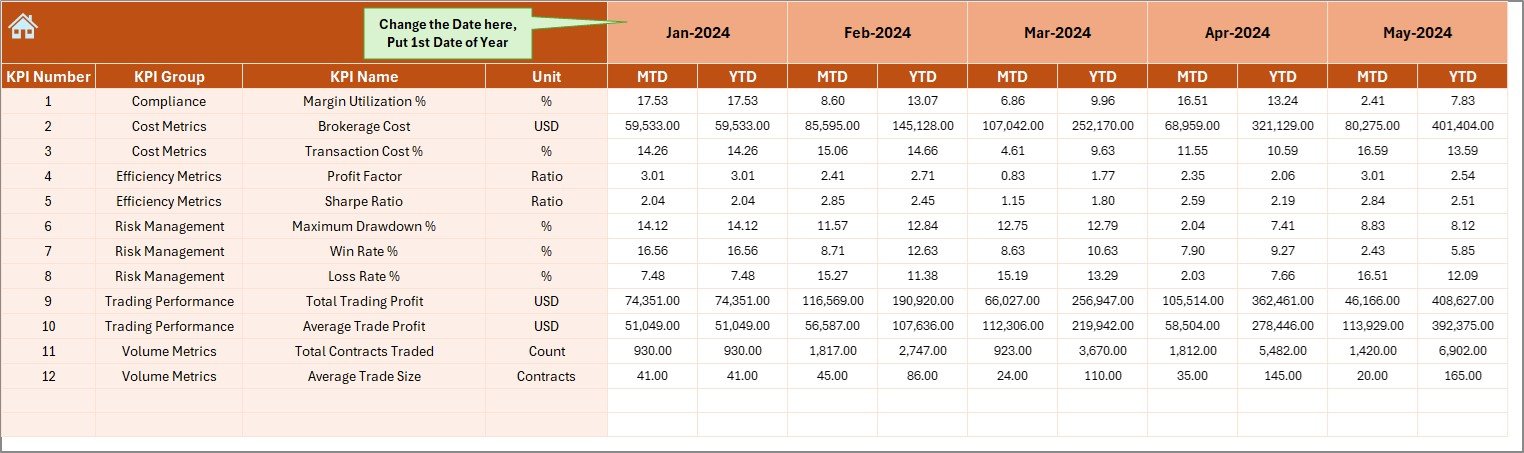
The Actual Numbers Input Sheet stores current trading performance data.
How Does Month Configuration Work?
On cell E1, users enter the first month of the year. This input drives month calculations throughout the dashboard.
Data Entered in This Sheet
-
KPI name
-
Month
-
MTD actual value
-
YTD actual value
This structure ensures consistent time-based calculations.
How Does the Target Sheet Improve Performance Tracking?

The Target Sheet stores goal values for each KPI.
Data Entered in the Target Sheet
-
KPI name
-
Month
-
MTD target value
-
YTD target value
Because targets stay separate from actuals, the dashboard compares performance objectively.
Why Is the Previous Year Number Sheet Important?
Historical benchmarking plays a key role in trading analysis. The Previous Year Number Sheet stores last year’s data in the same format as current year data.
Benefits of Previous Year Comparison
-
Measures growth or decline
-
Highlights trading consistency
-
Identifies recurring patterns
Without PY data, trend analysis remains incomplete.
What Is the Role of the KPI Definition Sheet?
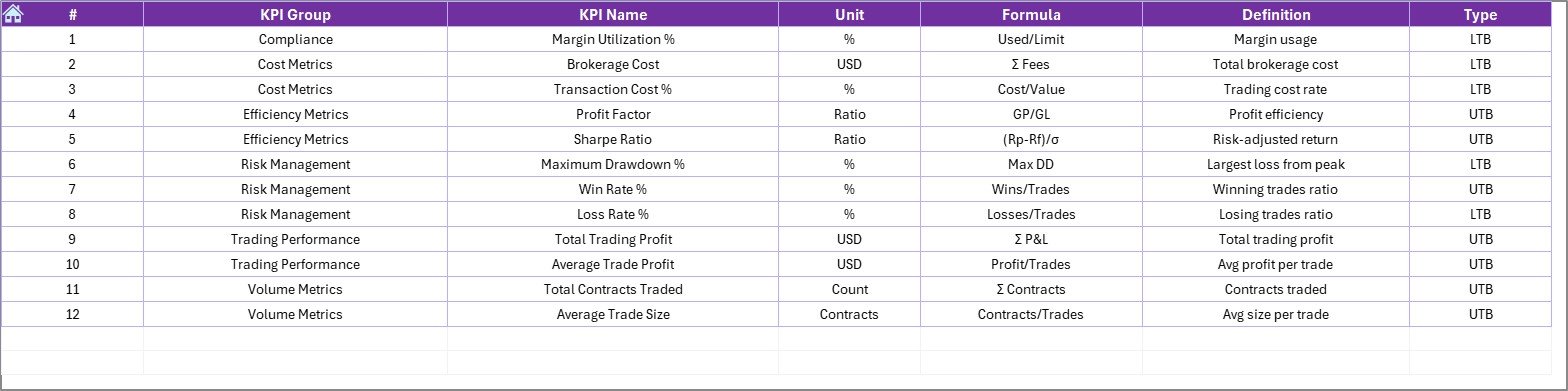
The KPI Definition Sheet serves as the foundation of the dashboard.
Fields Included in the KPI Definition Sheet
-
KPI Name
-
KPI Group
-
Unit
-
Formula
-
KPI Definition
Because all KPIs follow documented logic, reporting remains transparent and reliable.
Advantages of Derivatives Trading KPI Dashboard in Excel
A Derivatives Trading KPI Dashboard in Excel delivers several strong benefits.
✅ Centralized trading performance tracking
✅ Clear MTD and YTD visibility
✅ Target vs actual comparison
✅ Previous year benchmarking
✅ Trend-based decision-making
✅ Visual indicators for fast insights
✅ No Power BI or coding required
✅ Fully customizable Excel structure
As a result, traders spend less time reporting and more time trading.
Click to Purchases Derivatives Trading KPI Dashboard in Excel
How Does This Dashboard Improve Trading Decisions?
This dashboard improves decisions by:
-
Highlighting underperforming KPIs quickly
-
Showing performance direction clearly
-
Tracking strategy effectiveness
-
Supporting data-based risk evaluation
Instead of reacting late, traders act early.
Best Practices for the Derivatives Trading KPI Dashboard in Excel
To get the best results, teams should follow these best practices.
Keep KPI Definitions Clear
Ensure every KPI has one clear meaning.
Update Data Regularly
Refresh actual, target, and PY numbers monthly.
Avoid Too Many KPIs
Focus on meaningful KPIs only.
Review Trends Continuously
Do not rely only on end-of-month numbers.
Use Month Selector Actively
Compare different months to identify patterns.
Protect Formula Cells
Lock calculation cells to avoid errors.
Who Can Use a Derivatives Trading KPI Dashboard?
This dashboard suits:
-
Derivatives traders
-
Trading desk managers
-
Risk management teams
-
Investment analysts
-
Finance leadership
Because the structure remains flexible, teams can adapt it to equity, commodity, or currency derivatives.
Conclusion: Why Use a Derivatives Trading KPI Dashboard in Excel?
A Derivatives Trading KPI Dashboard in Excel transforms raw trading numbers into actionable insights. Instead of juggling multiple sheets, traders get one powerful dashboard that tracks performance, targets, trends, and benchmarks.
Because the dashboard runs fully in Excel, teams can deploy it quickly without additional software. When trading decisions rely on accurate data, profitability and control improve together.
Click to Purchases Derivatives Trading KPI Dashboard in Excel
Frequently Asked Questions (FAQs)
What is a Derivatives Trading KPI Dashboard in Excel?
It is an Excel-based dashboard that tracks derivatives trading KPIs with MTD, YTD, target, and trend analysis.
Does this dashboard require Power BI?
No. The entire dashboard works inside Excel.
Can users customize KPIs?
Yes. Users can add or modify KPIs through the KPI Definition sheet.
What does LTB and UTB mean?
LTB means Lower the Better. UTB means Upper the Better.
How often should trading data be updated?
Monthly updates work best for accurate MTD and YTD tracking.
Is this dashboard suitable for non-technical users?
Yes. Excel dropdowns and visuals keep it user-friendly.
Click to Purchases Derivatives Trading KPI Dashboard in Excel
Visit our YouTube channel to learn step-by-step video tutorials