Running a glass manufacturing unit demands constant monitoring, quick decisions, and complete clarity over daily operations. Production teams deal with many challenges every single day—energy usage, furnace temperature, cooling time, scrap quantity, downtime, and shift performance. If managers track these KPIs manually, they lose time and miss critical signals that affect cost and output.
A Glass Manufacturing Dashboard in Power BI solves these problems with clean visuals, instant insights, and real-time analytics. It converts raw plant data into interactive charts and KPIs that help leaders review production trends, identify performance gaps, and make better decisions.
In this article, you will learn everything about the Glass Manufacturing Dashboard in Power BI, including how it works, what each page includes, and why every plant must use it. You will also explore advantages, best practices, and answers to common questions.
Click to Purchases Glass Manufacturing Dashboard in Power BI
What Is a Glass Manufacturing Dashboard in Power BI?
A Glass Manufacturing Dashboard in Power BI is a ready-to-use reporting system that tracks production KPIs such as energy consumption, cooling time, scrap quantity, production volume, downtime, and shift performance. It pulls data from Excel or plant systems and transforms it into visuals like bar charts, line charts, KPI cards, and slicers.
Managers use this dashboard to monitor operations by plant, product type, shift, or month. Because everything updates instantly, teams save time, avoid manual reports, and act faster in critical situations.
Why Do Glass Manufacturing Companies Need a Power BI Dashboard?
Glass production is complex and sensitive. Even a small change in temperature or process timing impacts quality and cost. Therefore, teams require a real-time view of:
-
Energy usage
-
Furnace efficiency
-
Production output
-
Scrap and wastage
-
Shift performance
-
Monthly production trends
-
Machine downtime
When leaders rely on spreadsheets, they spend hours preparing reports. Power BI eliminates that workload and gives them instant clarity. As a result, teams work smarter, improve productivity, and reduce losses.
Key Features of the Glass Manufacturing Dashboard in Power BI
The Glass Manufacturing Dashboard includes five powerful pages. Each page focuses on one major part of the manufacturing workflow. Together, they give a complete picture of plant operations.
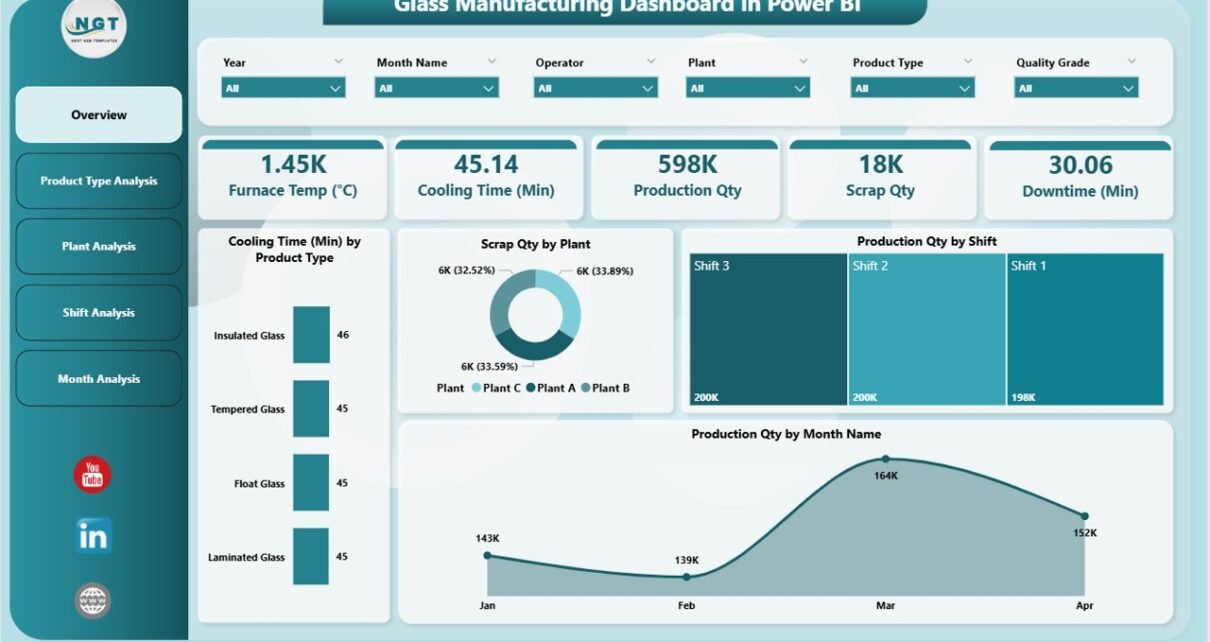
1. Overview Page – The Complete Production Snapshot
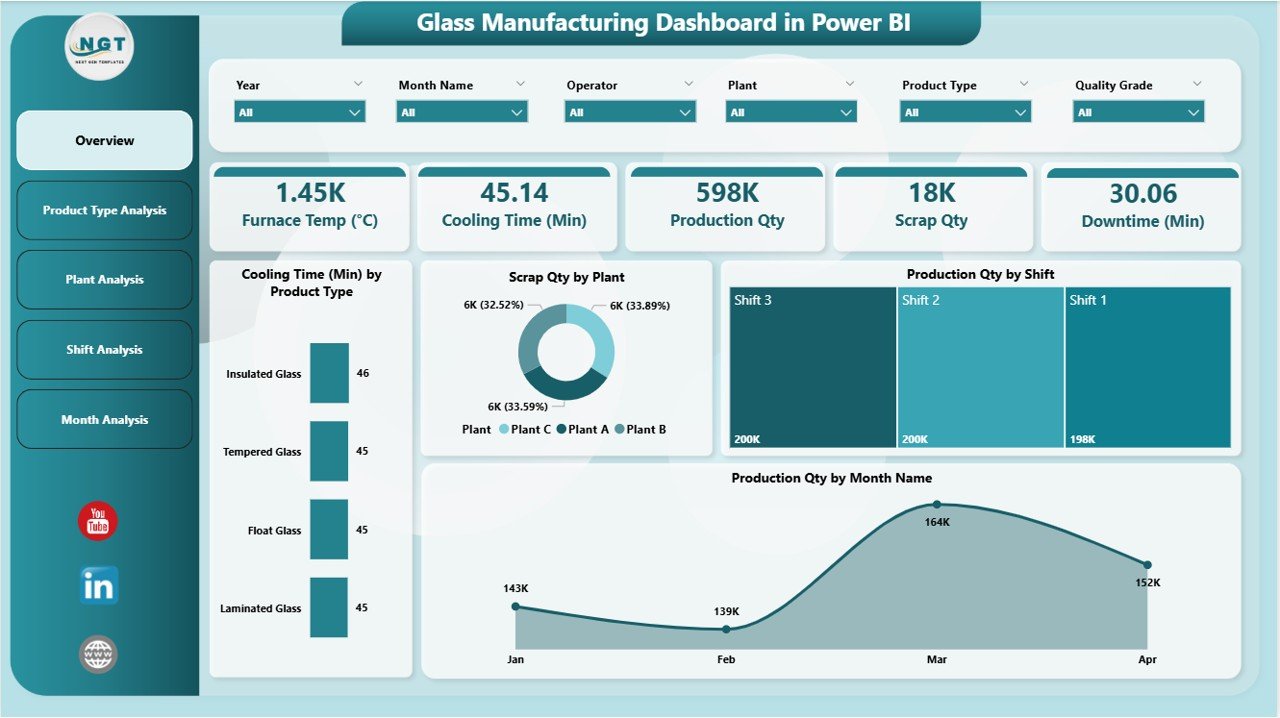
The Overview Page works as the main control panel of the dashboard. You can select filters using slicers and instantly refresh the entire page. This view is extremely useful when managers want a quick summary of daily or monthly performance.
Key Elements on the Overview Page
-
KPI Cards
These cards highlight critical metrics such as total production, total scrap, cooling time, and energy usage. Because the numbers update every time you select a slicer value, decision-making becomes faster. -
Cooling Time by Product Type
This chart shows how long different product types take to cool. It helps you compare efficiency and find products that require more time. -
Scrap Quantity by Plant
Scrap impacts cost. Therefore, this chart helps leaders track wastage in each plant and find where improvement is needed. -
Production Quantity by Shift
This view helps identify which shift performs best. Managers can compare Shift A, B, and C and find productivity gaps. -
Production Quantity by Month
This chart highlights long-term trends and allows you to track both growth and seasonal changes.
Because this page gives a complete overview, teams use it during meetings, reviews, and performance audits.
Click to Purchases Glass Manufacturing Dashboard in Power BI
2. Product Type Analysis – How Each Product Performs
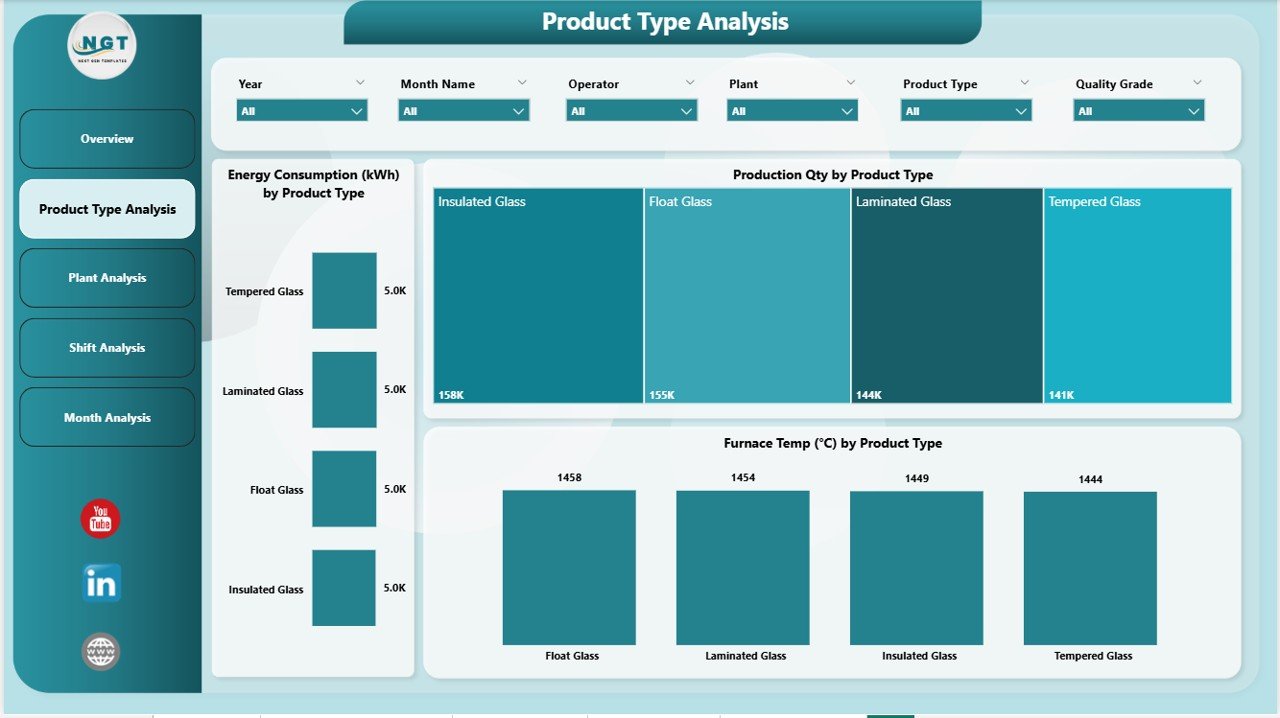
The Product Type Analysis Page helps managers compare performance across multiple product types. Since every product requires different energy levels, furnace timing, and cooling duration, this page acts as a detailed performance analyzer.
Charts on This Page
-
Energy Consumption by Product Type
Glass manufacturing consumes significant energy. This chart helps you compare where energy usage is high and where it stays within limits. -
Production Quantity by Product Type
This chart highlights which product types produce the highest output. It also helps in forecasting demand and adjusting production schedules. -
Cooling Time by Product Type
Cooling is one of the longest steps in glass manufacturing. This visualization helps identify products that consume extra time.
Because all charts refresh when you use slicers, you gain deeper insights without scrolling through spreadsheets.
3. Plant Analysis – Which Plant Performs Best?
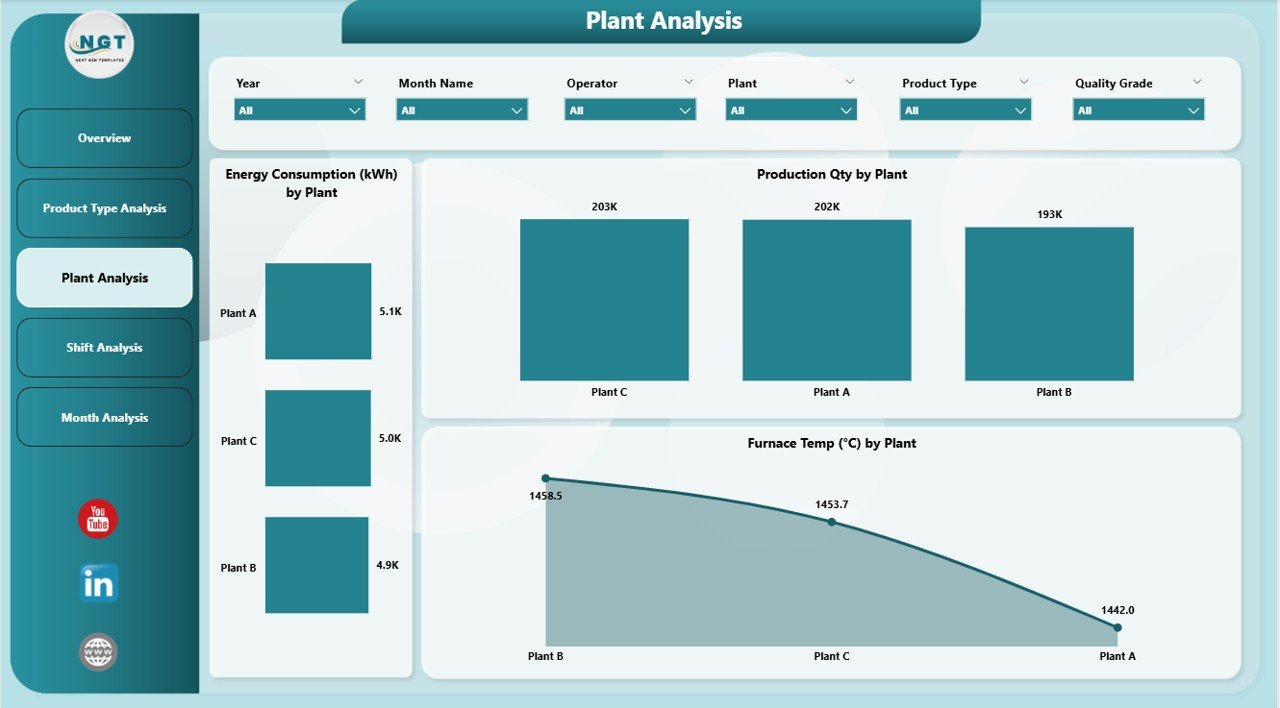
The Plant Analysis Page gives you clarity on production performance across all plant locations. Many glass companies operate multiple plants, and each plant shows different results based on team skills, machine age, and process efficiency.
Charts Included on This Page
-
Energy Consumption by Plant
This helps managers compare energy efficiency across locations and reduce unnecessary costs. -
Production Quantity by Plant
Plants differ in capacity. This chart highlights which plant gives the highest and most consistent output. -
Furnace Team by Plant
The furnace plays a critical role in shaping glass. This chart helps you track furnace performance and team efficiency for each plant.
When leaders have this page, they understand the strengths and weaknesses of every location. As a result, they plan maintenance, training, and resource allocation more effectively.
Click to Purchases Glass Manufacturing Dashboard in Power BI
4. Shift Analysis – A Deep Look at Daily Work Cycles
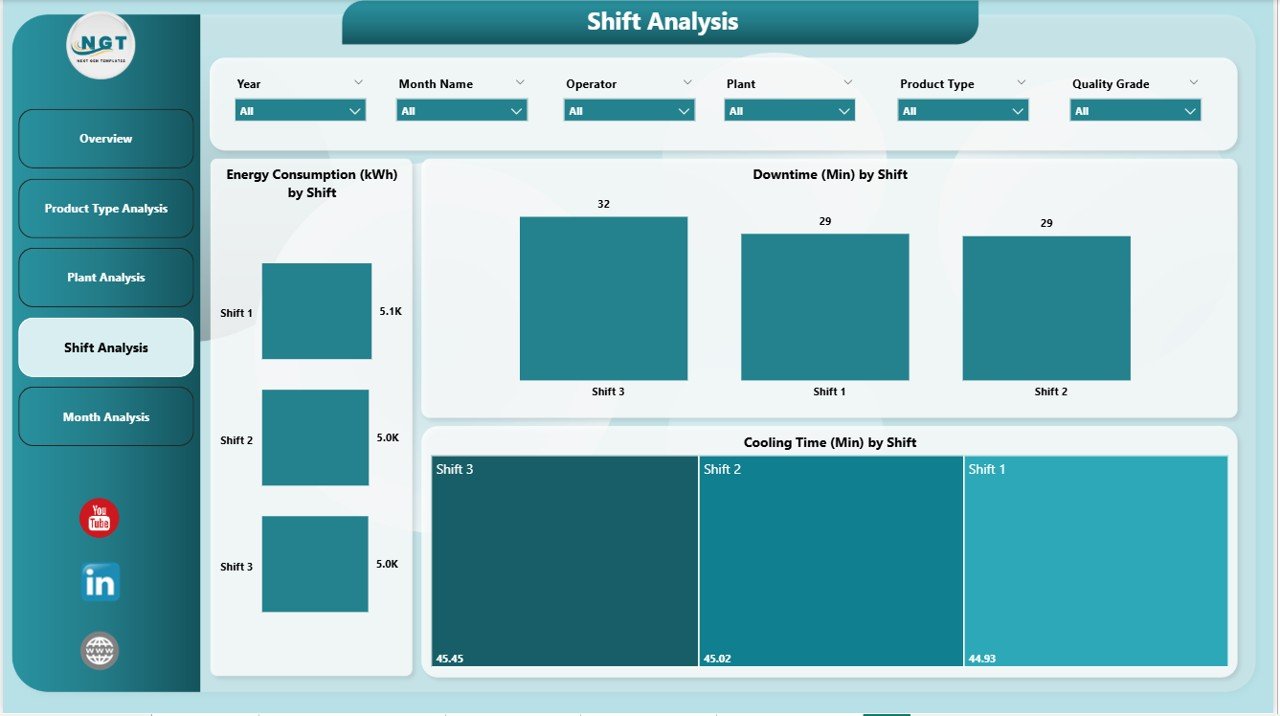
Most glass factories run 24×7 with multiple shifts. Therefore, shift performance plays a major role in overall output.
The Shift Analysis Page focuses on shift-wise operations and gives clarity on energy usage, downtime, and cooling efficiency.
Charts in Shift Analysis Page
-
Energy Consumption by Shift
This chart helps leaders understand which shift uses more energy and why. This reduces operational waste. -
Downtime by Shift
Downtime affects productivity. Therefore, this chart helps teams identify which shift faces more breakdowns or slowdowns. -
Cooling Time by Shift
This helps compare cooling efficiency between shifts. It also guides team training and operational improvements.
Because this page shows shift-level details, leaders use it for workforce planning and performance improvement.
5. Monthly Trends – Long-Term Production and Quality Tracking
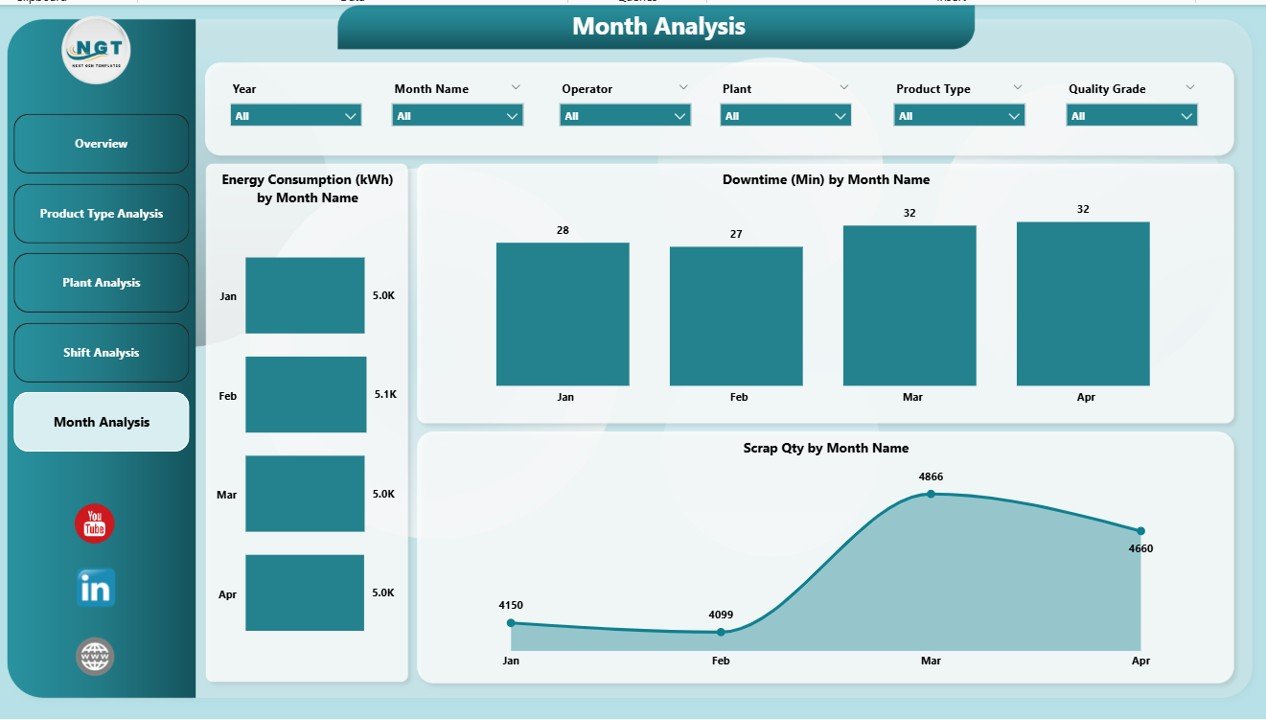
The Monthly Trends Page provides a complete historical view of production, energy usage, downtime, and scrap. This page is extremely helpful for forecasting and target planning.
Charts Included
-
Energy Consumption by Month
This shows how energy usage changes across months. Managers use this insight to plan budgets and optimize processes. -
Downtime by Month
This chart helps identify months with more breakdowns. Therefore, it supports preventive maintenance planning. -
Scrap Quantity by Month
Scrap reduction saves money. This chart helps teams track progress and find improvement opportunities.
This page helps leaders make long-term decisions backed by strong evidence.
Advantages of a Glass Manufacturing Dashboard in Power BI
A good dashboard creates visibility, saves time, and improves performance. Here are the major benefits:
1. Faster and More Accurate Decisions
Managers view all KPIs on one screen. As a result, they react quickly to problems like high scrap, excess downtime, or low production.
2. Real-Time Insights
Power BI updates instantly. Therefore, teams work with the latest data rather than old spreadsheets.
3. Reduced Manual Reporting
Teams save hours of manual work because Power BI automates all calculations and charts.
4. Improved Energy and Cost Management
Energy is one of the highest expenses in glass manufacturing. This dashboard highlights inefficiencies and gives clarity on cost-saving opportunities.
5. Better Control Over Production Quality
Monitoring cooling time, furnace performance, and scrap quantity helps maintain product quality.
6. Enhanced Plant and Shift Comparisons
Leaders compare plants, product types, and shifts easily. This creates healthy competition and improves overall performance.
7. Clear Monthly and Yearly Trends
Trend charts help in forecasting, planning, and budgeting.
Click to Purchases Glass Manufacturing Dashboard in Power BI
Best Practices for Using the Glass Manufacturing Dashboard in Power BI
To get the best value from the dashboard, follow these practices:
1. Update the Data Regularly
Fresh data gives accurate results. Therefore, ensure daily or weekly updates.
2. Validate Data Before Upload
Accurate data ensures reliable insights. Clean your dataset before refreshing the dashboard.
3. Use Slicers for Deep Analysis
Slicers help you compare performance by product type, shift, and plant. Use them to find hidden patterns.
4. Train Your Team
Every user must understand how to read charts and interpret results. Training improves adoption.
5. Monitor High-Impact KPIs
High scrap, high downtime, and high energy usage need immediate attention. Track them closely.
6. Use Trend Pages for Planning
Use the Monthly Trends page to forecast production needs and resource planning.
7. Review Shift Performance Weekly
Shift-level analysis helps identify operational bottlenecks.
Conclusion
A Glass Manufacturing Dashboard in Power BI gives complete visibility into production, energy usage, downtime, scrap, and shift performance. Because it updates instantly, leaders get accurate insights without manual reporting. The dashboard helps improve efficiency, reduce cost, and strengthen decision-making across all plants.
When teams follow best practices, they gain a powerful tool that supports continuous improvement and long-term success.
Frequently Asked Questions (FAQs)
1. What data is required for a Glass Manufacturing Dashboard in Power BI?
You need production volume, scrap numbers, downtime data, energy consumption, shift details, and product types.
2. Can beginners use this dashboard easily?
Yes. The charts and KPIs are simple. Anyone can understand them after a short training.
3. Does the dashboard support multiple plants?
Yes. The Plant Analysis page helps compare performance across all locations.
4. How often should I update the data?
Updating daily or weekly gives the best results.
5. Can I customize the dashboard?
Yes. Power BI allows full customization based on your KPIs and business needs.
Visit our YouTube channel to learn step-by-step video tutorials