Managing loan recovery operations requires precision, transparency, and continuous performance tracking. However, when recovery data remains scattered across spreadsheets and manual reports, teams struggle to identify bottlenecks, measure effectiveness, and improve collection outcomes. Therefore, loan recovery organizations increasingly depend on KPI dashboards to gain real-time insights and improve decision-making.
That is exactly where the Loan Recovery Services KPI Dashboard in Power BI becomes a powerful and practical solution.
In this in-depth article, you will learn what a Loan Recovery Services KPI Dashboard in Power BI is, why it is important, how it works, its page-wise structure, key features, advantages, opportunities for improvement, best practices, and frequently asked questions. Moreover, the article uses clear language, active voice, and practical explanations, which makes it easy to understand for both technical and non-technical users.
Click to Purchases Loan Recovery Services KPI Dashboard in Power BI
What Is a Loan Recovery Services KPI Dashboard in Power BI?
A Loan Recovery Services KPI Dashboard in Power BI is a ready-to-use analytical reporting tool that helps banks, NBFCs, financial institutions, and recovery agencies track and monitor their loan recovery performance using key performance indicators (KPIs).
Instead of manually reviewing Excel sheets or static reports, this dashboard converts structured recovery data into interactive cards, tables, charts, and slicers. As a result, management teams can quickly understand recovery trends, target achievement, and year-over-year performance.
Moreover, the dashboard uses Excel as the data source and Power BI as the visualization platform, which ensures flexibility, scalability, and ease of maintenance.
Why Do Loan Recovery Teams Need a KPI Dashboard?
Loan recovery operations involve multiple moving parts such as delinquent accounts, collection targets, recovery rates, and historical comparisons. Therefore, without a centralized view, teams often lose visibility and control.
A Loan Recovery Services KPI Dashboard in Power BI helps because:
-
It provides clear visibility into recovery performance
-
It compares actual recovery vs recovery targets
-
It tracks MTD and YTD performance
-
It highlights underperforming KPIs using visual indicators
-
It supports data-driven corrective actions
As a result, recovery teams improve efficiency, accountability, and overall recovery outcomes.
Click to Purchases Loan Recovery Services KPI Dashboard in Power BI
What KPIs Can Be Tracked Using This Dashboard?
The dashboard supports a wide range of recovery-related KPIs. Because the KPI structure is flexible, organizations can define KPIs based on their recovery strategy.
Common KPI groups include:
-
Recovery Efficiency KPIs
-
Collection Performance KPIs
-
Portfolio Recovery KPIs
-
Legal & Enforcement KPIs
-
Operational Productivity KPIs
-
Financial Recovery KPIs
Since KPI definitions are managed in a dedicated sheet, teams can easily update or expand KPIs without changing the dashboard design.
Key Features of the Loan Recovery Services KPI Dashboard in Power BI
This dashboard is designed to deliver meaningful insights with a clean and professional layout. Below are its key features explained in detail.
How Many Pages Are Included in the Dashboard?
The Loan Recovery Services KPI Dashboard in Power BI includes three structured pages within the Power BI Desktop file. Each page focuses on a specific aspect of performance analysis.
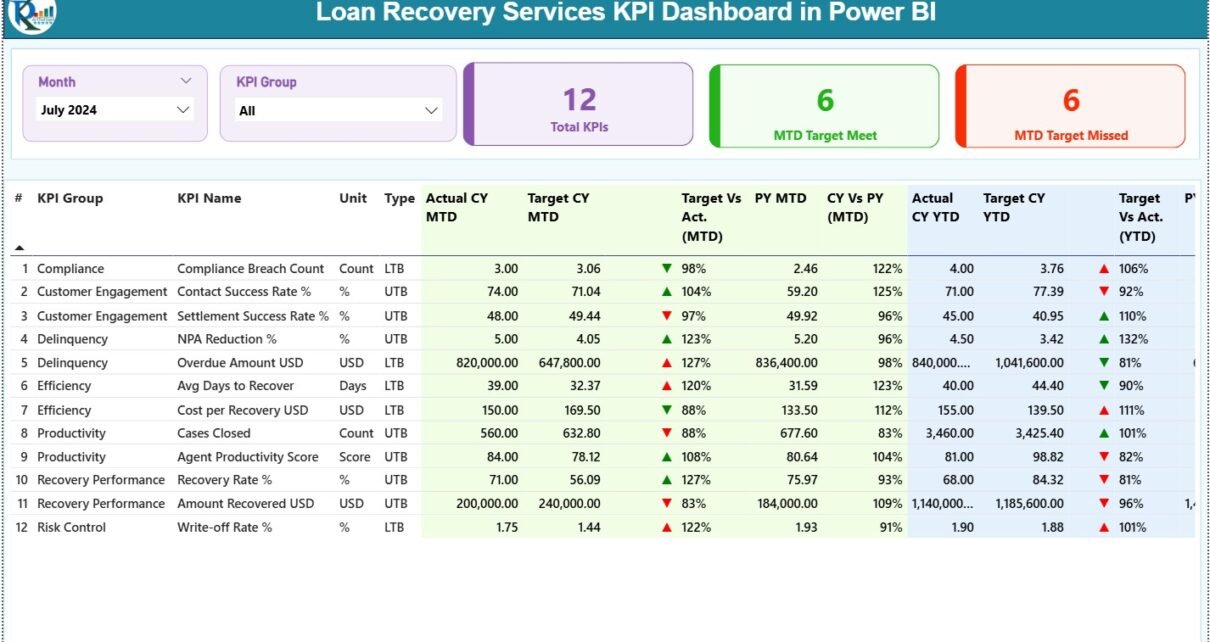
What Is Covered in the Summary Page?
The Summary Page acts as the central performance overview for loan recovery operations.
Key Components of the Summary Page
Top Slicers
-
📅 Month Slicer – Analyze recovery performance for a selected month
-
📊 KPI Group Slicer – Filter KPIs by recovery category
KPI Cards
-
🔢 Total KPIs Count
-
✅ MTD Target Met Count
-
❌ MTD Target Missed Count
These cards immediately show how many recovery KPIs meet expectations and how many require attention.
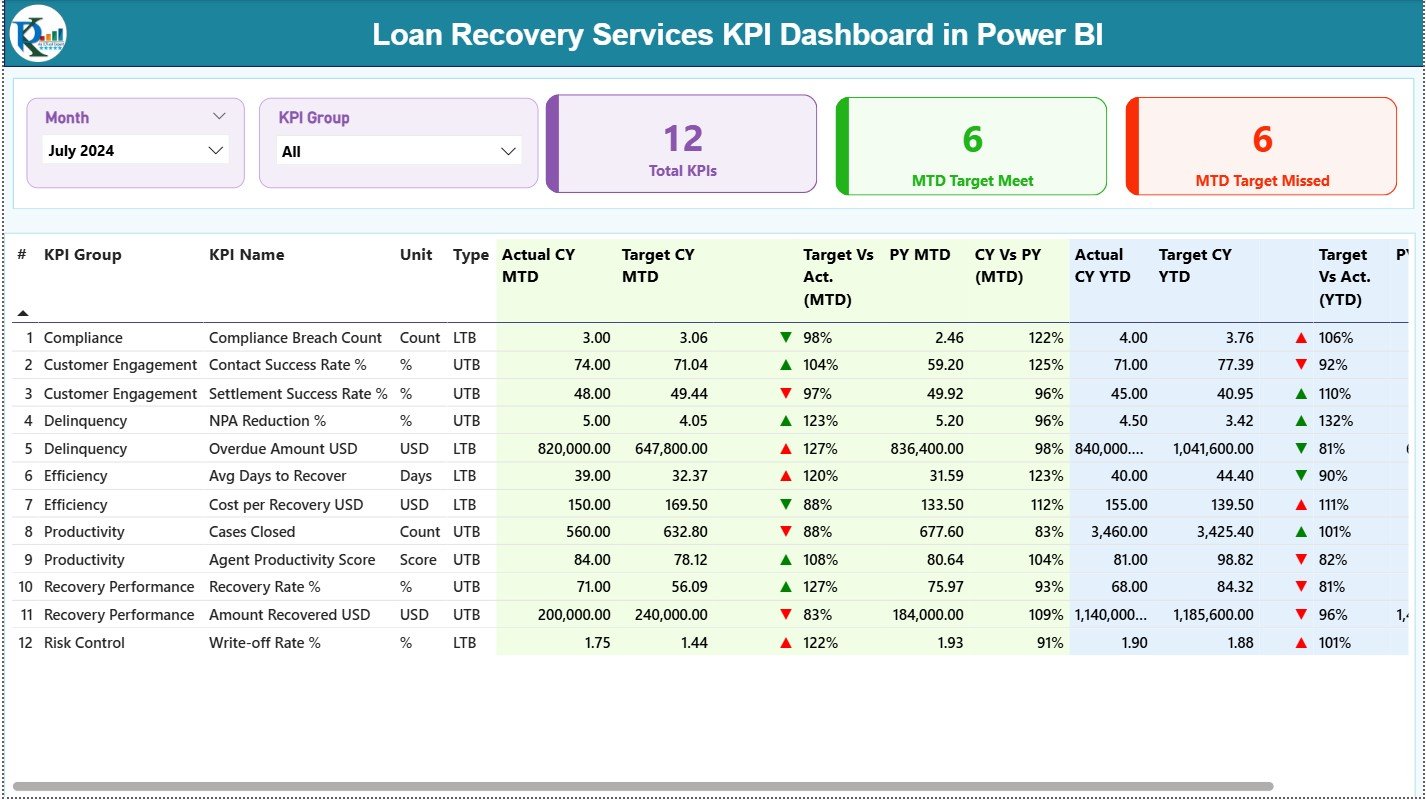
Detailed KPI Performance Table
Below the KPI cards, the dashboard displays a comprehensive KPI table with the following columns:
-
KPI Number – Sequential identifier for each KPI
-
KPI Group – Category of the KPI
-
KPI Name – Name of the recovery KPI
-
Unit – Measurement unit (%, Amount, Days, Count, etc.)
-
Type – LTB (Lower the Better) or UTB (Upper the Better)
Month-to-Date (MTD) Metrics
-
Actual CY MTD – Current Year actual MTD value
-
Target CY MTD – Current Year target MTD value
-
MTD Icon – ▲ or ▼ icon in green or red indicating performance
MTD Comparisons
-
Target vs Actual (MTD) – Actual ÷ Target
-
PY MTD – Previous Year MTD value
-
CY vs PY (MTD) – CY MTD ÷ PY MTD
Year-to-Date (YTD) Metrics
-
Actual CY YTD – Current Year actual YTD value
-
Target CY YTD – Current Year target YTD value
-
YTD Icon – Performance indicator for YTD
YTD Comparisons
-
Target vs Actual (YTD)
-
PY YTD
-
CY vs PY (YTD)
Because of this structure, users can analyze recovery performance across time, targets, and historical benchmarks in one single view.
Click to Purchases Loan Recovery Services KPI Dashboard in Power BI
How Does the KPI Trend Page Support Recovery Analysis?
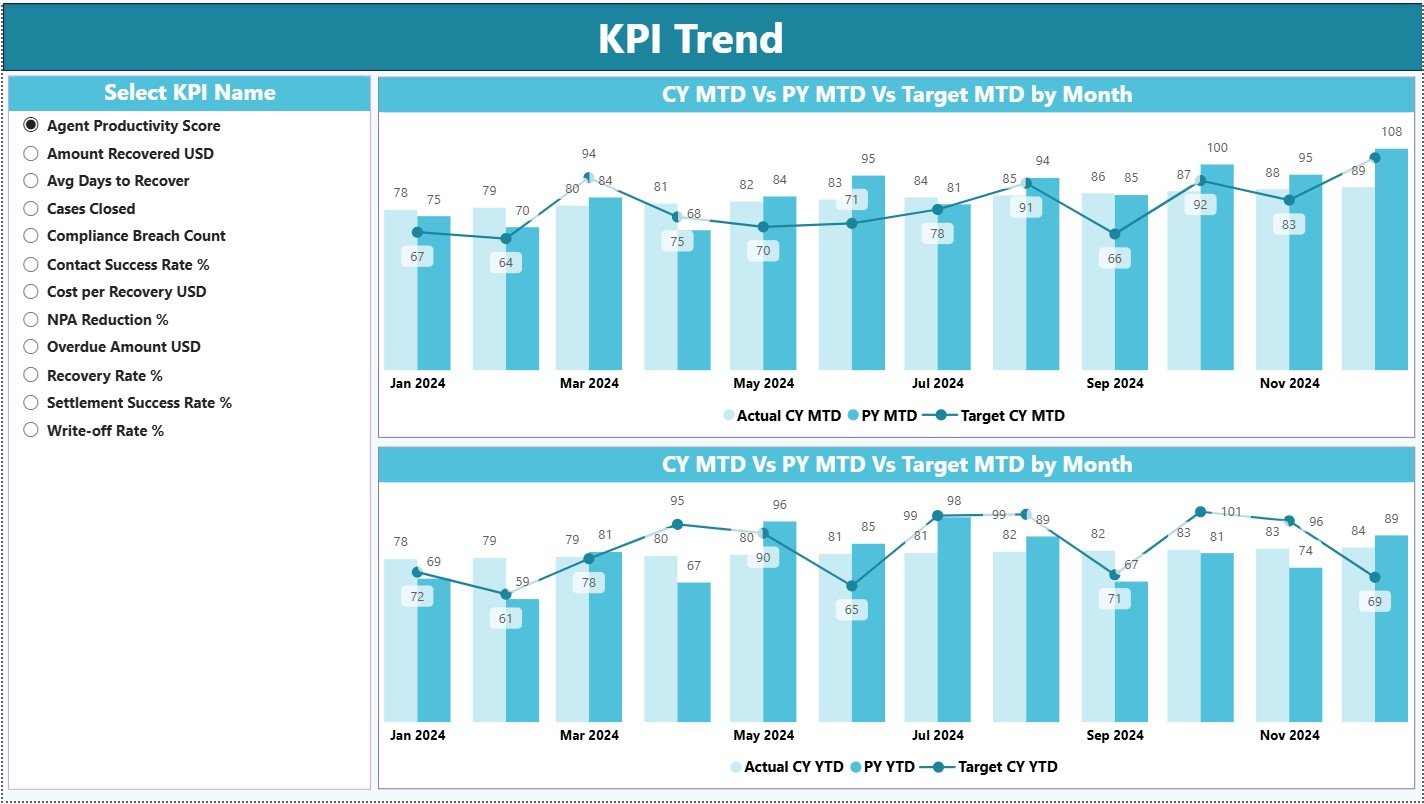
The KPI Trend Page focuses on performance trends over time, which is critical for recovery planning.
Key Features of the KPI Trend Page
-
📈 MTD Combo Chart – Displays Actual CY, PY, and Target values
-
📉 YTD Combo Chart – Displays Actual CY, PY, and Target values
-
🎯 KPI Name Slicer – Select a specific KPI to analyze
These charts help users understand whether recovery performance improves, declines, or remains consistent across months. As a result, management teams can identify early warning signs and adjust strategies.
What Is the Role of the KPI Definition Page?
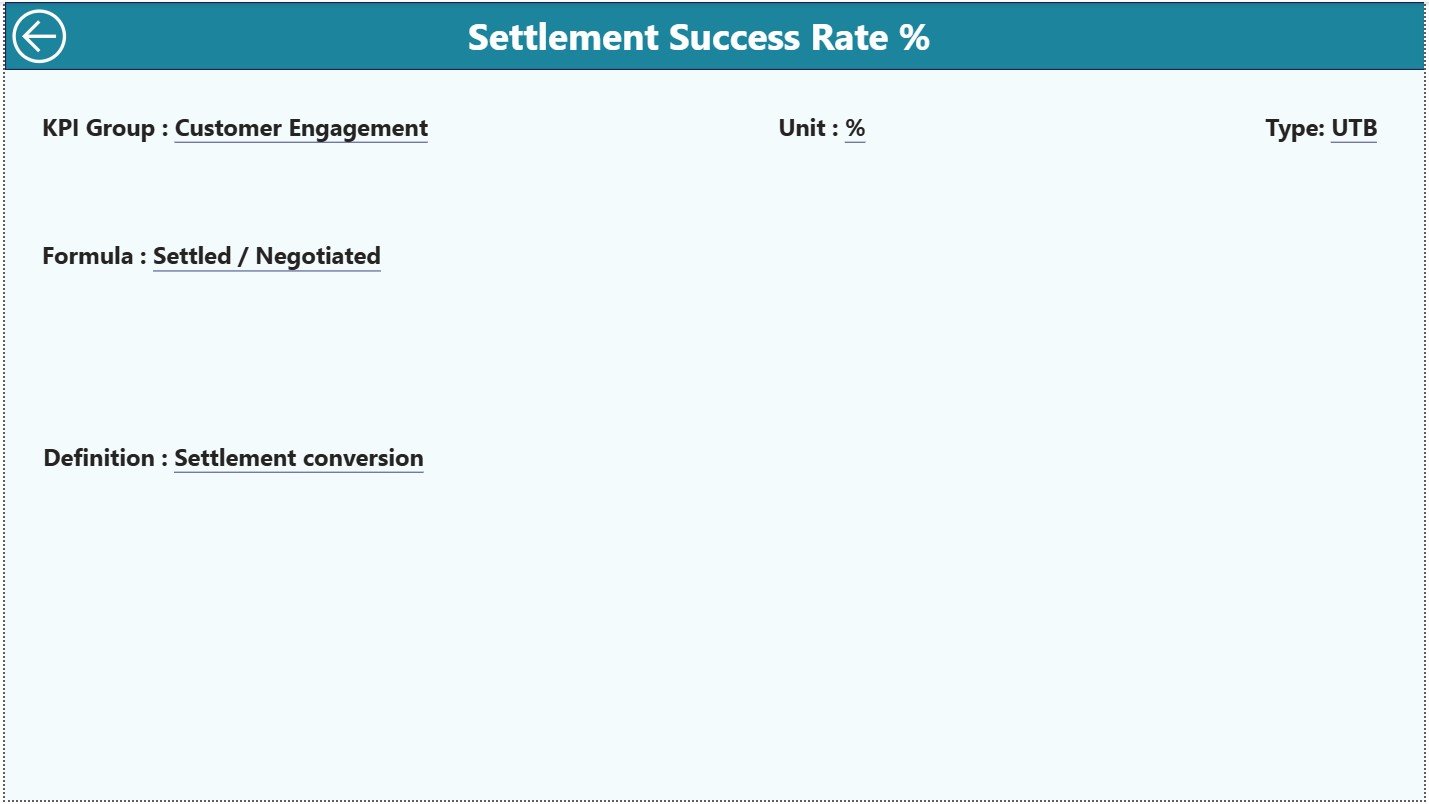
The KPI Definition Page acts as a drill-through reference page and remains hidden by default.
Information Available on This Page
-
KPI Formula
-
KPI Definition
-
KPI Unit
-
KPI Type (LTB or UTB)
Users can drill through from the Summary Page to understand how each KPI is calculated. Additionally, a Back button allows quick navigation to the main dashboard page.
What Excel Data Is Used in This Dashboard?
The Loan Recovery Services KPI Dashboard in Power BI uses an Excel file as its data source, which simplifies data entry and maintenance.
Input_Actual Sheet – What Should Be Entered?
In the Input_Actual worksheet, users enter:
-
KPI Name
-
Month (use the first date of the month)
-
MTD Actual Value
-
YTD Actual Value
This sheet captures the actual recovery performance data.
Input_Target Sheet – What Does It Contain?
In the Input_Target worksheet, users enter:
-
KPI Name
-
Month (use the first date of the month)
-
MTD Target Value
-
YTD Target Value
This sheet defines recovery performance targets.
KPI Definition Sheet – Why Is It Critical?
The KPI Definition worksheet contains:
-
KPI Number
-
KPI Group
-
KPI Name
-
Unit
-
Formula
-
Definition
-
Type (LTB or UTB)
This sheet controls KPI logic, categorization, and interpretation. Therefore, it acts as the backbone of the dashboard.
Click to Purchases Loan Recovery Services KPI Dashboard in Power BI
How Does This Dashboard Improve Loan Recovery Performance?
This dashboard improves loan recovery operations because it:
-
Centralizes all recovery KPIs
-
Highlights underperforming recovery areas instantly
-
Enables month-over-month and year-over-year comparisons
-
Improves management review meetings
-
Strengthens accountability across recovery teams
As a result, organizations achieve higher recovery rates and better portfolio control.
Advantages of the Loan Recovery Services KPI Dashboard in Power BI
Below are the key advantages explained clearly:
📊 Centralized Recovery Reporting – All KPIs in one place
⏱️ Faster Decision-Making – No manual analysis required
🎯 Clear Target Tracking – Targets vs actuals become visible
📈 Trend Visibility – MTD and YTD trends support planning
🔄 Easy Updates – Update Excel and refresh Power BI
👥 User-Friendly Interface – Easy for managers and analysts
Opportunities for Improvement in the Dashboard
Although the dashboard is robust, further enhancements can add more value.
➕ Add account-level drill-down views
➕ Include aging bucket analysis
➕ Add regional or agent-wise performance
➕ Integrate legal recovery metrics
➕ Connect live databases for automation
These improvements can transform the dashboard into a more advanced recovery analytics solution.
Click to Purchases Loan Recovery Services KPI Dashboard in Power BI
Best Practices for the Loan Recovery Services KPI Dashboard in Power BI
To maximize value, follow these best practices:
✅ Standardize KPI definitions across teams
✅ Update Excel data regularly and consistently
✅ Focus on actionable recovery KPIs
✅ Avoid overcrowding the dashboard
✅ Review trends, not just monthly values
✅ Train users to interpret KPIs correctly
By following these practices, organizations ensure consistent and reliable performance tracking.
Who Can Use This Dashboard?
This dashboard benefits multiple roles, such as:
-
Loan Recovery Managers
-
Collection Team Leaders
-
Risk & Compliance Teams
-
Finance Departments
-
Senior Management
-
Business Analysts
Because of its flexible design, both small recovery agencies and large financial institutions can use it effectively.
Why Choose Power BI for Loan Recovery Reporting?
Power BI offers several advantages over traditional Excel reporting:
-
Interactive visuals instead of static charts
-
Drill-through and slicer-based analysis
-
Better storytelling with data
-
Professional presentation for management
Therefore, Power BI becomes an ideal reporting platform for loan recovery operations.
Conclusion
The Loan Recovery Services KPI Dashboard in Power BI provides a structured, interactive, and data-driven approach to managing loan recovery performance. By combining Excel-based data input with Power BI visualization, this dashboard transforms raw recovery data into actionable insights.
Moreover, its clear layout, detailed KPI comparisons, trend analysis, and drill-through functionality make it an essential tool for modern recovery teams. When used with best practices, this dashboard significantly improves recovery efficiency and decision-making.
Frequently Asked Questions (FAQs)
What is a Loan Recovery Services KPI Dashboard in Power BI?
It is an interactive dashboard that tracks loan recovery KPIs using Excel data and Power BI visuals.
Can I customize KPIs in this dashboard?
Yes, you can add or modify KPIs using the KPI Definition sheet.
Do I need advanced Power BI skills to use this dashboard?
No, basic Power BI and Excel knowledge is sufficient.
How often should recovery data be updated?
You should update data monthly or as per recovery reporting cycles.
Can this dashboard be used by small recovery agencies?
Yes, it works for both small agencies and large financial institutions.
Does the dashboard support MTD and YTD analysis?
Yes, it includes detailed MTD and YTD performance metrics.
Can the dashboard connect to live systems?
Yes, you can replace Excel with live database connections if required.
Click to Purchases Loan Recovery Services KPI Dashboard in Power BI
Visit our YouTube channel to learn step-by-step video tutorials