Managing aerospace and defence operations involves complex programs, high budgets, strict timelines, and zero tolerance for errors. However, many teams still depend on scattered Excel files and manual reports. As a result, decision-making becomes slow and risky.
Therefore, the Aerospace and Defence Dashboard in Excel solves this problem by converting raw data into clear, actionable insights. Moreover, this ready-to-use dashboard helps leaders track financials, operations, risks, and performance from a single place.
Click to buy Aerospace and Defence Dashboard in Excel
What Is the Aerospace and Defence Dashboard in Excel?
The Aerospace and Defence Dashboard in Excel is a professionally designed, ready-to-use analytical template. It presents key aerospace and defence metrics through interactive charts, KPIs, and visual summaries.
Additionally, the dashboard includes multiple sheet tabs, each focused on a specific business area such as finance, programs, regions, and monthly trends. As a result, stakeholders gain faster visibility and stronger control.
Why Is This Dashboard Important for Aerospace and Defence Organizations?
Aerospace and defence projects involve long lifecycles and large investments. Therefore, teams must monitor cost overruns, schedule delays, and operational readiness continuously.
This dashboard helps because:
- It centralizes critical data in one Excel file
- It improves transparency across departments
- It supports data-driven decisions without complex tools
Consequently, leaders can act faster and reduce operational risks.
What Sheets Are Included in the Aerospace and Defence Dashboard in Excel?
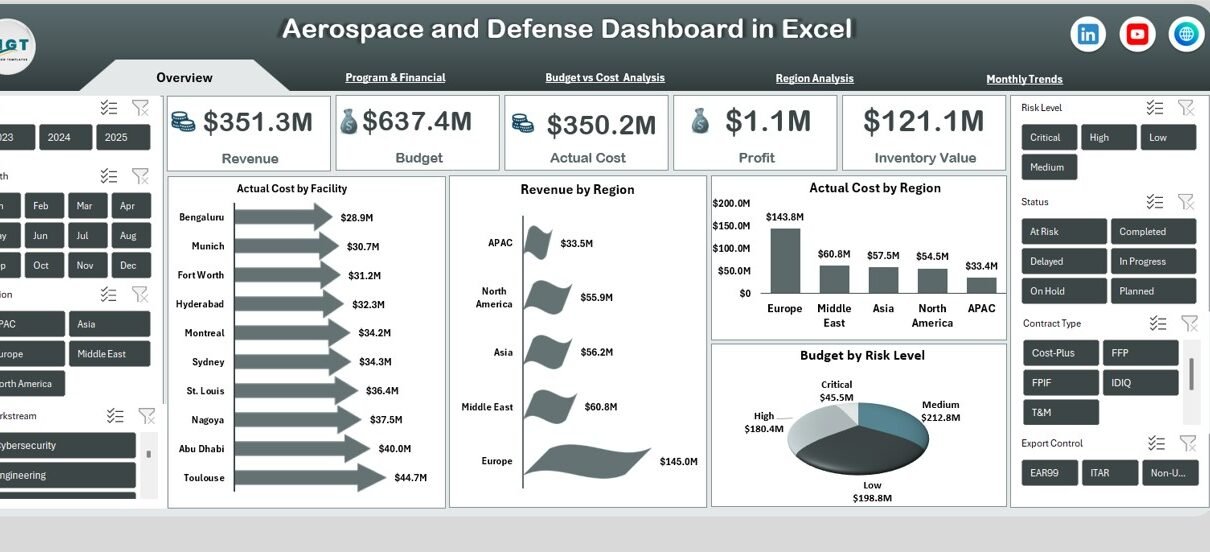
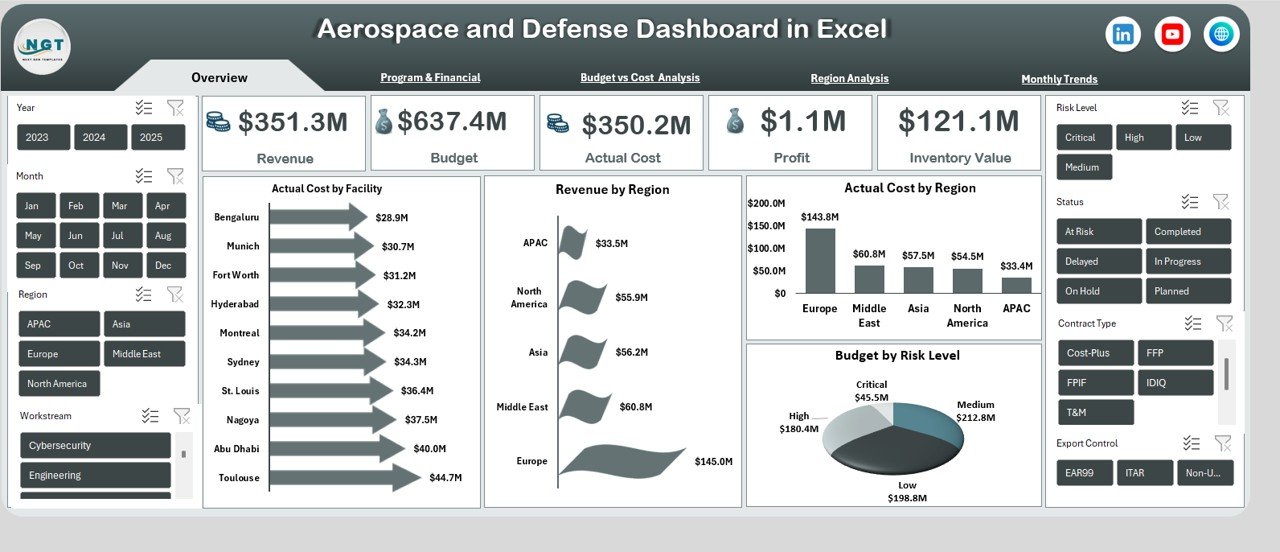
Overview Sheet: How Do You Track High-Level Performance?
The Overview sheet provides an instant snapshot of business health.
Key KPI Cards:
- Revenue
- Budget
- Actual Cost
- Profit
- Inventory Value
Visual Insights:
- Actual Cost by Facility
- Revenue by Region
- Actual Cost by Region
- Budget by Risk Level
As a result, executives quickly understand financial performance and risk exposure.
Click to buy Aerospace and Defence Dashboard in Excel
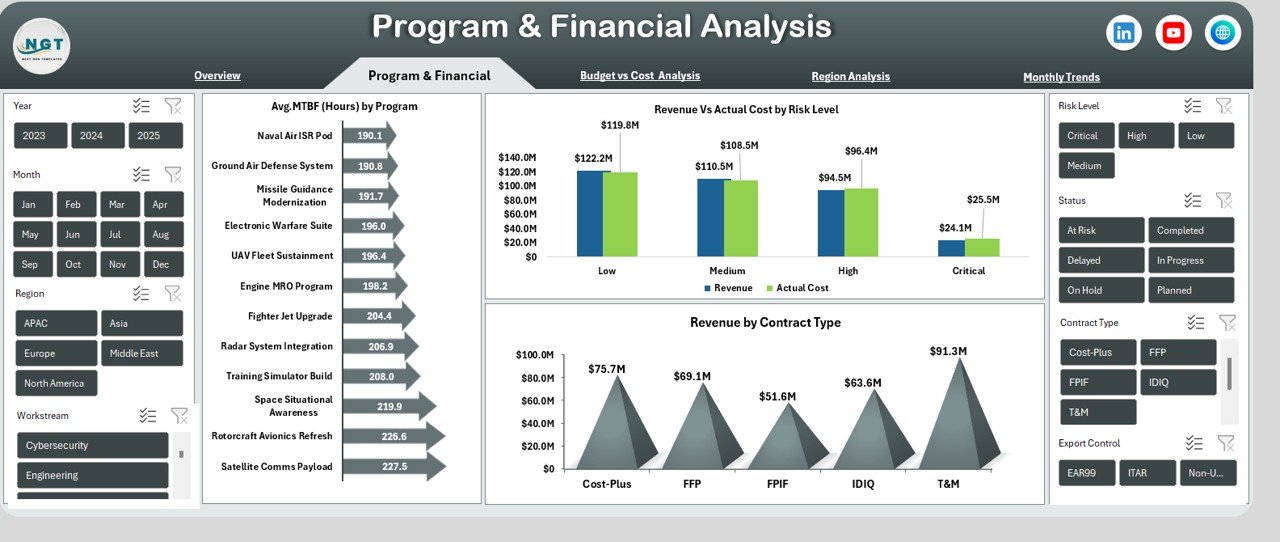
Program & Financial Analysis: How Are Programs Performing?
This sheet focuses on program-level efficiency and financial alignment.
Key Charts:
- Avg. MTBF (Hours) by Program
- Revenue vs Actual Cost by Risk Level
- Revenue by Contract Type
Therefore, teams can evaluate reliability, profitability, and contract performance effectively.
Click to buy Aerospace and Defence Dashboard in Excel
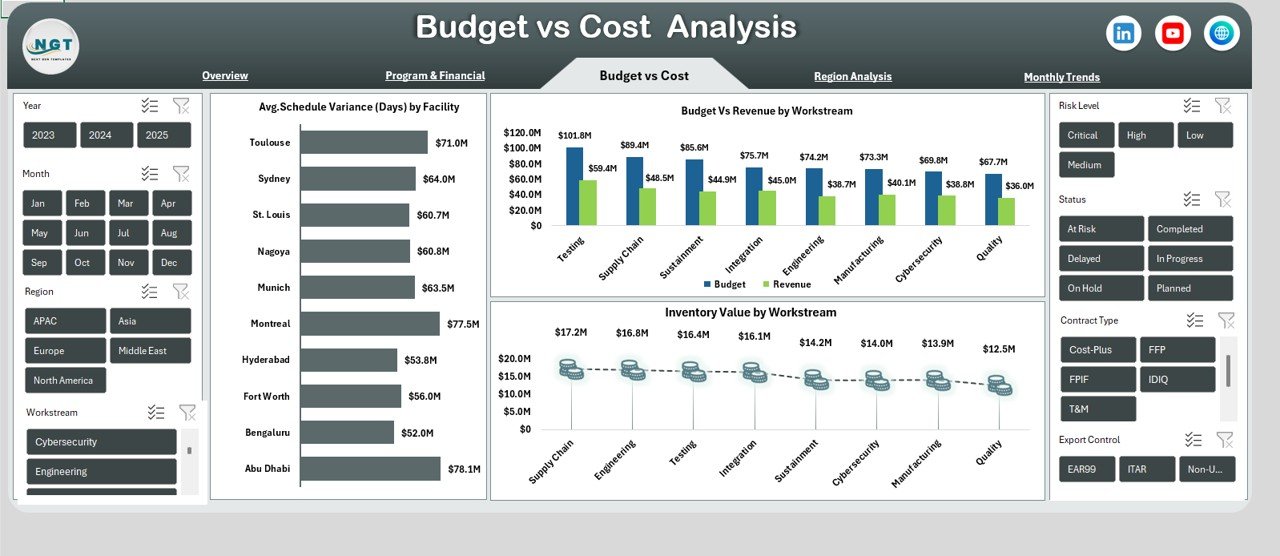
Budget vs Cost Analysis: Where Are Variances Occurring?
Budget control remains critical in defence projects. Hence, this sheet highlights financial gaps.
Key Metrics:
- Avg. Schedule Variance (Days) by Facility
- Budget vs Revenue by Workstream
- Inventory Value by Workstream
As a result, managers identify overruns early and take corrective actions.
Click to buy Aerospace and Defence Dashboard in Excel
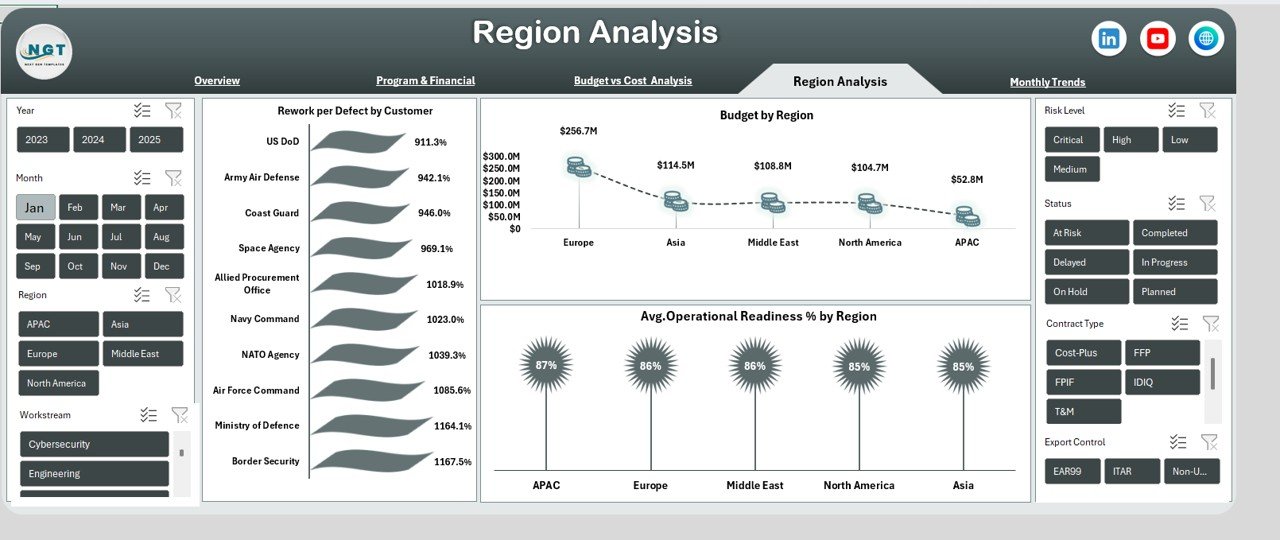
Region Analysis: How Do Regions Compare?
Global operations demand regional performance tracking.
Key Visuals:
- Rework per Defect by Customer
- Budget by Region
- Avg. Operational Readiness % by Region
Thus, leadership can compare efficiency and readiness across regions.
Click to buy Aerospace and Defence Dashboard in Excel
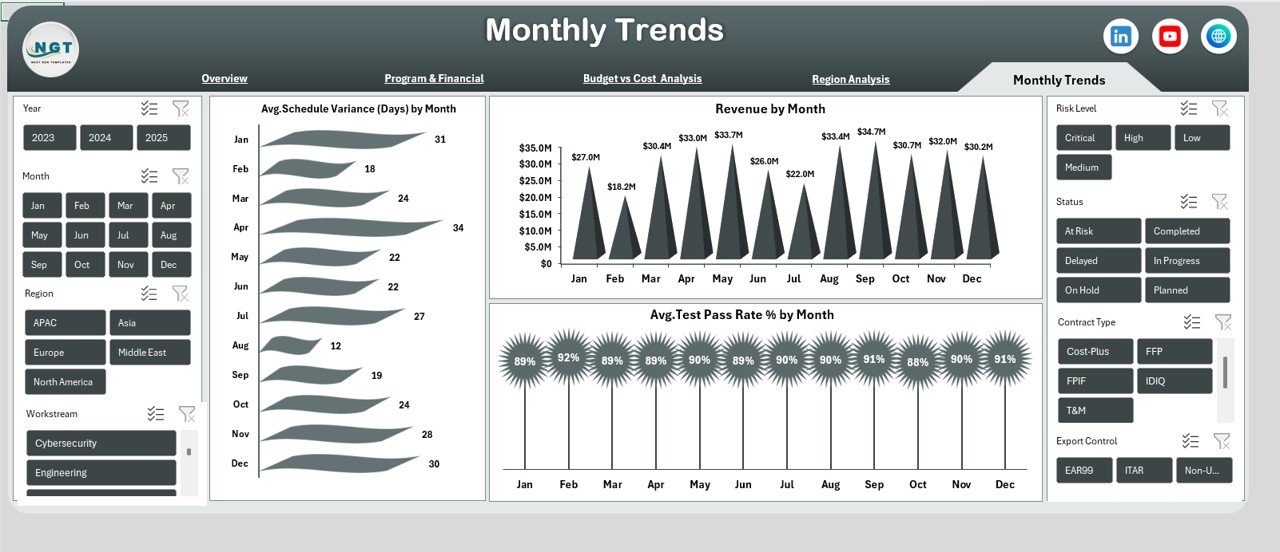
Monthly Trends: Are Performance Levels Improving Over Time?
Trend analysis helps forecast future risks and opportunities.
Monthly Insights:
- Avg. Schedule Variance (Days) by Month
- Revenue by Month
- Avg. Test Pass Rate % by Month
Therefore, teams can spot patterns and improve planning accuracy.
Click to buy Aerospace and Defence Dashboard in Excel
Advantages of the Aerospace and Defence Dashboard in Excel
Using this dashboard offers several clear benefits:
- Centralized Reporting: All key metrics remain in one place
- Time Savings: No need for manual reporting
- Better Decisions: Visual data improves clarity
- Flexible Design: Easy to customize for different programs
- Cost-Effective: No need for expensive BI tools
As a result, organizations gain control without complexity.
Best Practices for the Aerospace and Defence Dashboard in Excel
To maximize dashboard value, follow these best practices:
- Always maintain clean and validated source data
- Update data at regular intervals
- Use slicers for region, facility, and time filtering
- Review KPIs monthly with stakeholders
- Align dashboard metrics with strategic objectives
Consequently, the dashboard stays relevant and reliable.
Who Can Use This Dashboard?
This dashboard supports a wide range of professionals:
- Aerospace Program Managers
- Defence Financial Analysts
- Operations and Maintenance Teams
- Risk and Compliance Officers
- Senior Executives and Decision-Makers
Therefore, it works well across departments and roles.
Conclusion: Is the Aerospace and Defence Dashboard in Excel Worth Using?
Yes, absolutely. The Aerospace and Defence Dashboard in Excel simplifies complex data and transforms it into meaningful insights. Moreover, it improves visibility, accountability, and performance tracking. As a result, organizations gain stronger financial control and operational readiness without technical complexity.
Frequently Asked Questions (FAQs)
What is the Aerospace and Defence Dashboard in Excel used for?
It helps track financial, operational, program, and regional performance using visual analytics.
Can I customize this dashboard?
Yes, you can easily modify charts, KPIs, and layouts inside Excel.
Does this dashboard require advanced Excel skills?
No. Basic Excel knowledge works well for using and updating it.
Can this dashboard handle large datasets?
Yes, especially when combined with pivot tables and structured data.
Is this dashboard suitable for both aerospace and defence sectors?
Yes, the structure supports both industries effectively.
Visit our YouTube channel to learn step-by-step video tutorials
Watch the step-by-step video tutorial:
Click to buy Aerospace and Defence Dashboard in Excel