Managing refinery contracts demands accuracy, transparency, and constant performance monitoring. Refineries deal with high-value vendor contracts, strict compliance clauses, penalty conditions, service-level agreements, and long-term commitments. Therefore, decision-makers cannot rely on scattered Excel sheets or manual reports anymore. They need a structured, interactive, and real-time analytical solution.
That is exactly where a Refinery Contract KPI Dashboard in Power BI delivers massive value. This ready-to-use dashboard converts raw contract data into meaningful KPIs, visual indicators, trends, and comparisons. As a result, refinery procurement teams, contract managers, and leadership teams gain complete control over contract performance and take faster, data-driven decisions.
In this in-depth guide, you will learn what a Refinery Contract KPI Dashboard in Power BI is, why it is essential, how it works, its page structure, KPI logic, Excel data design, advantages, best practices, and frequently asked questions. By the end, you will clearly understand how this dashboard transforms contract governance in refinery operations.
Click to buy Refinery Contract KPI Dashboard in Power BI
What Is a Refinery Contract KPI Dashboard in Power BI?
A Refinery Contract KPI Dashboard in Power BI is a centralized performance monitoring and analytics solution designed to track, analyze, and evaluate key performance indicators related to refinery contracts.
Instead of managing contract data across multiple spreadsheets, this dashboard consolidates all KPIs into a single interactive report built using Power BI with Microsoft Excel as the data source. Consequently, users can monitor Month-to-Date (MTD) and Year-to-Date (YTD) performance, compare results against targets, and analyze historical trends effortlessly.
Most importantly, the dashboard supports both LTB (Lower the Better) and UTB (Upper the Better) KPI logic, which makes it suitable for financial, operational, compliance, and efficiency-based contract metrics.
Why Do Refineries Need a Contract KPI Dashboard?
Refinery contracts involve large financial exposure and operational risk. Therefore, even small inefficiencies can result in cost overruns, compliance penalties, or service disruptions.
Without a structured KPI dashboard, refineries often face the following challenges:
- Contract performance data spread across multiple files
- Manual KPI calculations that cause errors
- Delayed visibility into underperforming contracts
- Limited comparison between current and previous periods
- Weak accountability and governance
However, when refineries use a Contract KPI Dashboard in Power BI, they eliminate these problems and gain real-time visibility into contract health.
How Does a Refinery Contract KPI Dashboard in Power BI Work?
The dashboard works on a simple yet powerful concept. You maintain contract KPI data in structured Excel sheets, and Power BI automatically converts that data into visuals, calculations, and performance indicators.
Overall Workflow
- Enter Actual KPI values in Excel
- Enter Target KPI values in Excel
- Define KPIs with logic, units, and formulas
- Refresh the Power BI dashboard
- Analyze MTD and YTD performance instantly
As a result, users avoid complex system integrations while still achieving enterprise-level analytics.
What Are the Main Pages in the Refinery Contract KPI Dashboard?
This ready-to-use Power BI dashboard contains three well-structured pages, each designed for a specific analytical purpose.
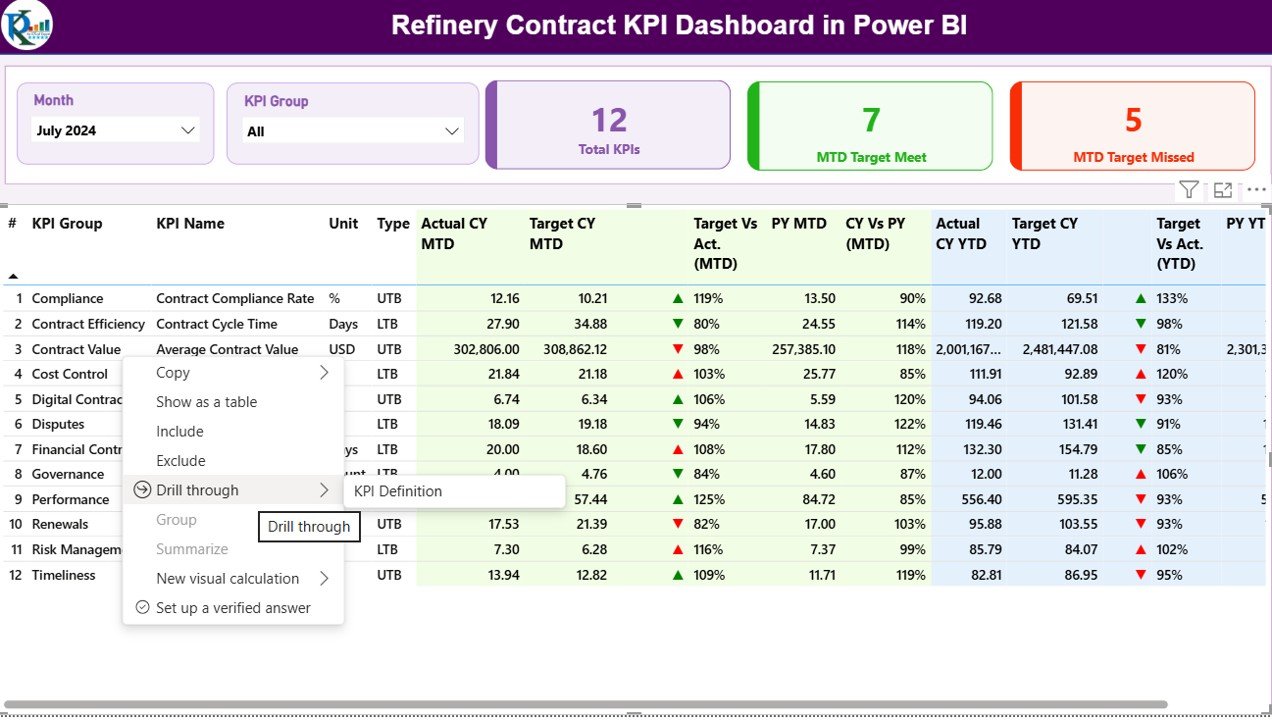
Summary Page
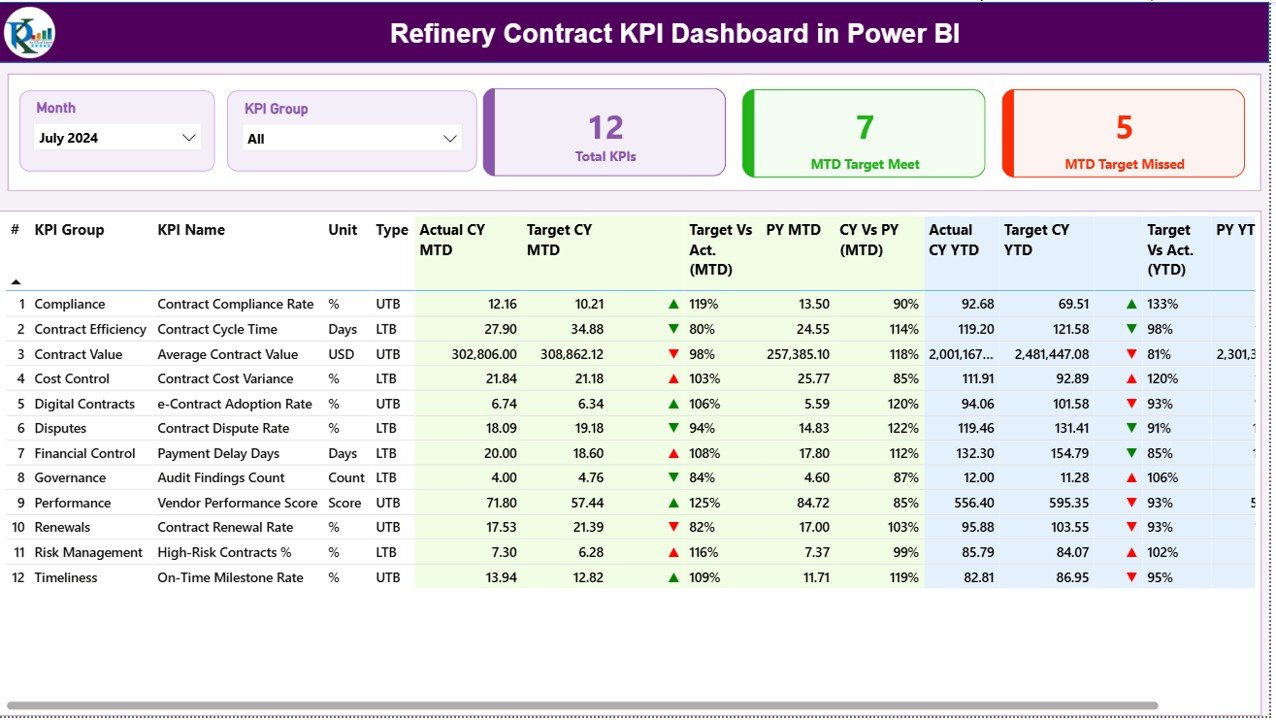
The Summary Page acts as the control center of the dashboard. It provides a complete snapshot of contract performance at a glance.
Key Elements on the Summary Page
Dynamic Slicers
- Month Slicer: Filters KPIs by reporting month
- KPI Group Slicer: Filters KPIs by category
These slicers allow focused and quick analysis.
KPI Cards
At the top, you see three important cards:
- Total KPIs Count
- MTD Target Met Count
- MTD Target Missed Count
These cards immediately highlight overall performance.
Detailed KPI Table Explained
The KPI table delivers deep insights using multiple calculated fields:
- KPI Number: Sequential identifier of each KPI
- KPI Group: Category of the KPI
- KPI Name: Name of the contract KPI
- Unit: Unit of measurement
- Type: LTB or UTB
MTD Performance Metrics
- Actual CY MTD: Current Year actual MTD value
Target CY MTD: Current Year target MTD value
MTD Icon:
▲ Green for target met
▼ Red for target missed
Target vs Actual (MTD):
Formula: Actual MTD / Target MTD
PY MTD: Previous Year MTD value
CY vs PY (MTD):
Formula: CY MTD / PY MTD
YTD Performance Metrics
- Actual CY YTD
- Target CY YTD
- YTD Icon
- Target vs Actual (YTD):
Formula: Actual YTD / Target YTD
PY YTD
- CY vs PY (YTD)
Because of this structure, users can analyze short-term and long-term contract performance simultaneously.
Click to buy Refinery Contract KPI Dashboard in Power BI
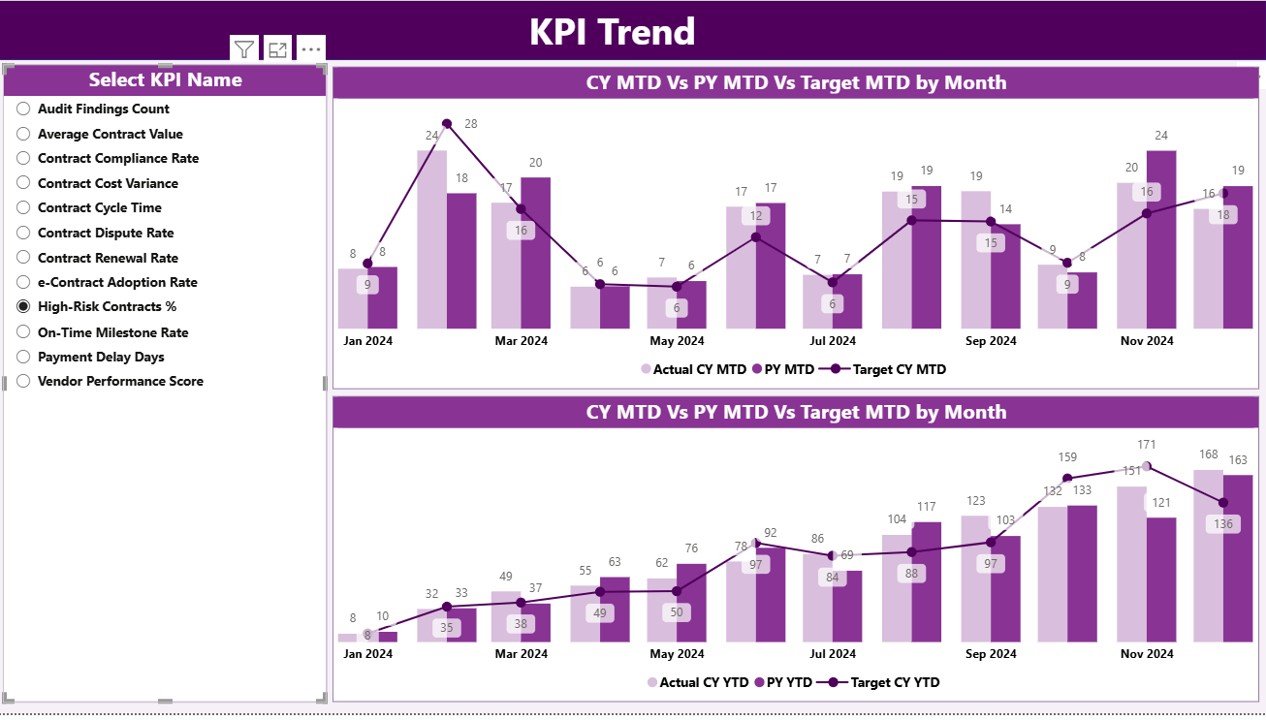
KPI Trend Page
The KPI Trend Page focuses on performance trends over time. Instead of just seeing numbers, users visualize how KPIs behave month after month.
Key Features of the KPI Trend Page
Two Combo Charts:
MTD trend: Actual vs Target vs Previous Year
YTD trend: Actual vs Target vs Previous Year
KPI Name Slicer on the left
With these visuals, users quickly identify improving trends, declining performance, and seasonal patterns.
Click to buy Refinery Contract KPI Dashboard in Power BI
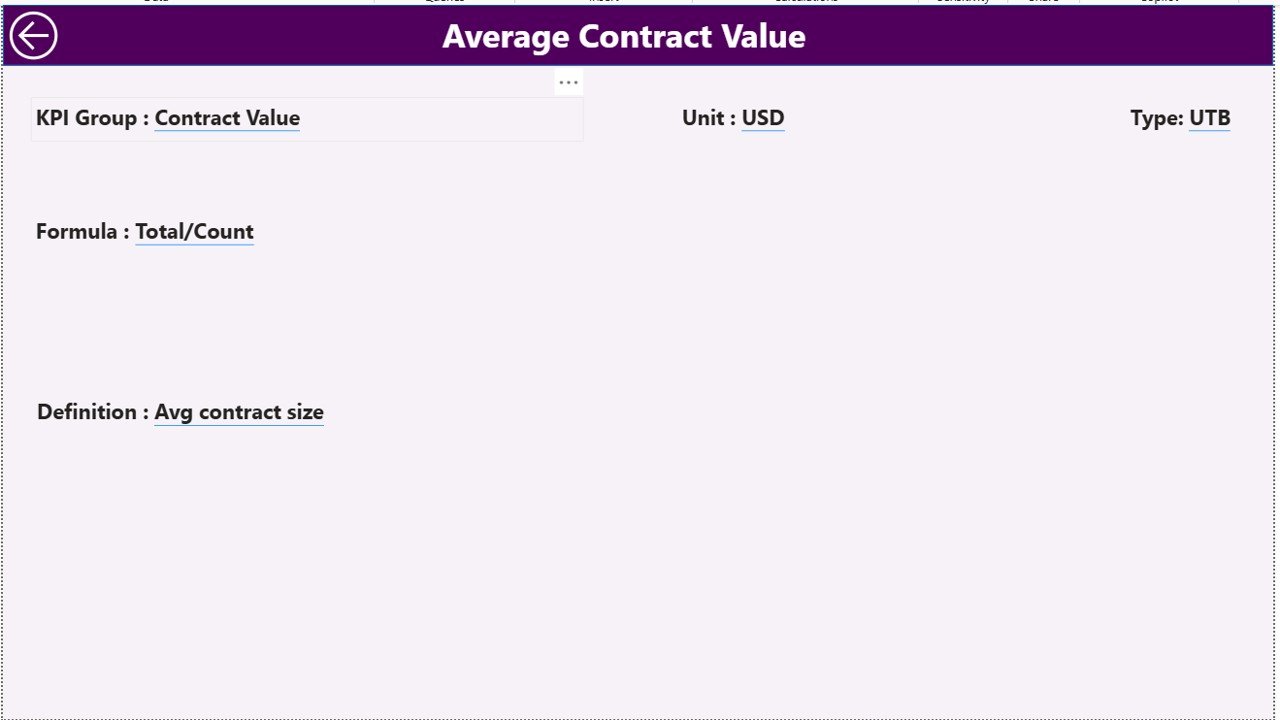
KPI Definition Page
The KPI Definition Page acts as a reference and governance layer. This page remains hidden and works as a drill-through page.
What Information Does It Show?
- KPI Formula
- KPI Definition
- Unit of Measurement
- KPI Type (LTB or UTB)
Users can drill through from the Summary Page to understand exactly how a KPI works. Then, they can return using the back button at the top-left corner.
Click to buy Refinery Contract KPI Dashboard in Power BI
How Is Excel Data Structured for This Dashboard?
The dashboard uses Excel as the data source, which keeps implementation simple and flexible.
Required Excel Worksheets
Input_Actual Sheet
In this sheet, you enter actual KPI values:
- KPI Name
- Month (use first date of the month)
- MTD Value
- YTD Value
Click to buy Refinery Contract KPI Dashboard in Power BI
Input_Target Sheet
In this sheet, you define target values:
- KPI Name
- Month
- MTD Target
- YTD Target
KPI Definition Sheet
This sheet defines KPI metadata:
- KPI Number
- KPI Group
- KPI Name
- Unit
- Formula
- Definition
- Type (LTB or UTB)
Because of this structure, the dashboard supports easy updates and scalability.
Advantages of a Refinery Contract KPI Dashboard in Power BI
Using a Contract KPI Dashboard delivers significant operational and financial benefits.
Key Advantages
- Centralized contract performance tracking
- Real-time MTD and YTD monitoring
- Clear visual status indicators
- Easy comparison with previous year data
- Strong contract governance and accountability
- Reduced manual reporting effort
- Faster and smarter decision-making
Therefore, refinery leaders gain confidence while managing high-value contracts.
How Does This Dashboard Improve Contract Governance?
Strong governance requires transparency and consistency. This dashboard supports governance by:
- Standardizing KPI definitions
- Enforcing target tracking
- Highlighting underperforming contracts
- Supporting audit-ready reporting
- Improving accountability across teams
As a result, refineries reduce compliance risks and improve vendor performance.
Best Practices for the Refinery Contract KPI Dashboard in Power BI
To maximize value, follow these best practices.
Define KPIs Clearly
Always define formulas, logic, and units clearly in the KPI Definition sheet.
Maintain Data Discipline
Enter monthly data consistently and avoid missing values.
Use LTB and UTB Logic Correctly
Assign correct KPI types to ensure accurate status indicators.
Review Trends Regularly
Analyze MTD and YTD trends during contract review meetings.
Align Targets with Strategy
Set realistic targets that align with business goals.
Train Users
Ensure stakeholders understand how to interpret KPIs and icons.
Who Can Benefit from This Dashboard?
This dashboard supports multiple refinery roles:
- Contract Managers
- Procurement Teams
- Finance Teams
- Operations Managers
- Compliance Officers
- Senior Leadership
Because of its flexibility, teams can adapt it to various contract categories.
Conclusion: Why Should Refineries Use a Contract KPI Dashboard in Power BI?
A Refinery Contract KPI Dashboard in Power BI transforms how refineries monitor, control, and improve contract performance. Instead of reacting to issues late, teams proactively identify risks, track progress, and ensure compliance.
By combining Excel-based data entry with powerful Power BI analytics, this dashboard delivers clarity, speed, and confidence. Ultimately, it strengthens contract governance, improves financial control, and supports smarter decision-making across refinery operations.
Frequently Asked Questions (FAQs)
What is a Refinery Contract KPI Dashboard in Power BI?
It is an interactive reporting solution that tracks refinery contract KPIs using Power BI and Excel.
Can I customize KPIs in this dashboard?
Yes, you can easily add or modify KPIs using the Excel data sheets.
Does the dashboard support both MTD and YTD analysis?
Yes, it tracks both MTD and YTD performance with targets and trends.
What does LTB and UTB mean?
LTB means Lower the Better, while UTB means Upper the Better.
Do I need advanced Power BI skills to use it?
No, basic Power BI knowledge and Excel data entry skills are sufficient.
Can this dashboard support multiple contract categories?
Yes, KPI Group slicers allow flexible categorization.
How often should data be updated?
You should update data monthly for accurate performance tracking.
Visit our YouTube channel to learn step-by-step video tutorials
Watch the step-by-step video tutorial:
Click to buy Refinery Contract KPI Dashboard in Power BI