Water scarcity continues to grow as a global challenge. Therefore, organizations, governments, municipalities, and sustainability teams must monitor water harvesting performance more closely than ever. However, when data remains scattered across Excel sheets or manual reports, decision-making becomes slow and inaccurate.
That is exactly why a Water Harvesting KPI Dashboard in Power BI plays a critical role in modern water resource management.
This article explains everything you need to know about a Water Harvesting KPI Dashboard in Power BI, how it works, its page-wise structure, KPIs, advantages, best practices, and frequently asked questions. By the end of this guide, you will clearly understand how this dashboard supports data-driven water conservation strategies.
Click to Purchases Water Harvesting KPI Dashboard in Power BI
What Is a Water Harvesting KPI Dashboard in Power BI?
A Water Harvesting KPI Dashboard in Power BI is a centralized analytics and reporting tool designed to track, analyze, and monitor water harvesting performance using key performance indicators (KPIs).
Instead of reviewing multiple spreadsheets, users can view real-time insights through interactive visuals, tables, slicers, and trend charts. As a result, decision-makers gain better visibility into performance against targets.
Moreover, this dashboard helps organizations:
-
Track water harvesting efficiency
-
Monitor target achievement for MTD and YTD
-
Compare current performance with previous years
-
Identify underperforming KPIs quickly
-
Improve sustainability planning
Because Power BI offers interactive filtering and drill-through features, this dashboard becomes both powerful and easy to use.
Why Do Organizations Need a Water Harvesting KPI Dashboard?
Water harvesting projects involve multiple KPIs, targets, and timelines. However, manual tracking creates gaps and delays. Therefore, organizations need a centralized system.
A Water Harvesting KPI Dashboard in Power BI helps because:
-
It converts raw data into visual insights
-
It reduces reporting time significantly
-
It improves accountability across KPI groups
-
It supports regulatory and sustainability reporting
-
It enables proactive decision-making
As a result, teams move from reactive reporting to proactive water management.
Click to Purchases Water Harvesting KPI Dashboard in Power BI
What Data Source Does the Water Harvesting KPI Dashboard Use?
This dashboard uses Excel as the data source, which makes it flexible and easy to maintain.
You only need to update three Excel worksheets:
-
Input_Actual
-
Input_Target
-
KPI Definition
Once you refresh Power BI, the dashboard updates automatically. Therefore, users do not need advanced technical skills.
Overview of Pages in the Water Harvesting KPI Dashboard in Power BI
This ready-to-use dashboard includes three well-structured pages in the Power BI Desktop file. Each page serves a specific analytical purpose.
What Is Included in the Summary Page of the Dashboard?
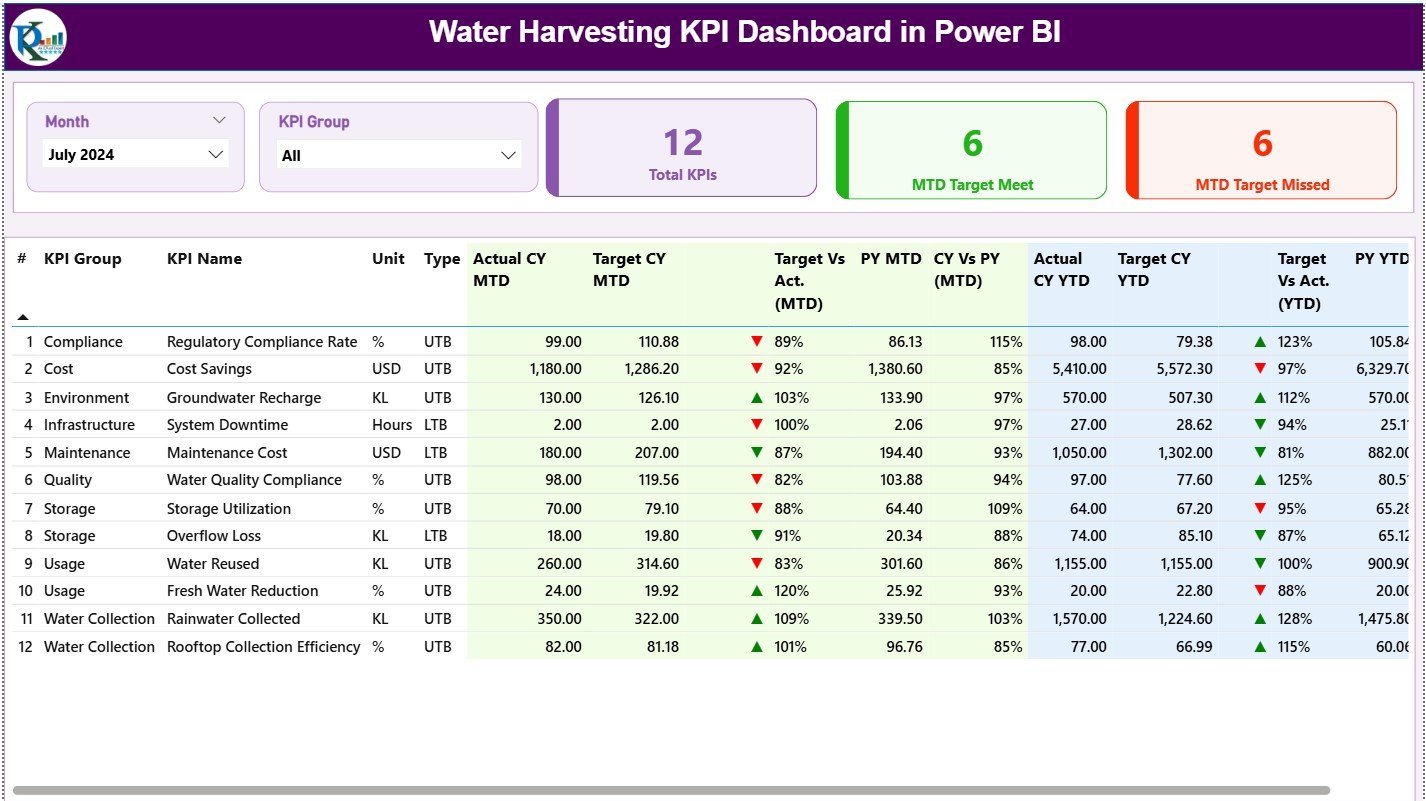
The Summary Page acts as the main landing page of the dashboard. It provides a complete snapshot of water harvesting performance.
Top-Level Slicers
At the top of the page, you will find:
-
Month Slicer
-
KPI Group Slicer
These slicers allow users to filter data dynamically. As a result, users can focus on specific periods or KPI categories instantly.
KPI Cards on the Summary Page
The dashboard displays three KPI cards at the top:
-
Total KPIs Count
Shows the total number of KPIs tracked in the dashboard. -
MTD Target Met Count
Displays how many KPIs achieved the MTD target. -
MTD Target Missed Count
Highlights KPIs that failed to meet the MTD target.
Because these cards update dynamically, users can assess performance at a glance.
Detailed KPI Table on the Summary Page
Below the KPI cards, the dashboard displays a detailed KPI table with rich metrics.
The table includes the following columns:
-
KPI Number
Sequential number assigned to each KPI. -
KPI Group
Category or group of the KPI. -
KPI Name
Name of the water harvesting KPI. -
Unit
Measurement unit such as liters, percentage, or volume. -
Type (LTB / UTB)
Indicates whether the KPI is:-
LTB (Lower the Better)
-
UTB (Upper the Better)
-
-
Actual CY MTD
Current Year actual MTD value. -
Target CY MTD
Current Year target MTD value. -
MTD Icon
Visual indicator using:-
▲ Green arrow for target met
-
▼ Red arrow for target missed
-
-
Target vs Actual (MTD %)
Calculated as:
Actual MTD / Target MTD -
PY MTD
Previous Year MTD value. -
CY vs PY (MTD %)
Comparison of current and previous year MTD values. -
Actual CY YTD
Current Year actual YTD value. -
Target CY YTD
Current Year target YTD value. -
YTD Icon
Visual status indicator for YTD performance. -
Target vs Actual (YTD %)
Calculated as:
Actual YTD / Target YTD -
PY YTD
Previous Year YTD value. -
CY vs PY (YTD %)
Comparison of current and previous year YTD values.
Because this table includes both MTD and YTD analysis, users can evaluate short-term and long-term performance simultaneously.
Click to Purchases Water Harvesting KPI Dashboard in Power BI
What Is the KPI Trend Page in the Dashboard?
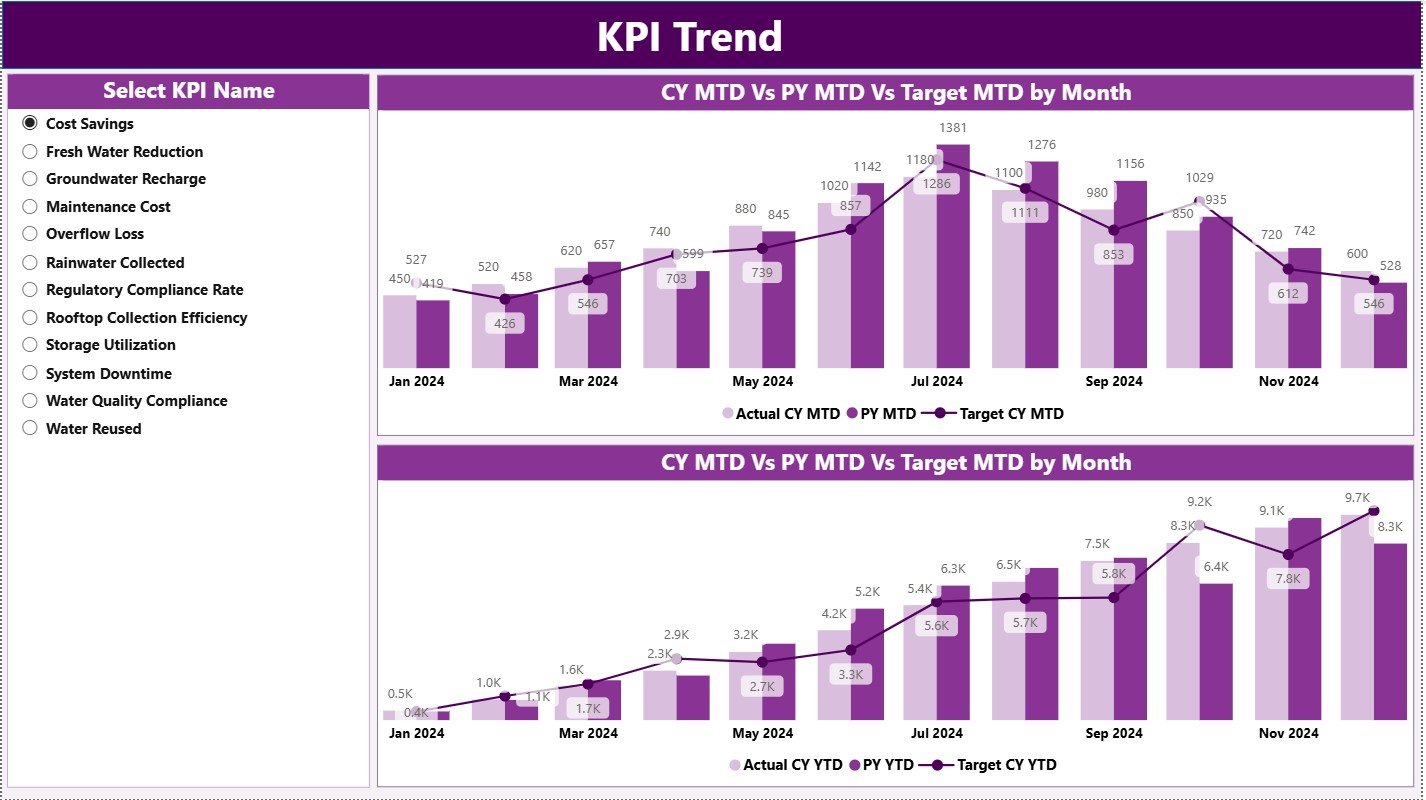
The KPI Trend Page focuses on trend analysis.
Charts Available on the KPI Trend Page
This page includes two combo charts:
-
MTD Trend Chart
-
Actual CY
-
Previous Year
-
Target
-
-
YTD Trend Chart
-
Actual CY
-
Previous Year
-
Target
-
These combo charts help users understand performance patterns over time.
KPI Name Slicer
On the left side, the page includes a KPI Name slicer. Users can select any KPI to analyze trends in detail.
As a result, trend analysis becomes simple and interactive.
Click to Purchases Water Harvesting KPI Dashboard in Power BI
What Is the KPI Definition Page?
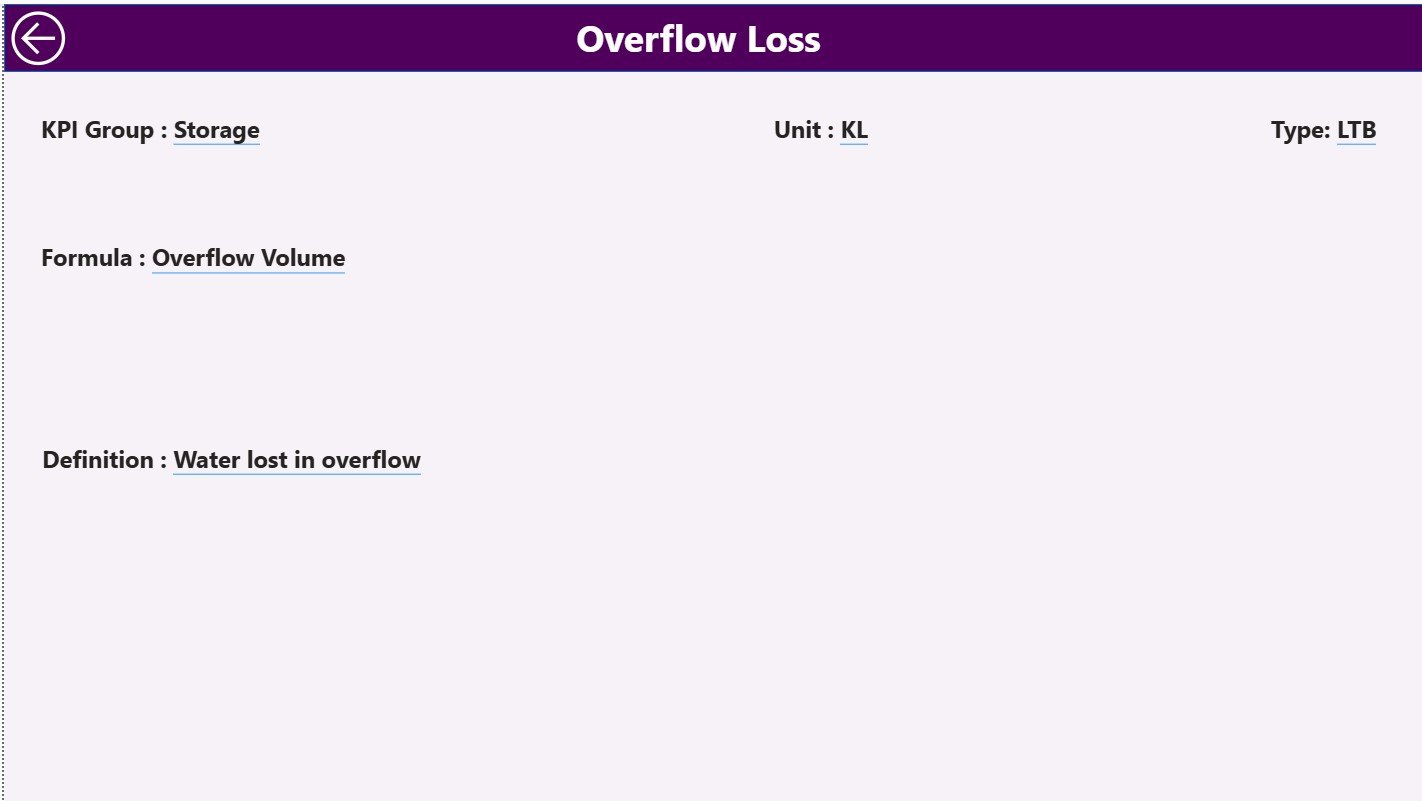
The KPI Definition Page acts as a drill-through page.
Key Characteristics of the KPI Definition Page
-
Hidden from normal navigation
-
Accessible via drill-through from the Summary Page
-
Displays:
-
KPI Formula
-
KPI Definition
-
KPI Unit
-
KPI Type
-
This page ensures transparency and clarity for every KPI.
To return to the main page, users simply click the Back button located at the top-left corner.
How Does the Excel Data Model Work?
The dashboard uses Excel as its backend data source. Therefore, data maintenance becomes easy and flexible.
Input_Actual Sheet
In the Input_Actual sheet, users enter:
-
KPI Name
-
Month (use the first date of the month)
-
MTD Actual Value
-
YTD Actual Value
This sheet captures real performance data.
Input_Target Sheet
In the Input_Target sheet, users enter:
-
KPI Name
-
Month (use the first date of the month)
-
MTD Target Value
-
YTD Target Value
This sheet defines performance expectations.
KPI Definition Sheet
In the KPI Definition sheet, users enter:
-
KPI Number
-
KPI Group
-
KPI Name
-
Unit
-
Formula
-
Definition
-
Type (LTB or UTB)
This sheet provides structure and documentation for KPIs.
Click to Purchases Water Harvesting KPI Dashboard in Power BI
Advantages of a Water Harvesting KPI Dashboard in Power BI
Using a Water Harvesting KPI Dashboard in Power BI delivers multiple benefits.
1. Centralized Monitoring
All KPIs remain available in one dashboard. Therefore, teams avoid confusion and duplication.
2. Faster Decision-Making
Visual insights allow leaders to act quickly.
3. Improved Accountability
KPI groups and targets create ownership and responsibility.
4. Historical Comparison
MTD and YTD comparisons with previous years highlight trends.
5. Easy Maintenance
Excel-based data entry simplifies updates.
6. Scalability
Organizations can add more KPIs without redesigning the dashboard.
Click to Purchases Water Harvesting KPI Dashboard in Power BI
Best Practices for the Water Harvesting KPI Dashboard in Power BI
Following best practices ensures maximum value from the dashboard.
1. Define Clear KPIs
Always align KPIs with water conservation goals.
2. Maintain Consistent Units
Use consistent measurement units across KPIs.
3. Update Data Regularly
Schedule monthly data updates to keep insights fresh.
4. Validate Targets
Ensure targets remain realistic and achievable.
5. Use KPI Groups Effectively
Group KPIs by process, location, or initiative.
6. Review Trends Periodically
Analyze trends monthly and quarterly for better planning.
Click to Purchases Water Harvesting KPI Dashboard in Power BI
Opportunities for Improvement in Water Harvesting Dashboards
Although the dashboard is powerful, organizations can enhance it further.
-
Add location-level analysis
-
Include weather data integration
-
Automate Excel data updates
-
Add forecasting visuals
-
Include sustainability impact metrics
These enhancements can increase strategic value over time.
Who Can Use a Water Harvesting KPI Dashboard?
This dashboard suits multiple users, including:
-
Municipal corporations
-
Government water departments
-
Smart city projects
-
Industrial water management teams
-
Sustainability consultants
-
NGOs working on water conservation
Because the dashboard remains flexible, it adapts easily to different use cases.
Conclusion
A Water Harvesting KPI Dashboard in Power BI transforms raw water management data into actionable insights. Instead of relying on manual reports, organizations gain a clear, interactive, and structured view of performance.
With features such as KPI cards, detailed tables, trend charts, and drill-through definitions, this dashboard supports smarter decisions, better accountability, and improved sustainability outcomes.
If you want to monitor water harvesting initiatives effectively, this dashboard offers a reliable and scalable solution.
Click to Purchases Water Harvesting KPI Dashboard in Power BI
Frequently Asked Questions (FAQs)
What is the main purpose of a Water Harvesting KPI Dashboard in Power BI?
The main purpose is to track, analyze, and monitor water harvesting KPIs against targets using interactive visuals.
Can beginners use this dashboard?
Yes, because data entry happens in Excel and navigation remains simple.
How often should data be updated?
You should update data monthly for accurate MTD and YTD analysis.
Can new KPIs be added later?
Yes, you can add new KPIs by updating the Excel sheets and refreshing Power BI.
Does the dashboard support year-over-year comparison?
Yes, it includes CY vs PY analysis for both MTD and YTD.
Is this dashboard suitable for government projects?
Yes, it works well for municipal, government, and sustainability initiatives.
Click to Purchases Water Harvesting KPI Dashboard in Power BI
Visit our YouTube channel to learn step-by-step video tutorials