The wind energy sector continues to grow rapidly as organizations focus on renewable and sustainable power generation. However, managing wind energy operations effectively requires continuous monitoring of performance, efficiency, availability, and reliability. Without structured reporting, decision-makers often struggle to identify underperformance, energy losses, or operational risks in time.
That is exactly why a Wind Energy KPI Scorecard in Excel becomes a powerful and practical solution. This ready-to-use scorecard helps wind energy operators, plant managers, and analysts track critical KPIs, compare actual performance against targets, analyze trends, and take timely corrective actions.
In this detailed and SEO-friendly article, you will learn what a Wind Energy KPI Scorecard in Excel is, why it is important, how it works, its worksheet-wise structure, advantages, best practices, challenges, and frequently asked questions. The language remains simple, clear, and actionable so you can apply it immediately.
Click to Purchases Wind Energy KPI Scorecard in Excel
What Is a Wind Energy KPI Scorecard in Excel?
A Wind Energy KPI Scorecard in Excel is a structured performance management tool designed to track, analyze, and visualize key performance indicators related to wind power generation and operations.
Instead of working with multiple spreadsheets or static reports, this scorecard consolidates all critical KPIs into one interactive Excel file. As a result, users can quickly assess operational efficiency, energy output, downtime, and target achievement.
Moreover, because the scorecard supports MTD (Month-to-Date) and YTD (Year-to-Date) analysis, stakeholders gain both short-term and long-term performance visibility.
Why Do Wind Energy Organizations Need a KPI Scorecard?
Wind energy projects involve high capital investment and complex operations. Therefore, even small inefficiencies can lead to significant revenue loss.
A Wind Energy KPI Scorecard in Excel helps because:
-
It provides a single source of truth for operational KPIs
-
It improves transparency across turbines, plants, or regions
-
It highlights deviations from targets early
-
It supports data-driven operational decisions
-
It reduces manual reporting effort
As a result, organizations move from reactive monitoring to proactive performance management.
Click to Purchases Wind Energy KPI Scorecard in Excel
How Does a Wind Energy KPI Scorecard in Excel Work?
The scorecard follows a simple and logical workflow.
First, users enter actual performance data and targets into structured input sheets. Then, Excel formulas calculate KPI results automatically. Finally, the scorecard displays insights using tables, indicators, and trend charts.
Because of this structure, users can update data regularly while keeping the scorecard accurate and up to date.
Overall Structure of the Wind Energy KPI Scorecard in Excel
This ready-to-use template contains 4 well-designed worksheets, each serving a specific purpose. Together, they form a complete KPI tracking and analysis system.
Let us understand each worksheet in detail.
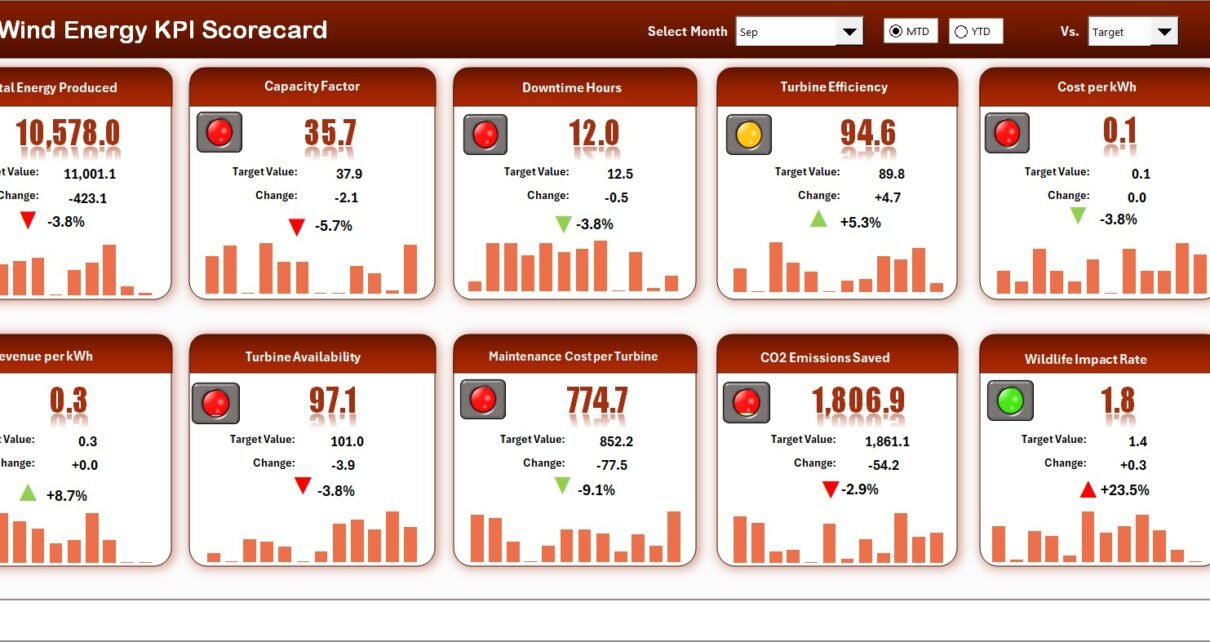
1. Scorecard Sheet – The Main Performance Dashboard
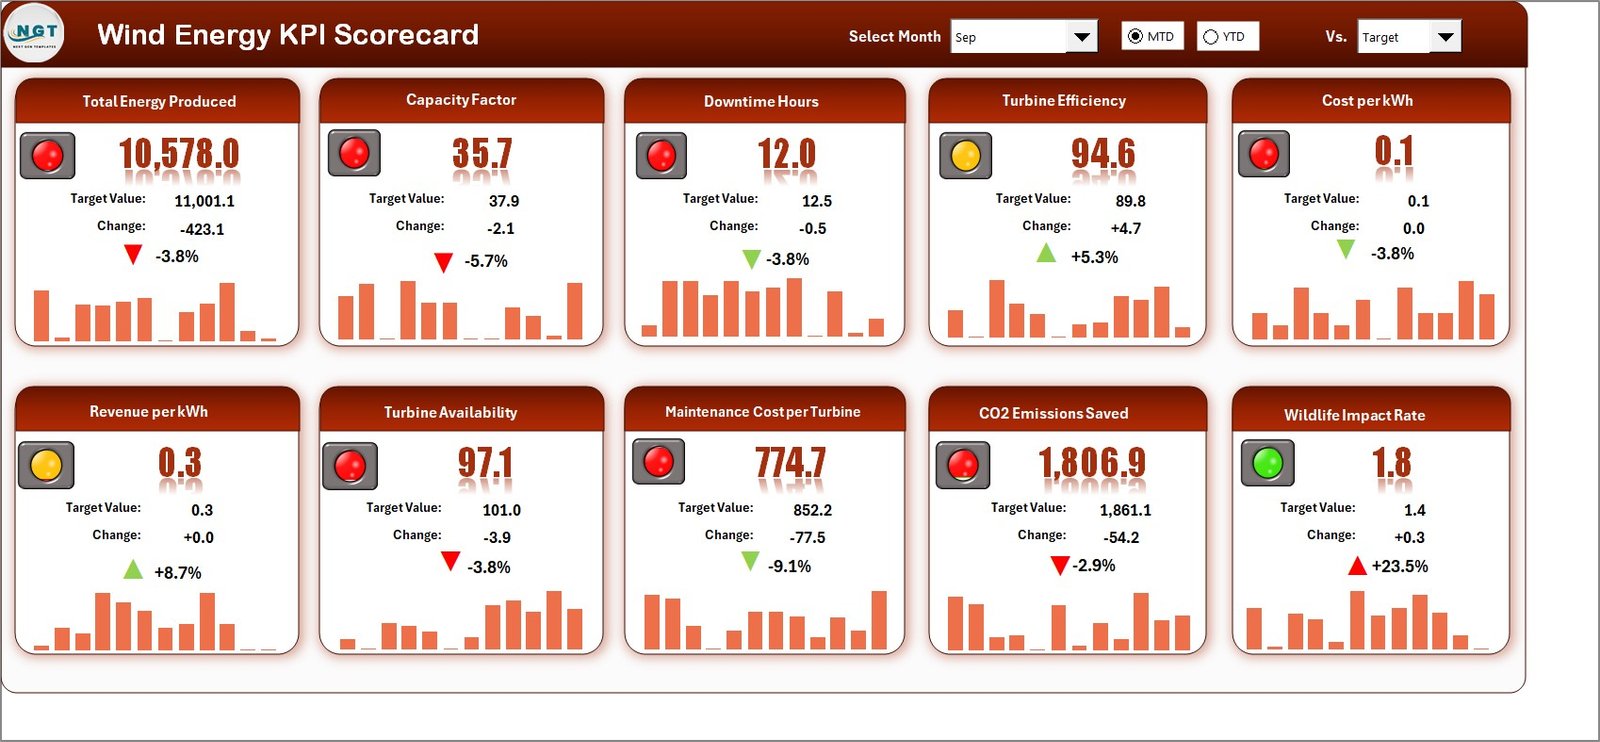
The Scorecard Sheet is the core of the Wind Energy KPI Scorecard in Excel. This sheet provides a consolidated view of KPI performance.
Key Features of the Scorecard Sheet
Dropdown Menus for Analysis
Users can select:
-
Month
-
MTD (Month-to-Date)
-
YTD (Year-to-Date)
Because of these dropdowns, performance analysis becomes flexible and interactive.
Actual vs Target Comparison
For each KPI, the scorecard displays:
-
Actual performance
-
Target value
This comparison helps users quickly understand whether performance meets expectations.
Visual Indicators
The scorecard uses:
-
Color-coded indicators
-
Conditional formatting
These visuals instantly highlight good or poor performance without deep analysis.
Comprehensive KPI Overview
The scorecard displays all relevant KPI details in one place, including:
-
KPI values
-
MTD and YTD comparisons
-
Performance status
As a result, decision-makers get a quick and clear overview.
Click to Purchases Wind Energy KPI Scorecard in Excel
2. KPI Trend Sheet – Detailed Performance Analysis
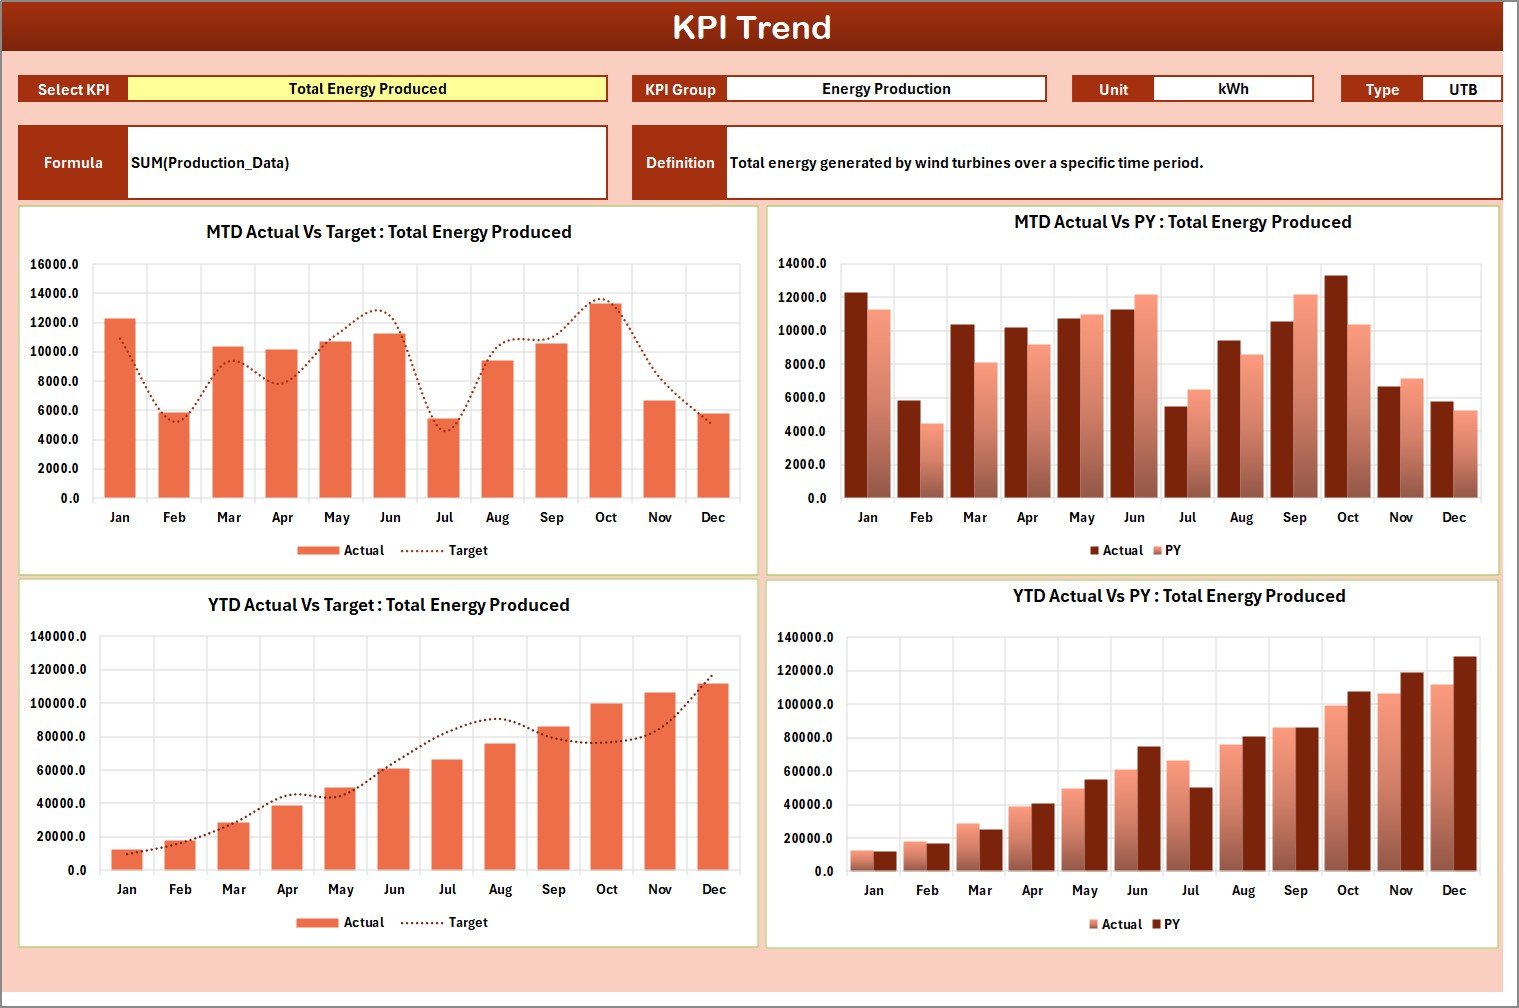
The KPI Trend Sheet supports in-depth analysis of individual KPIs.
KPI Selection and Details
Users can select a KPI name from the dropdown available at cell C3. Once selected, the sheet displays:
-
KPI Group
-
Unit of KPI
-
KPI Type (Lower the Better or Upper the Better)
-
KPI Formula
-
KPI Definition
This information ensures clarity and transparency.
Trend Charts for Better Insights
The sheet displays MTD and YTD trend charts for:
-
Actual values
-
Target values
-
Previous Year (PY) values
Because of these charts, users can identify performance patterns, seasonal behavior, and long-term trends easily.
Click to Purchases Wind Energy KPI Scorecard in Excel
3. Input Data Sheet – Centralized Data Entry
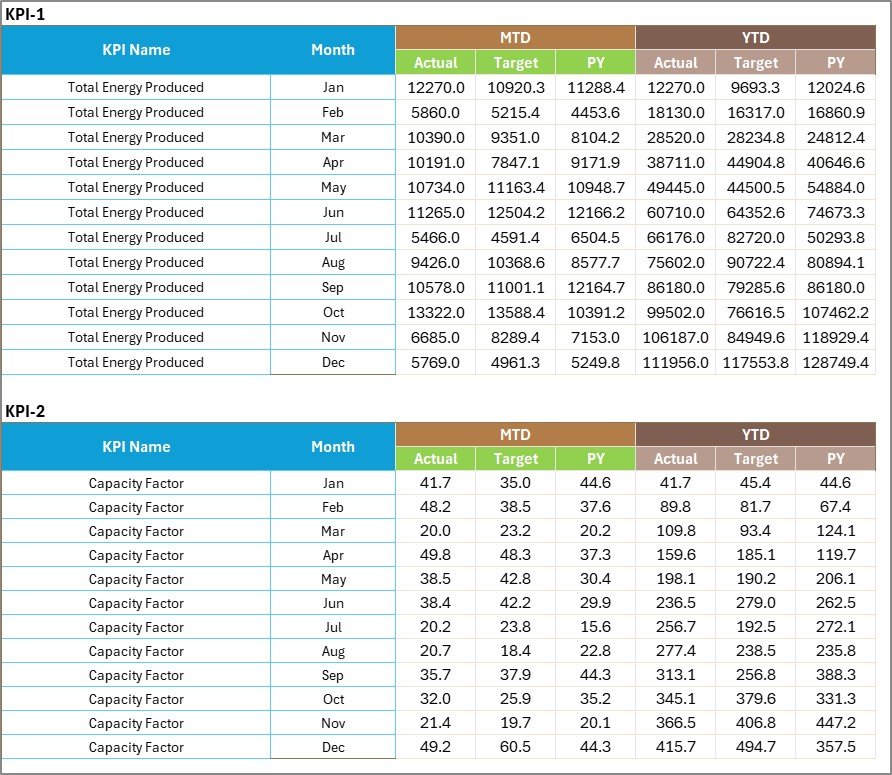
The Input Data Sheet is where users enter all KPI-related data.
Key Functions of the Input Data Sheet
Data Entry
Users record:
-
Actual KPI values
-
Target values
-
Other required metrics
Flexibility and Updates
As new data becomes available, users can update values easily. Consequently, the scorecard always reflects the latest performance.
This centralized data entry approach improves consistency and reduces errors.
4. KPI Definition Sheet – KPI Governance and Standardization
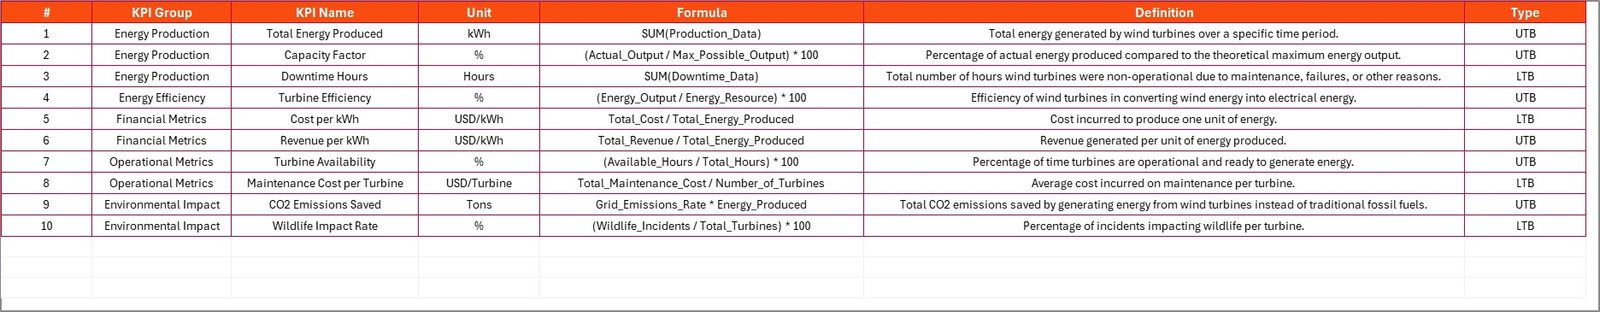
The KPI Definition Sheet defines the logic behind each KPI.
Information Stored in This Sheet
-
KPI Name
-
KPI Group
-
Unit
-
Formula
-
KPI Definition
Because of this sheet, all stakeholders understand:
-
What each KPI measures
-
How calculations work
-
Why each KPI matters
This clarity improves governance and reduces misinterpretation.
Click to Purchases Wind Energy KPI Scorecard in Excel
What Types of KPIs Can Be Tracked in a Wind Energy KPI Scorecard?
A Wind Energy KPI Scorecard in Excel can track various operational and performance metrics, such as:
-
Energy Generation (MWh)
-
Capacity Utilization Factor (CUF)
-
Turbine Availability (%)
-
Downtime Hours
-
Maintenance Cost
-
Energy Losses
-
Grid Availability
-
Forecast Accuracy
-
Mean Time Between Failures (MTBF)
Because the template remains flexible, organizations can customize KPIs based on their operational needs.
Advantages of Wind Energy KPI Scorecard in Excel
Using a Wind Energy KPI Scorecard in Excel delivers multiple benefits.
Key Advantages
✅ Centralized KPI tracking
✅ Clear Actual vs Target comparison
✅ MTD and YTD performance visibility
✅ Trend-based analysis for better forecasting
✅ Easy data updates
✅ No dependency on expensive tools
✅ Familiar Excel environment
As a result, teams gain better control over operations and performance.
How Does This Scorecard Improve Operational Decision-Making?
This scorecard converts raw operational data into actionable insights. For example:
-
If turbine availability drops, teams can schedule maintenance
-
If energy generation falls below target, managers can investigate root causes
-
If downtime increases, leadership can optimize maintenance strategies
Therefore, decisions become faster, informed, and proactive.
Click to Purchases Wind Energy KPI Scorecard in Excel
Common Challenges Without a Wind Energy KPI Scorecard
Without a structured scorecard, organizations often face:
-
Scattered data across multiple files
-
Delayed performance reviews
-
Limited visibility into trends
-
Difficulty comparing periods
-
Poor KPI accountability
A Wind Energy KPI Scorecard in Excel addresses these challenges effectively.
Best Practices for the Wind Energy KPI Scorecard in Excel
To maximize value, follow these best practices:
Best Practices
-
Define KPIs clearly in the KPI Definition sheet
-
Keep KPI formulas simple and consistent
-
Update input data on a fixed schedule
-
Review both MTD and YTD metrics regularly
-
Use trend charts to identify patterns
-
Focus on business-critical KPIs only
-
Validate data before sharing reports
By following these practices, organizations ensure accuracy and long-term usability.
Click to Purchases Wind Energy KPI Scorecard in Excel
Who Can Use a Wind Energy KPI Scorecard in Excel?
This scorecard works well for:
-
Wind Farm Managers
-
Renewable Energy Analysts
-
Operations and Maintenance Teams
-
Energy Planners
-
Plant Heads
-
Sustainability and Reporting Teams
Because Excel remains widely used, adoption becomes smooth across teams.
Why Choose Excel for Wind Energy KPI Scorecards?
Excel offers flexibility and accessibility. Moreover, it allows:
-
Custom KPI calculations
-
Conditional formatting
-
Trend analysis
-
Easy sharing
-
Offline access
Therefore, Excel remains a practical and cost-effective choice for KPI scorecards.
Conclusion
A Wind Energy KPI Scorecard in Excel is not just a reporting tool. It is a complete performance monitoring and decision-support system. It brings clarity, structure, and insight to wind energy operations. Moreover, it helps organizations track KPIs, compare performance against targets, analyze trends, and improve operational efficiency.
By using a well-structured 4-sheet scorecard, wind energy organizations can move from manual reporting to data-driven performance management. When implemented correctly, this scorecard becomes a valuable asset for sustainable energy success.
Click to Purchases Wind Energy KPI Scorecard in Excel
Frequently Asked Questions (FAQs)
What is the main purpose of a Wind Energy KPI Scorecard in Excel?
The main purpose is to track wind energy KPIs, compare actual performance with targets, analyze trends, and support better operational decisions.
Does this scorecard support MTD and YTD analysis?
Yes, it allows users to analyze both MTD and YTD performance through dropdown selections.
Can users customize KPIs in this scorecard?
Yes, users can easily add or modify KPIs using the KPI Definition and Input Data sheets.
Is this scorecard suitable for large wind farms?
Yes, it works for both small and large wind energy operations.
Does this scorecard require VBA or macros?
No, it works using standard Excel features and formulas.
How often should data be updated?
Ideally, data should be updated monthly or as new operational results become available.
Can this scorecard support trend analysis?
Yes, the KPI Trend sheet provides MTD and YTD trend charts for better analysis.
Click to Purchases Wind Energy KPI Scorecard in Excel
Visit our YouTube channel to learn step-by-step video tutorials