Managing a call center demands speed, accuracy, and clear visibility into daily operations. However, raw call logs and scattered reports often slow down decision-making. Therefore, businesses increasingly rely on a Call Center Operations Dashboard in Power BI to transform complex call data into clear, actionable insights.
In this in-depth guide, you will learn what a Call Center Operations Dashboard in Power BI is, how it works, its page-wise structure, key advantages, best practices, and common frequently asked questions. Moreover, this article explains how a ready-to-use Power BI dashboard helps call center managers improve efficiency, reduce costs, and enhance customer satisfaction.
Click to Purchases Call Center Operations Dashboard in Power BI
What Is a Call Center Operations Dashboard in Power BI?
A Call Center Operations Dashboard in Power BI is a centralized analytics solution that visually displays call center KPIs using interactive charts, cards, and slicers. Instead of reviewing multiple spreadsheets or static reports, decision-makers can monitor performance from a single Power BI dashboard.
Because Power BI supports real-time refresh, drill-down analysis, and interactive filtering, this dashboard allows managers to analyze call volumes, service quality, costs, and resolution time quickly. As a result, teams can identify issues early and act faster.
Why Do Call Centers Need a Power BI Dashboard?
Call centers generate massive volumes of data every day. However, data alone does not create value. You need insights. Therefore, a Power BI dashboard becomes essential.
Here is why call centers need it:
-
It converts raw call data into meaningful KPIs
-
It provides real-time and historical performance visibility
-
It reduces manual reporting efforts
-
It improves agent accountability and team performance
-
It supports data-driven staffing and budgeting decisions
Moreover, Power BI dashboards ensure consistency across reports and eliminate confusion caused by multiple versions of spreadsheets.
What KPIs Are Commonly Tracked in a Call Center Operations Dashboard?
A well-designed Call Center Operations Dashboard in Power BI focuses on operational, cost, and customer experience metrics.
Common KPIs include:
-
Customer Satisfaction Score (CSAT)
-
Average Call Duration
-
Call Handling Cost
-
Issue Resolved Time
-
Wait Time
-
Calls by Channel
-
Calls by Region
-
Calls by Call Type
Because these KPIs reflect both efficiency and service quality, managers gain a balanced view of performance.
Page-Wise Structure of the Call Center Operations Dashboard in Power BI
This ready-to-use dashboard contains five interactive pages, each designed for a specific level of analysis. Let us explore each page in detail.
1. What Is Shown on the Overview Page?

The Overview Page serves as the main landing page of the dashboard. It provides a quick snapshot of overall call center performance.
Key Features of the Overview Page
-
Interactive slicers for filtering data
-
KPI cards for instant performance visibility
-
High-level charts for trend and comparison analysis
Key Visuals on the Overview Page
-
Customer Satisfaction Score by Agent Name
This chart helps managers identify top-performing and underperforming agents quickly. -
Call Duration by Customer Type
This visual shows how call duration varies across customer categories, such as new customers and existing customers. -
Call Handling Cost by Call Channel
This chart highlights cost differences across channels like phone, email, and chat. -
Call Handling Cost by Region
This visual reveals regional cost variations and supports budget optimization.
Because this page summarizes critical metrics, leadership teams can assess performance within seconds.
2. How Does the Team Analysis Page Help Managers?
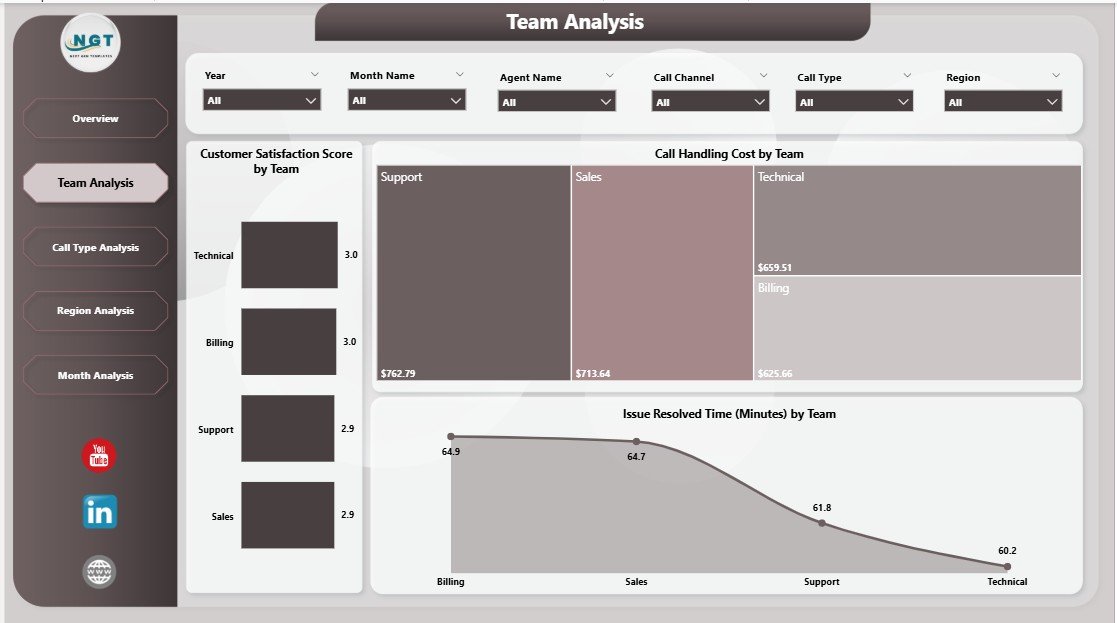
The Team Analysis Page focuses on performance at the team level. Therefore, it helps supervisors compare teams and manage workloads effectively.
Key Visuals on the Team Analysis Page
-
Customer Satisfaction Score by Team
This chart compares service quality across different teams. -
Call Handling Cost by Team
This visual highlights cost efficiency differences among teams. -
Issue Resolved Time by Team
This chart shows how quickly each team resolves customer issues.
As a result, managers can identify high-performing teams and support teams that need improvement.
3. Why Is Call Type Analysis Important?
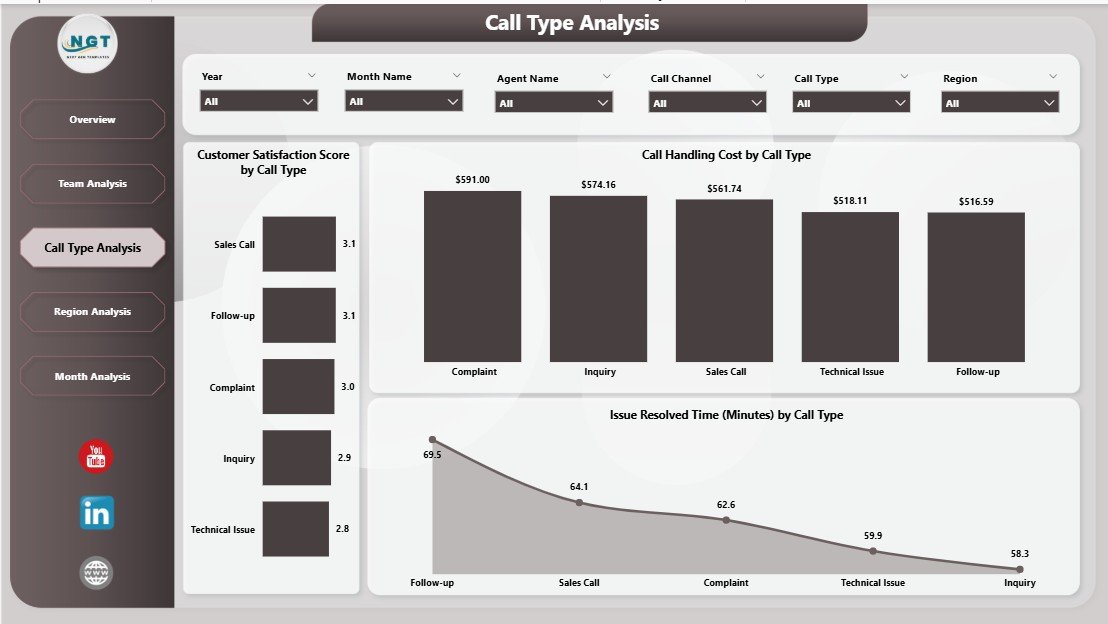
Different call types require different handling strategies. Therefore, the Call Type Analysis Page provides valuable insights into call behavior.
Click to Purchases Call Center Operations Dashboard in Power BI
Key Visuals on the Call Type Analysis Page
-
Customer Satisfaction Score by Call Type
This chart reveals which call types deliver better or worse customer experiences. -
Call Handling Cost by Call Type
This visual helps identify expensive call categories. -
Issue Resolved Time by Call Type
This chart shows resolution efficiency for each call type.
Because of this analysis, call centers can redesign processes for high-cost or slow-resolution call types.
4. What Insights Does the Region Analysis Page Provide?
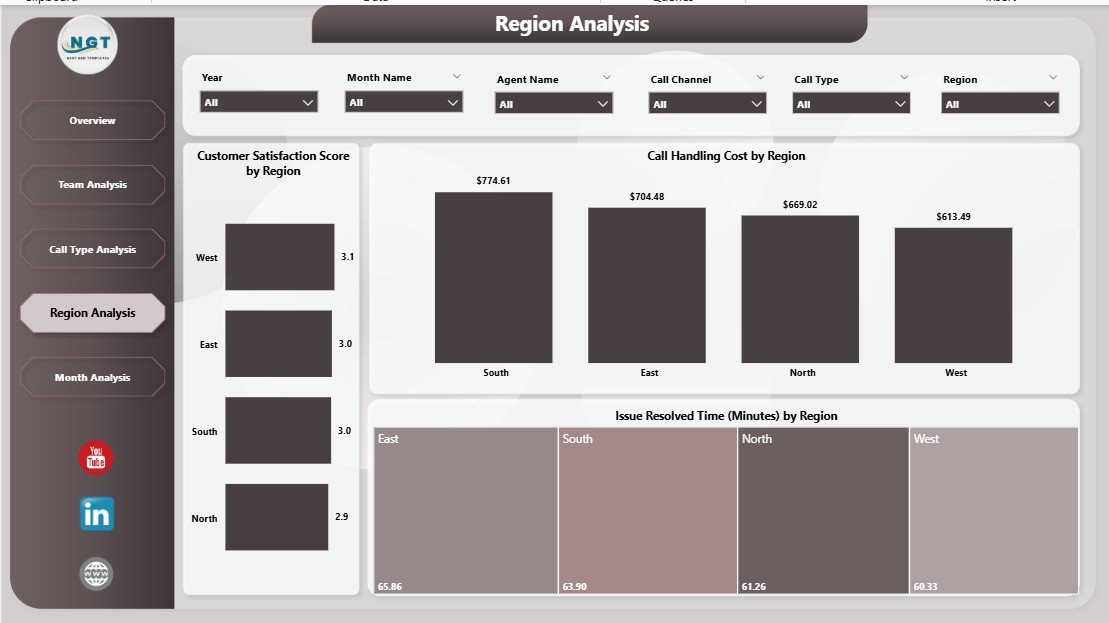
The Region Analysis Page helps organizations manage geographically distributed call centers.
Key Visuals on the Region Analysis Page
-
Customer Satisfaction Score by Region
This chart compares service quality across regions. -
Issue Resolved Time by Region
This visual highlights regional efficiency differences. -
Wait Time by Region
This chart identifies regions with longer customer wait times.
Therefore, managers can allocate resources more effectively and improve regional service levels.
5. How Does the Month Analysis Page Support Trend Tracking?
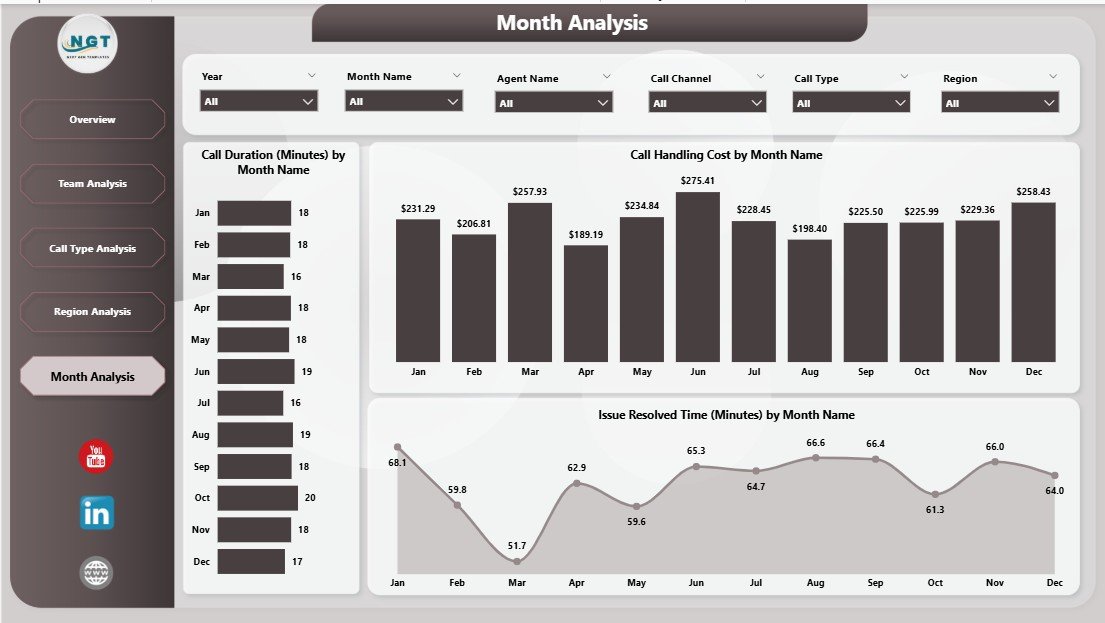
The Month Analysis Page focuses on time-based performance trends. It helps businesses understand seasonality and workload patterns.
Key Visuals on the Month Analysis Page
-
Issue Resolved Time by Month
This chart shows how resolution efficiency changes over time. -
Call Handling Cost by Month
This visual tracks monthly cost fluctuations. -
Call Duration by Month
This chart highlights trends in call length across months.
As a result, organizations can plan staffing, training, and budgets more accurately.
Advantages of Call Center Operations Dashboard in Power BI
Click to Purchases Call Center Operations Dashboard in Power BI
Implementing a Call Center Operations Dashboard in Power BI delivers several business benefits.
1. Centralized Reporting
Power BI consolidates all call center data into one dashboard. Therefore, teams no longer depend on multiple reports.
2. Real-Time Insights
With scheduled refreshes, managers always see updated performance data. As a result, they act faster.
3. Improved Decision-Making
Clear visuals simplify complex data. Therefore, leaders make informed decisions confidently.
4. Enhanced Agent Performance
Transparent performance metrics encourage accountability and continuous improvement.
5. Cost Optimization
Cost-focused visuals help identify inefficiencies and reduce unnecessary spending.
How Does Power BI Improve Call Center Efficiency?
Power BI improves efficiency by automating reporting, enabling drill-down analysis, and reducing manual work. Moreover, interactive slicers allow users to analyze data from multiple perspectives without technical skills.
Because Power BI integrates with various data sources, call centers can combine CRM, telephony, and ticketing data seamlessly.
Best Practices for the Call Center Operations Dashboard in Power BI
To get maximum value, you should follow these best practices.
1. Define Clear KPIs
Always align KPIs with business goals. Avoid tracking too many metrics at once.
2. Use Consistent Naming
Maintain consistent KPI names and definitions across pages. This practice avoids confusion.
3. Design for Simplicity
Keep visuals clean and easy to read. Avoid clutter and unnecessary colors.
4. Use Slicers Wisely
Provide slicers for region, team, agent, and time period. However, do not overload the dashboard.
5. Refresh Data Regularly
Schedule automatic data refreshes to ensure accuracy.
6. Validate Data Quality
Always verify data sources before publishing the dashboard.
Who Can Benefit from a Call Center Operations Dashboard in Power BI?
This dashboard supports multiple stakeholders:
-
Call center managers
-
Team leaders and supervisors
-
Operations managers
-
Finance and cost control teams
-
Senior leadership
Because the dashboard adapts to different roles, each user gains relevant insights.
How Does This Dashboard Support Business Growth?
When organizations understand customer issues, cost drivers, and performance gaps, they improve service quality. Moreover, better service leads to higher customer retention and brand loyalty.
Therefore, a Call Center Operations Dashboard in Power BI directly contributes to long-term growth.
Conclusion
A Call Center Operations Dashboard in Power BI transforms raw call data into actionable intelligence. With its five structured pages—Overview, Team Analysis, Call Type Analysis, Region Analysis, and Month Analysis—it delivers complete operational visibility.
Because Power BI offers interactivity, scalability, and automation, this dashboard empowers call centers to improve efficiency, control costs, and enhance customer satisfaction. In today’s competitive service environment, adopting such a dashboard is no longer optional—it is essential.
Frequently Asked Questions (FAQs)
What is a Call Center Operations Dashboard in Power BI?
A Call Center Operations Dashboard in Power BI is an interactive reporting tool that visualizes call center KPIs such as customer satisfaction, call duration, costs, and resolution time.
Which KPIs should a call center track in Power BI?
A call center should track KPIs like Customer Satisfaction Score, Call Duration, Call Handling Cost, Issue Resolved Time, and Wait Time.
Can Power BI handle large call center datasets?
Yes, Power BI handles large datasets efficiently and supports scheduled refresh and optimized data models.
Is this dashboard suitable for small call centers?
Yes, both small and large call centers can use this dashboard because it scales easily.
How often should the dashboard data refresh?
Ideally, the dashboard should refresh daily or in near real-time, depending on business needs.
Does this dashboard require technical expertise to use?
No, Power BI dashboards are user-friendly. Managers can use slicers and visuals without technical skills.
Can this dashboard integrate with CRM systems?
Yes, Power BI integrates seamlessly with most CRM and call management systems.
Visit our YouTube channel to learn step-by-step video tutorials