Managing facility services today is no longer about reacting to issues after they occur. Instead, it is about tracking performance, controlling costs, meeting service-level agreements, and improving customer satisfaction in a structured and data-driven way. That is exactly where a Facility Services Dashboard in Excel becomes a powerful and practical solution.
In this article, we will explore how a ready-to-use Facility Services Dashboard in Excel can transform the way facility managers, operations teams, and decision-makers monitor and improve service performance. We will walk through its structure, features, benefits, best practices, and real-world use cases in detail. Moreover, we will also explain how each dashboard page delivers actionable insights without complexity.
Click to Purchases Facility Services Dashboard in Excel
What Is a Facility Services Dashboard in Excel?
A Facility Services Dashboard in Excel is a centralized analytical tool that visually tracks and summarizes all key facility management metrics in one place. It helps organizations monitor service efficiency, service costs, delays, service completion time, SLA adherence, customer satisfaction, and priority-based service distribution.
Instead of working with scattered spreadsheets, emails, and manual reports, this dashboard brings all facility service data together. As a result, decision-makers can quickly understand what is working, what needs attention, and where improvements are required.
Most importantly, Excel makes this solution accessible. Since many organizations already use Excel daily, this dashboard does not require complex software or advanced technical skills.
Why Use a Facility Services Dashboard in Excel?
Facility operations involve multiple moving parts. Services vary by facility type, service type, region, and time. Without structured reporting, teams struggle to identify delays, rising costs, or SLA breaches.
A Facility Services Dashboard in Excel solves this problem by:
-
Providing real-time visibility into facility service performance
-
Reducing manual reporting effort
-
Improving accountability across teams
-
Supporting data-driven decision-making
-
Enhancing customer satisfaction
Because Excel supports slicers, charts, and interactive navigation, users can analyze data dynamically and quickly.
Overview of the Facility Services Dashboard Structure

This Facility Services Dashboard in Excel is a ready-to-use solution designed with clarity and usability in mind. It contains five analytical pages, a page navigator, and structured support and data sheets.
Page Navigator for Easy Navigation
The Page Navigator, located on the left side of the dashboard, allows users to switch between analytical pages effortlessly. This feature saves time and ensures a smooth user experience, especially when presenting insights to stakeholders.
Overview Page: What Insights Does the Main Dashboard Provide?
The Overview Page acts as the command center of the Facility Services Dashboard. It gives a quick snapshot of overall service performance across the organization.
Key Elements of the Overview Page
On the right-side slicer, users can filter data by relevant dimensions such as service type, region, facility type, or month. This filtering instantly updates all charts and metrics.
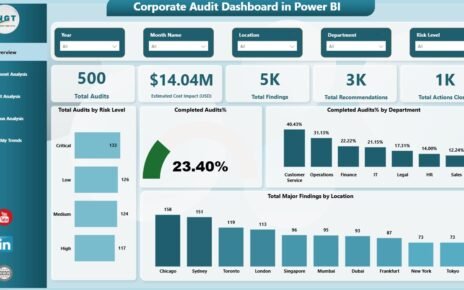
KPI Cards on the Overview Page
The dashboard includes four KPI cards, which highlight critical performance indicators:
-
Delay Service % – Shows the percentage of services completed later than expected
-
Average Actual Completion Hours – Displays the average time taken to complete services
-
High Priority Service Count – Highlights urgent and critical service requests
-
Total Service Cost – Summarizes overall facility service spending
These KPI cards give immediate clarity on performance health.
Charts on the Overview Page
The Overview Page includes four powerful charts:
-
Delay Service % – Identifies how often services miss deadlines
-
Average Actual Completion Hours by Service Status – Compares completion time across service states
-
High Priority Service by Region – Shows regional distribution of urgent services
-
Service Cost by Service Type – Breaks down spending by service category
Together, these insights help managers identify inefficiencies at a glance.
Click to Purchases Facility Services Dashboard in Excel
Facility Type Analysis: How Do Different Facilities Perform?

Facility operations vary significantly depending on facility type. Therefore, analyzing performance at this level is essential.
Purpose of the Facility Type Analysis Page
The Facility Type Analysis page helps users understand how different facility categories perform in terms of cost, SLA, and service efficiency.
Charts Included in Facility Type Analysis
This page contains four focused charts:
-
Service Cost by Facility Type – Identifies cost-heavy facility categories
-
Average SLA Hours by Facility Type – Shows expected service completion timelines
-
Average Actual Completion Hours by Facility Type – Compares planned versus actual performance
-
High Priority Service % by Facility Type – Highlights facilities with frequent urgent requests
As a result, facility managers can allocate resources more effectively.
Service Type Analysis: Which Services Need Attention?

Not all services behave the same way. Some services naturally take longer or cost more. Therefore, analyzing service performance by service type becomes critical.
Insights from Service Type Analysis Page
The Service Type Analysis page focuses on performance trends across different service categories such as maintenance, cleaning, security, or repairs.
Charts on Service Type Analysis Page
This page includes:
-
Average SLA Hours by Service Type – Shows expected service timelines
-
Average Actual Completion Hours by Service Type – Highlights delays or efficiency
-
High Priority Service by Service Type – Identifies services that frequently escalate
-
Delay Service % by Service Type – Reveals bottlenecks in service delivery
With these insights, teams can improve service planning and vendor coordination.
Click to Purchases Facility Services Dashboard in Excel
Region Analysis: How Do Regions Compare in Service Performance?

Facility service challenges often differ by location. That is why regional analysis plays a vital role in facility management.
Objective of the Region Analysis Page
The Region Analysis page enables organizations to compare service performance across geographic regions.
Charts Included in Region Analysis
This page contains four charts:
-
Service Cost by Region – Identifies high-cost regions
-
Average Customer Satisfaction Rating by Region – Measures service quality perception
-
High Priority Service % by Region – Highlights regions with frequent urgent requests
-
Delay Service % by Region – Shows regional SLA performance
By analyzing these trends, leadership can take corrective actions where needed.
Month Analysis: How Does Performance Change Over Time?

Tracking trends over time helps organizations move from reactive to proactive facility management.
Why Month Analysis Matters
The Month Analysis page shows how service performance evolves month by month, enabling trend analysis and forecasting.
Charts on the Month Analysis Page
This page includes:
-
Service Cost by Month – Tracks spending patterns
-
Average Customer Satisfaction Rating by Month – Measures service quality trends
-
High Priority Service % by Month – Identifies seasonal spikes
-
Average Actual Completion Hours by Month – Highlights operational efficiency changes
These insights help teams plan budgets, staffing, and preventive maintenance.
Data Sheet and Support Sheet: Why Are They Important?
Behind every powerful dashboard lies structured data.
Data Sheet
The Data Sheet stores raw facility service records, including service details, timelines, costs, priorities, regions, and ratings. Since the dashboard relies on this data, maintaining accuracy here ensures reliable insights.
Support Sheet
The Support Sheet helps manage dropdowns, slicers, and reference data. It improves dashboard stability and simplifies maintenance.
Advantages of Facility Services Dashboard in Excel
Click to Purchases Facility Services Dashboard in Excel
Using a Facility Services Dashboard in Excel offers several strong advantages.
Key Advantages
-
Centralized view of all facility services
-
Faster decision-making through visual insights
-
Improved SLA compliance tracking
-
Better control over service costs
-
Easy customization without advanced tools
-
Familiar Excel environment for users
Because Excel supports interactivity, users can explore data without technical barriers.
Opportunities for Improvement Using the Dashboard
Although the dashboard provides strong insights, organizations can further enhance performance by acting on these insights.
Improvement Opportunities
-
Reduce delay percentages by optimizing workflows
-
Balance workload across regions and facilities
-
Improve vendor performance using SLA tracking
-
Enhance customer satisfaction through trend analysis
-
Control costs by identifying high-expense services
When teams use the dashboard consistently, improvement becomes measurable and sustainable.
Best Practices for the Facility Services Dashboard in Excel
To get maximum value from the dashboard, organizations should follow proven best practices.
Best Practices to Follow
-
Update the data sheet regularly
-
Validate service timelines and costs
-
Use slicers to analyze specific scenarios
-
Review trends monthly, not just totals
-
Share dashboard insights with stakeholders
-
Maintain clear definitions for KPIs
By following these practices, teams ensure accuracy and long-term usability.
Who Can Benefit from a Facility Services Dashboard in Excel?
This dashboard serves a wide range of users.
Ideal Users
-
Facility managers
-
Operations teams
-
Service coordinators
-
Maintenance supervisors
-
Regional managers
-
Senior leadership
Since the dashboard presents data visually, even non-technical users can understand insights quickly.
How Does This Dashboard Support Strategic Decision-Making?
Strategic decisions require reliable data. This dashboard supports strategy by:
-
Highlighting inefficiencies
-
Supporting budget planning
-
Improving vendor negotiations
-
Enhancing service quality
-
Aligning operations with business goals
Therefore, the dashboard becomes more than a reporting tool—it becomes a decision-support system.
Conclusion: Why a Facility Services Dashboard in Excel Is a Must-Have
A Facility Services Dashboard in Excel empowers organizations to manage services with clarity, control, and confidence. It transforms raw service data into actionable insights across facilities, services, regions, and time.
By using this ready-to-use dashboard, teams can reduce delays, optimize costs, improve customer satisfaction, and meet SLAs more effectively. Moreover, Excel ensures accessibility, flexibility, and ease of use.
If your organization aims to modernize facility management without complexity, this dashboard offers a practical and powerful solution.
Frequently Asked Questions About Facility Services Dashboard in Excel
What is the main purpose of a Facility Services Dashboard in Excel?
The main purpose is to track, analyze, and improve facility service performance using visual and interactive insights.
Can this dashboard handle large volumes of data?
Yes, Excel can handle large datasets efficiently when structured properly and updated regularly.
Is technical knowledge required to use the dashboard?
No, the dashboard uses standard Excel features, making it easy for non-technical users.
Can the dashboard be customized?
Yes, users can customize charts, KPIs, slicers, and layouts to match business needs.
How often should the data be updated?
Ideally, teams should update the data weekly or monthly to maintain accuracy.
Does this dashboard support decision-making?
Yes, it provides actionable insights that support both operational and strategic decisions.
Visit our YouTube channel to learn step-by-step video tutorials