Spas and wellness centres focus on delivering relaxation, care, and premium experiences. However, behind the scenes, managers must track performance, control costs, improve customer satisfaction, and grow revenue. When teams rely on manual reports or scattered Excel files, performance issues remain hidden.
That is exactly where a Spas and Wellness Centres KPI Dashboard in Power BI creates a strong competitive advantage.
In this detailed guide, you will learn what a Spas and Wellness Centres KPI Dashboard in Power BI is, why it matters, how it works, its key features, advantages, best practices, and frequently asked questions. By the end of this article, you will clearly understand how this ready-to-use Power BI dashboard helps spa and wellness businesses make faster, smarter, and data-driven decisions.
Click to Purchases Spas and Wellness Centres KPI Dashboard in Power BI
What Is a Spas and Wellness Centres KPI Dashboard in Power BI?
A Spas and Wellness Centres KPI Dashboard in Power BI is an interactive analytics solution designed to track, compare, and visualize key performance indicators for spa and wellness operations.
Instead of reviewing multiple reports, managers can monitor all KPIs from a single dashboard, including:
-
Operational performance
-
Service efficiency
-
Target achievement
-
Month-to-date (MTD) trends
-
Year-to-date (YTD) performance
-
Previous year comparisons
Because Power BI powers this dashboard, users gain dynamic filtering, drill-through analysis, and interactive visuals that update instantly.
Why Do Spas and Wellness Centres Need a KPI Dashboard?
Spas and wellness centres operate in a fast-moving service environment. Therefore, delayed insights directly impact revenue and customer satisfaction.
A KPI Dashboard in Power BI helps because it:
-
Centralizes all KPIs in one place
-
Highlights target achievement and misses instantly
-
Compares current performance with previous year results
-
Supports proactive decision-making
-
Improves transparency across teams
As a result, spa managers gain clarity instead of assumptions.
How Does a Spas and Wellness Centres KPI Dashboard in Power BI Work?
This ready-to-use dashboard uses Excel as the data source and Power BI as the visualization layer. You enter data in structured Excel sheets, and Power BI transforms that data into meaningful insights.
The dashboard contains three interactive pages, each designed for a specific analytical purpose.
Click to Purchases Spas and Wellness Centres KPI Dashboard in Power BI
What Are the Key Pages in the Spas and Wellness Centres KPI Dashboard in Power BI?
1. Summary Page: How Can You Monitor All KPIs at Once?
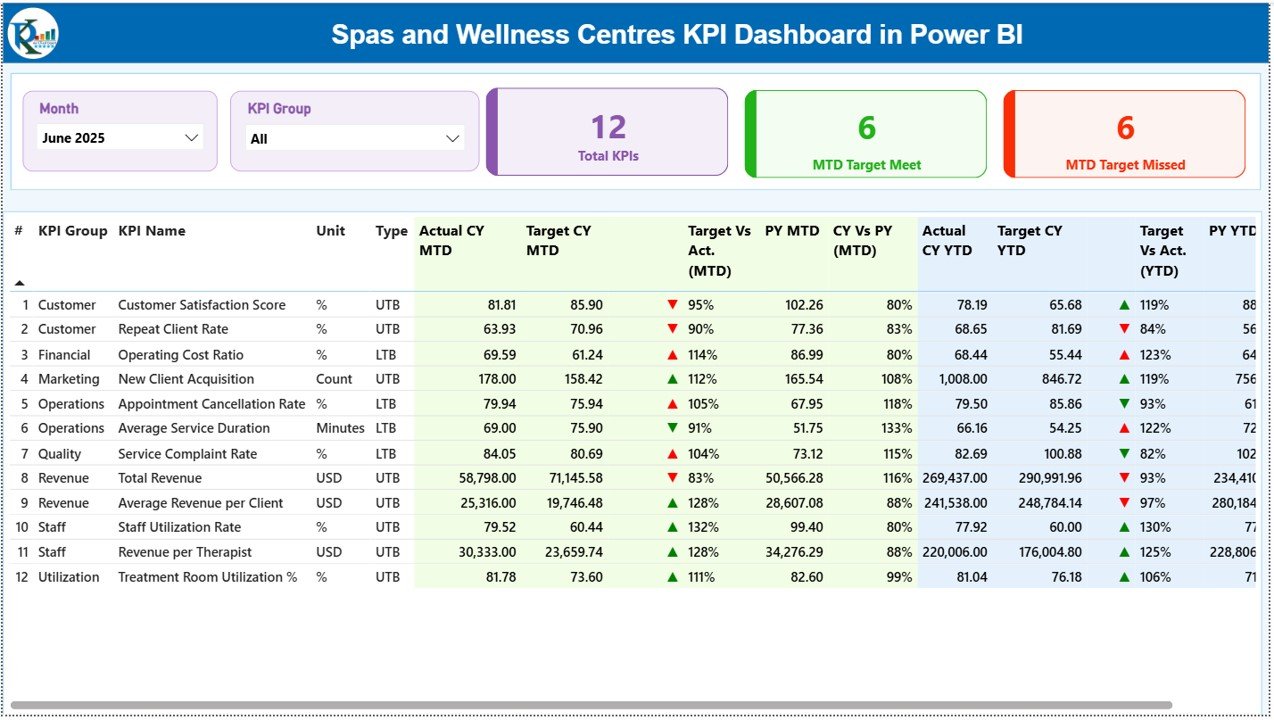
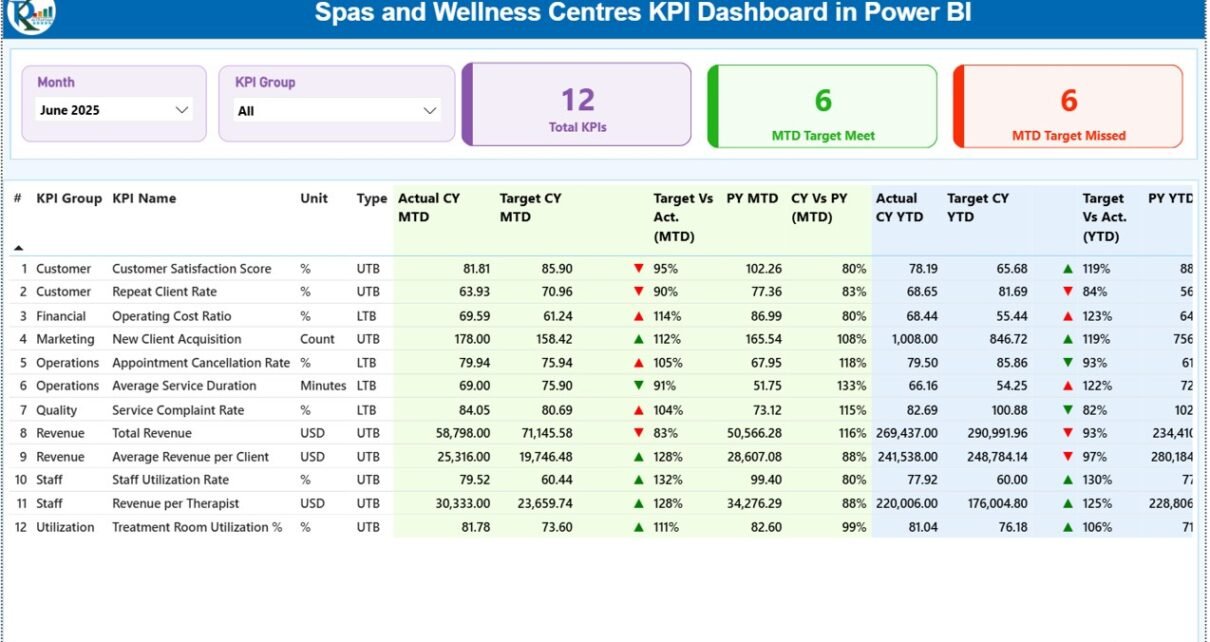
The Summary Page acts as the main interface of the dashboard. It provides a high-level overview of KPI performance across the spa or wellness centre.
What Filters Are Available on the Summary Page?
-
Month Slicer – Analyze performance for a selected month
-
KPI Group Slicer – Filter KPIs by category
These slicers allow instant focus on specific areas.
What KPI Summary Cards Are Displayed?
At the top of the page, the dashboard displays three key KPI cards:
-
Total KPIs Count – Total number of KPIs tracked
-
MTD Target Meet Count – KPIs meeting targets
-
MTD Target Missed Count – KPIs missing targets
These cards give an immediate snapshot of performance health.
What Information Does the Detailed KPI Table Show?
Below the cards, the dashboard displays a detailed KPI table with complete performance metrics.
Columns Included in the KPI Table
-
KPI Number – Sequential identifier
-
KPI Group – KPI category
-
KPI Name – Name of the KPI
-
Unit – Unit of measurement
-
Type – LTB (Lower the Better) or UTB (Upper the Better)
How Are MTD Metrics Displayed?
For Month-to-Date (MTD) analysis, the table includes:
-
Actual CY MTD – Current year actual MTD value
-
Target CY MTD – Current year target MTD value
-
MTD Icon – Green ▲ or red ▼ icon indicating KPI status
-
Target vs Actual (MTD) – Actual ÷ Target percentage
-
PY MTD – Previous year MTD value
-
CY vs PY (MTD) – Current vs previous year comparison
These metrics help managers evaluate short-term performance quickly.
How Are YTD Metrics Displayed?
For Year-to-Date (YTD) analysis, the table includes:
-
Actual CY YTD – Current year actual YTD value
-
Target CY YTD – Current year target YTD value
-
YTD Icon – Green ▲ or red ▼ indicator
-
Target vs Actual (YTD) – Actual ÷ Target percentage
-
PY YTD – Previous year YTD value
-
CY vs PY (YTD) – Year-over-year comparison
Therefore, managers gain both short-term and long-term visibility.
Click to Purchases Spas and Wellness Centres KPI Dashboard in Power BI
2. KPI Trend Page: How Can You Analyze KPI Performance Over Time?
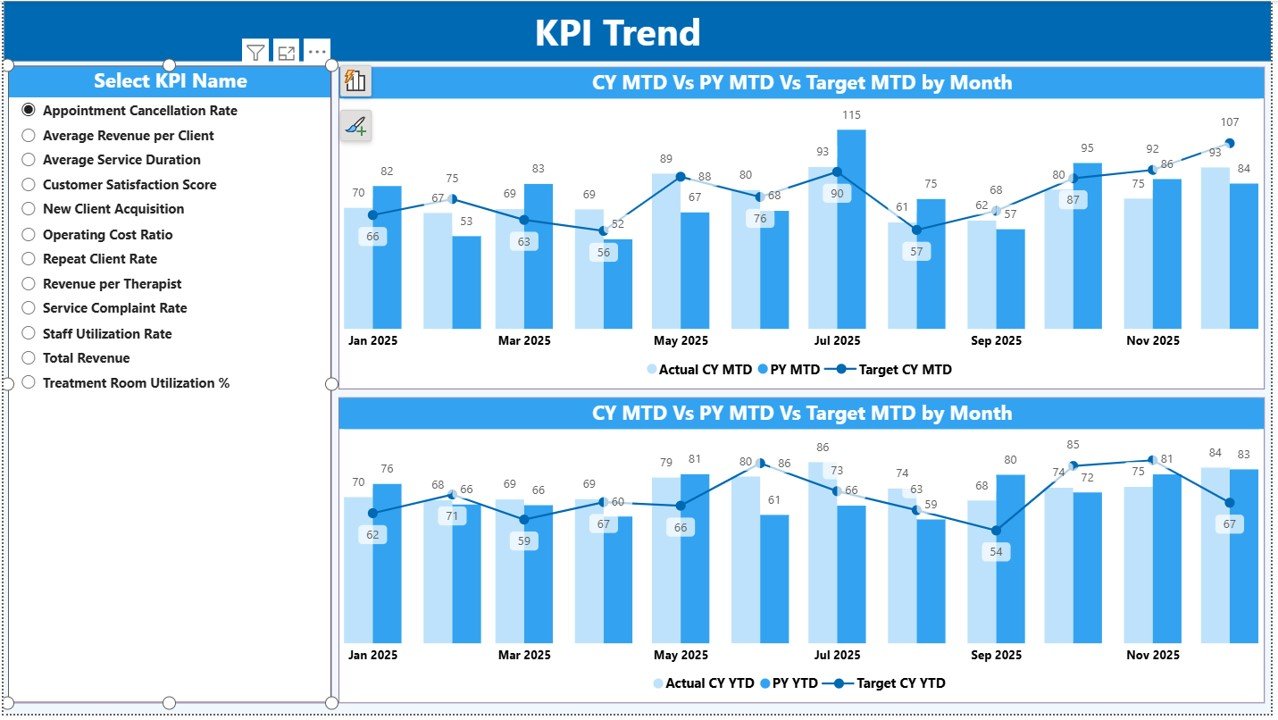
The KPI Trend Page focuses on deep performance analysis for individual KPIs.
How Do You Select a KPI?
-
Use the KPI Name slicer on the left
-
Select a specific KPI to update all visuals instantly
What Charts Are Shown on the KPI Trend Page?
This page includes two combo charts:
MTD Trend Chart
-
Actual numbers for current year
-
Target values
-
Previous year values
YTD Trend Chart
-
Actual numbers for current year
-
Target values
-
Previous year values
These charts help managers understand trends, seasonality, and growth patterns.
3. KPI Definition Page: How Do You Understand KPI Logic?
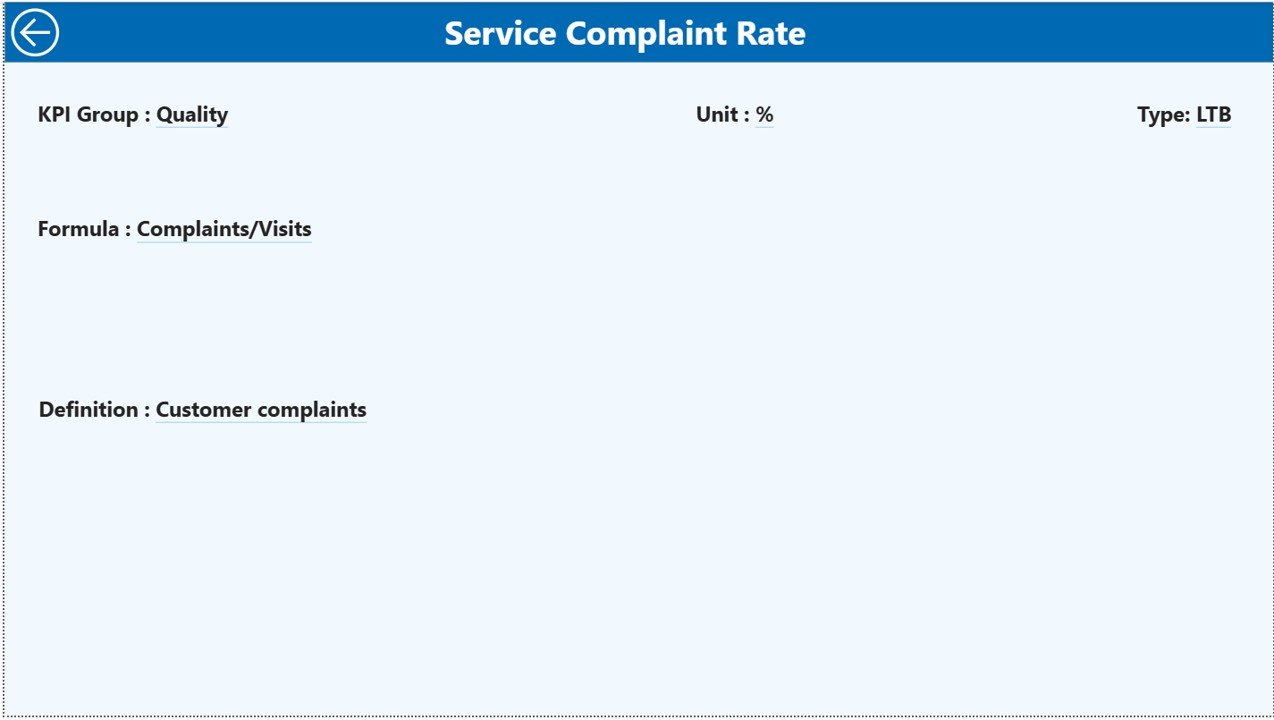
The KPI Definition Page is a hidden drill-through page that provides KPI documentation.
What Information Does the KPI Definition Page Show?
-
KPI Formula
-
KPI Definition
-
KPI Type (LTB or UTB)
-
KPI Unit
From the Summary Page, users can drill through to this page to understand KPI logic clearly.
To return to the main page, simply click the Back button on the top left.
Click to Purchases Spas and Wellness Centres KPI Dashboard in Power BI
How Does the Excel Data Source Work?
The dashboard uses an Excel file as the data source. This design makes data entry simple and business-friendly.
1. Input_Actual Sheet: Where Do You Enter Actual Data?
In the Input_Actual sheet, you enter:
-
KPI Name
-
Month (use the first date of the month)
-
MTD actual value
-
YTD actual value
This sheet captures real performance data.
2. Input_Target Sheet: Where Do You Define Targets?
In the Input_Target sheet, you enter:
-
KPI Name
-
Month (first date of the month)
-
MTD target value
-
YTD target value
Targets allow meaningful performance comparison.
3. KPI Definition Sheet: How Do You Maintain KPI Consistency?
In the KPI Definition sheet, you enter:
-
KPI Number
-
KPI Group
-
KPI Name
-
Unit
-
Formula
-
Definition
-
KPI Type (LTB or UTB)
This structure ensures standardized KPI measurement.
What KPIs Can Spas and Wellness Centres Track?
This dashboard supports a wide range of KPIs, including:
-
Revenue per treatment
-
Customer satisfaction score
-
Appointment utilization rate
-
Therapist productivity
-
Repeat customer rate
-
Cancellation rate
-
Average service duration
-
Membership growth
-
Target achievement percentage
Therefore, the dashboard adapts to different spa business models.
Click to Purchases Spas and Wellness Centres KPI Dashboard in Power BI
Advantages of Spas and Wellness Centres KPI Dashboard in Power BI
Using this Power BI dashboard offers several powerful advantages.
Key Advantages Include:
-
Centralized KPI monitoring
-
Interactive slicers and drill-through
-
Clear MTD and YTD analysis
-
Target vs Actual visibility
-
Previous year performance comparison
-
Reduced manual reporting effort
-
Faster and smarter decision-making
As a result, spa managers gain full control over performance.
How Does This Dashboard Improve Business Decisions?
Because the dashboard highlights gaps instantly:
-
Managers act before issues escalate
-
Teams align with clear goals
-
Resources get allocated effectively
-
Customer experience improves consistently
Therefore, decisions become proactive instead of reactive.
Who Should Use a Spas and Wellness Centres KPI Dashboard in Power BI?
This dashboard is ideal for:
-
Spa owners
-
Wellness centre managers
-
Operations managers
-
Performance analysts
-
Finance teams
-
Multi-location spa operators
If you track spa performance, this tool delivers immediate value.
Best Practices for Using the Spas and Wellness Centres KPI Dashboard in Power BI
Follow these best practices to maximize results.
1. Keep Data Updated Monthly
Fresh data ensures accurate insights.
2. Review Target Misses First
Focus on KPIs marked with red ▼ icons.
3. Use Trend Analysis Regularly
Trends reveal patterns that single numbers hide.
4. Maintain KPI Definitions Clearly
Clear definitions avoid confusion across teams.
5. Share Insights with Teams
Transparency improves accountability and motivation.
6. Use One Excel Source File
A single source prevents data inconsistency.
How Is This Better Than Traditional Reporting?
Traditional reports lack interactivity and arrive late. However, this Power BI dashboard:
-
Updates instantly
-
Supports filtering and drill-down
-
Reduces reporting time
-
Improves insight quality
As a result, it replaces static reports with dynamic analytics.
Click to Purchases Spas and Wellness Centres KPI Dashboard in Power BI
Conclusion: Why Use a Spas and Wellness Centres KPI Dashboard in Power BI?
A Spas and Wellness Centres KPI Dashboard in Power BI transforms raw KPI data into actionable insights. Instead of guessing performance, managers gain clarity across MTD, YTD, and year-over-year comparisons.
Because this dashboard combines Excel data entry with Power BI analytics, it supports smarter decisions, stronger accountability, and sustainable business growth.
If your goal involves improving spa performance, controlling targets, and enhancing customer experience, this Power BI KPI dashboard becomes an essential solution.
Frequently Asked Questions (FAQs)
1. What is a Spas and Wellness Centres KPI Dashboard in Power BI?
It is a Power BI dashboard that tracks and analyzes spa KPIs using Excel data.
2. Can I customize KPIs?
Yes, you can add or modify KPIs easily through the Excel source.
3. Does it support MTD and YTD analysis?
Yes, the dashboard supports both MTD and YTD comparisons.
4. Can I compare with previous year performance?
Yes, the dashboard includes CY vs PY analysis.
5. Is Power BI experience required?
Only basic Power BI navigation knowledge is sufficient.
6. Is it suitable for multi-location spas?
Yes, it works for single and multi-location wellness centres.
7. Does it improve profitability?
Yes, because better insights lead to better operational decisions.
Click to Purchases Spas and Wellness Centres KPI Dashboard in Power BI
Visit our YouTube channel to learn step-by-step video tutorials