Business transformation is no longer a one-time initiative. Instead, it is a continuous journey that organizations must manage, measure, and improve. Because transformation programs involve strategy, people, processes, and technology, leaders need a clear and reliable way to track progress. This is exactly where a Business Transformation KPI Dashboard in Power BI plays a critical role.
A Business Transformation KPI Dashboard in Power BI gives decision-makers a structured, visual, and data-driven view of transformation performance. Instead of relying on scattered reports and manual tracking, teams can monitor key performance indicators in real time. As a result, organizations stay aligned, focused, and accountable throughout the transformation journey.
In this detailed guide, you will learn what a Business Transformation KPI Dashboard in Power BI is, why organizations need it, how it works, how each dashboard page adds value, and how to use it effectively. Moreover, you will explore its advantages, best practices, and frequently asked questions.
Click to buy Business Transformation KPI Dashboard in Power BI
What Is a Business Transformation KPI Dashboard in Power BI?
A Business Transformation KPI Dashboard in Power BI is an interactive analytics solution designed to track and visualize transformation-related performance indicators in one centralized place.
Instead of managing multiple Excel files, emails, and static presentations, this dashboard consolidates all transformation KPIs into a single Power BI report. Consequently, leadership teams gain instant clarity on progress, gaps, and risks.
This dashboard typically tracks:
- Transformation KPIs by category or group
- Month-to-date (MTD) and year-to-date (YTD) performance
- Target vs actual comparisons
- Current year vs previous year analysis
- KPI trends over time
Because Power BI supports slicers, drill-through, and dynamic visuals, users can interact with the data easily. Therefore, they can move from high-level summaries to detailed insights within seconds.
Why Do Organizations Need a Business Transformation KPI Dashboard?
Business transformation initiatives often fail due to poor tracking, unclear ownership, and delayed decision-making. However, a well-designed KPI dashboard changes this situation completely.
Key Reasons Organizations Use This Dashboard
- It provides real-time visibility into transformation progress
- It aligns KPIs with strategic objectives
- It highlights target achievements and misses instantly
- It supports data-driven decision-making
- It improves accountability across teams
Moreover, when leaders track transformation KPIs consistently, they can identify issues early. As a result, they can correct course before small problems turn into major failures.
How Does the Business Transformation KPI Dashboard in Power BI Work?
This dashboard works by combining Power BI visuals with Excel-based data input. Because of this approach, organizations can maintain flexibility while still enjoying advanced analytics.
Data Flow Overview
- Users enter actual and target data in Excel
- Power BI connects to the Excel file as a data source
- Measures calculate MTD, YTD, and comparison metrics
- Visuals display results dynamically using slicers and icons
Since Excel remains the input layer, business users can update data easily. Meanwhile, Power BI handles calculations, comparisons, and visualizations automatically.
Dashboard Structure: Pages Explained in Detail
The Business Transformation KPI Dashboard in Power BI includes three well-structured pages. Each page serves a specific purpose and supports different analytical needs.
What Does the Summary Page Show?
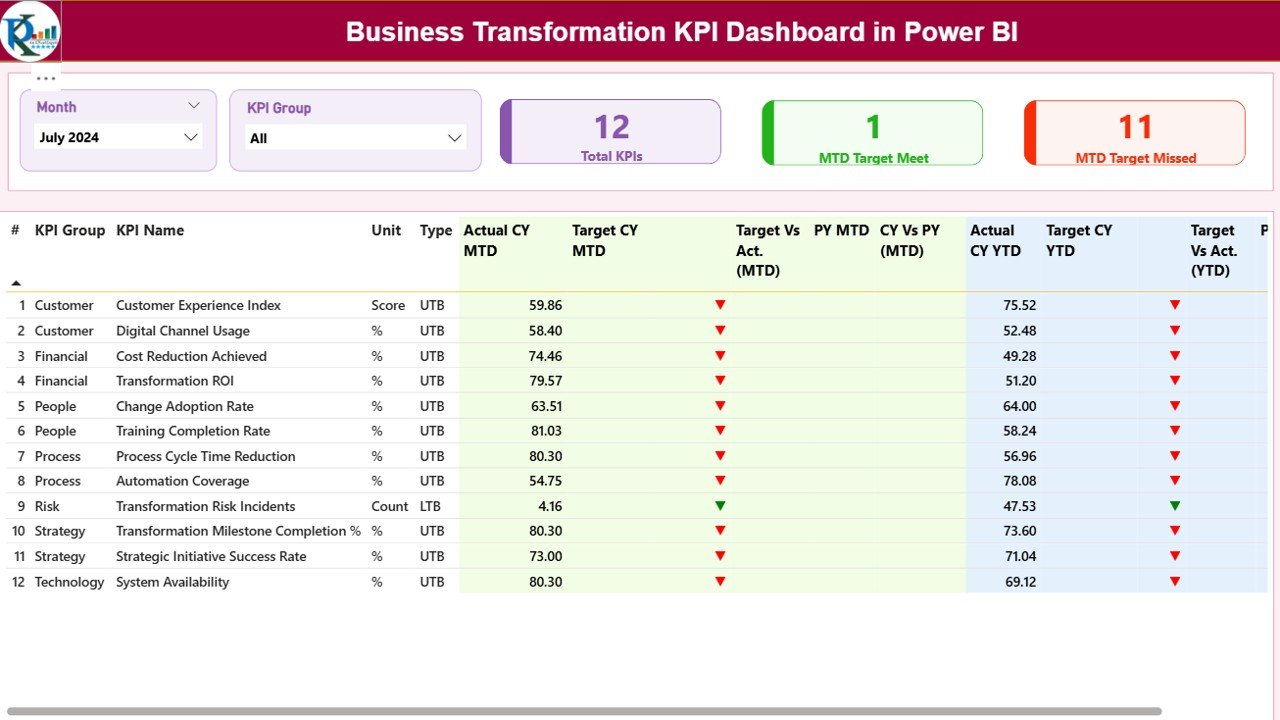
The Summary Page is the main landing page of the dashboard. It provides a high-level snapshot of transformation performance.
Top Section: Filters and KPI Cards
At the top of the page, you will find:
- Month slicer to select the reporting month
- KPI Group slicer to filter by transformation category
These slicers instantly update all visuals on the page. Therefore, users can focus on specific time periods or transformation areas.
KPI Cards Display
The summary page includes three important KPI cards:
- Total KPIs Count
- MTD Target Met Count
- MTD Target Missed Count
These cards help leadership quickly understand overall performance. As a result, they can assess success levels without scanning large tables.
What Information Does the Detailed KPI Table Contain?
Below the cards, the summary page displays a detailed KPI performance table. This table forms the analytical backbone of the dashboard.
KPI Table Columns Explained
- KPI Number – Sequential identifier of the KPI
- KPI Group – Category of the KPI
- KPI Name – Name of the KPI
- Unit – Measurement unit
- Type – LTB (Lower the Better) or UTB (Upper the Better)
MTD Performance Metrics
- Actual CY MTD – Current year actual MTD value
- Target CY MTD – Current year target MTD value
- MTD Icon – Red ▼ or green ▲ indicator
- Target vs Actual (MTD) – Actual ÷ Target percentage
- PY MTD – Previous year MTD value
- CY vs PY (MTD) – Current vs previous year comparison
YTD Performance Metrics
- Actual CY YTD – Current year actual YTD value
- Target CY YTD – Current year target YTD value
- YTD Icon – Red ▼ or green ▲ indicator
- Target vs Actual (YTD) – Actual ÷ Target percentage
- PY YTD – Previous year YTD value
- CY vs PY (YTD) – Current vs previous year comparison
Because icons and percentages appear together, users can interpret performance instantly.
Why Are MTD and YTD Metrics Important?
MTD and YTD metrics provide different but complementary insights.
- MTD metrics show short-term performance
- YTD metrics reveal long-term progress
When organizations analyze both, they avoid short-sighted decisions. Instead, they balance quick wins with sustainable transformation.
Click to buy Business Transformation KPI Dashboard in Power BI
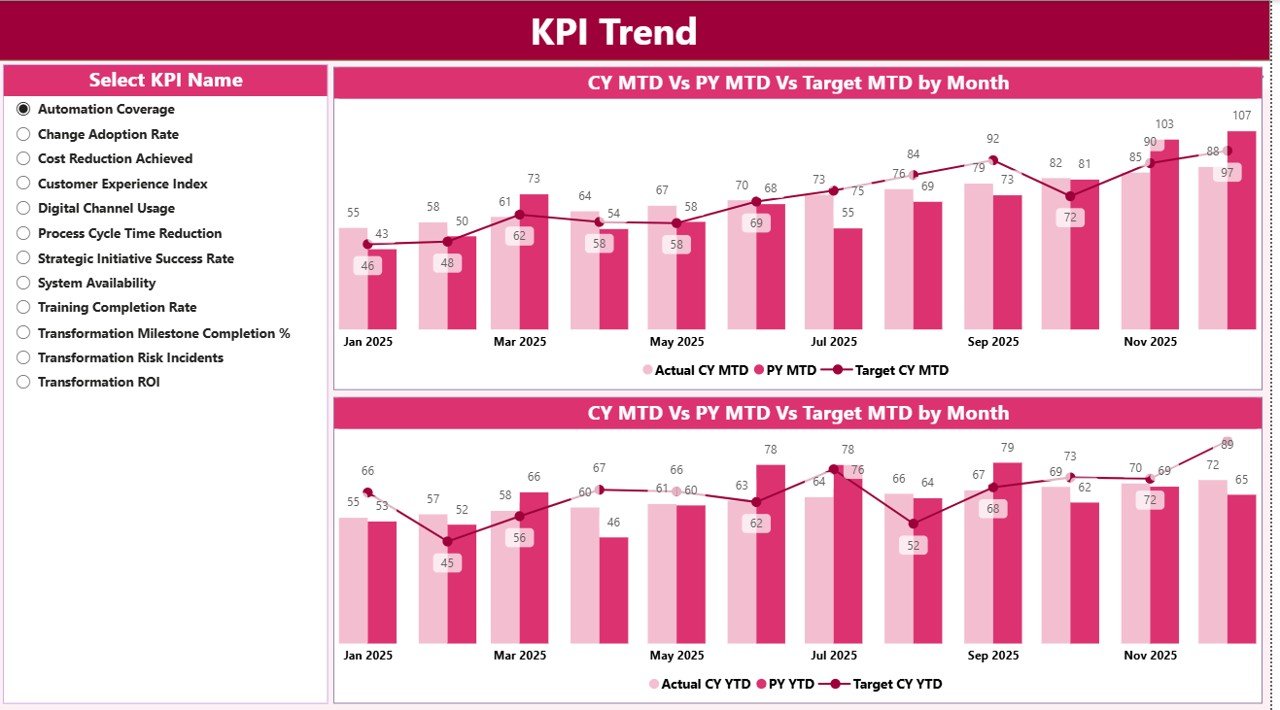
KPI Trend
The KPI Trend Page focuses on performance over time. It helps users understand patterns rather than just snapshots.
Visuals on the KPI Trend Page
This page includes two combo charts:
- MTD trend chart
- YTD trend chart
Each chart displays:
- Current year actual values
- Previous year actual values
- Target values
KPI Selection Slicer
A slicer on the left allows users to select a specific KPI. As soon as they select a KPI, both charts update automatically.
Therefore, users can analyze trends for any KPI without changing pages or filters.
Click to buy Business Transformation KPI Dashboard in Power BI
Why Is Trend Analysis Critical for Transformation?
Trend analysis reveals whether performance improves, declines, or remains stagnant. As a result, leaders can:
- Identify early warning signs
- Validate improvement initiatives
- Adjust strategies proactively
Without trend analysis, organizations only react. However, with trends, they act ahead of time.
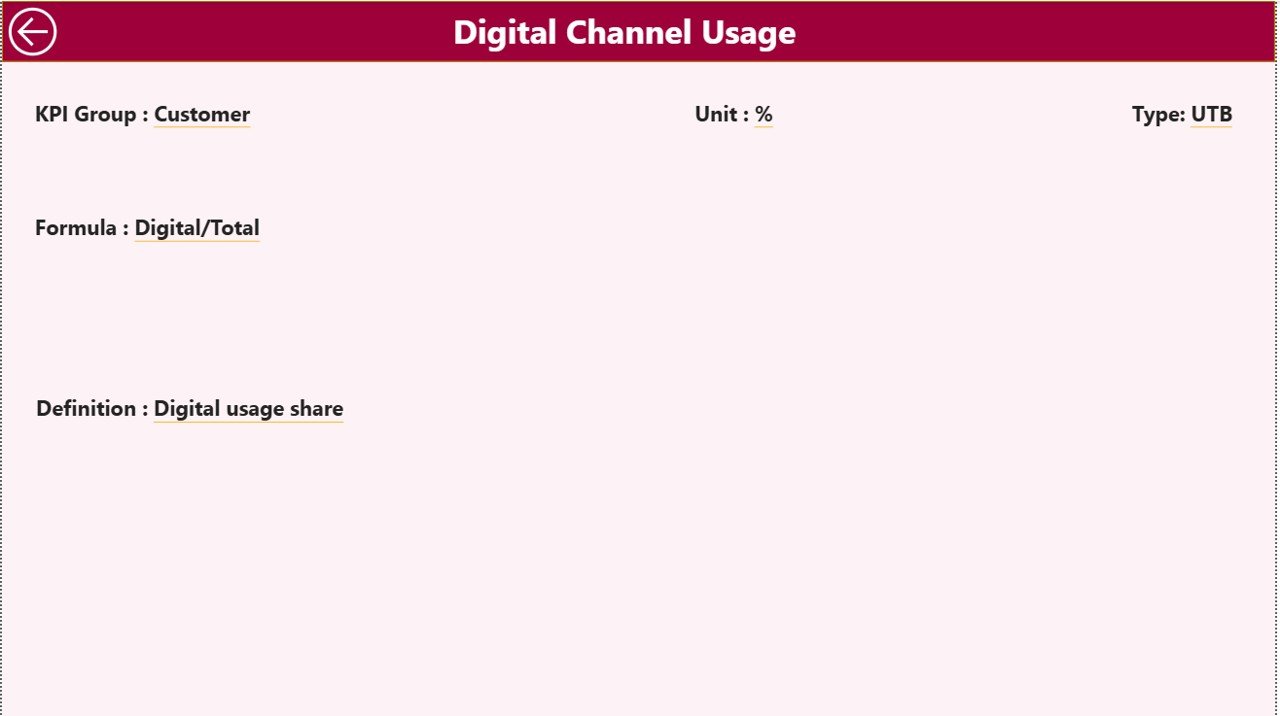
KPI Definition Page
The KPI Definition Page is a hidden drill-through page. It provides detailed KPI documentation.
Information Available on This Page
- KPI Formula
- KPI Definition
- KPI Unit
- KPI Type (LTB or UTB)
Users can drill through from the summary page to view definitions. After reviewing details, they can return using the back button.
Because definitions remain embedded, users avoid confusion and misinterpretation.
Click to buy Business Transformation KPI Dashboard in Power BI
Excel Data Source Structure Explained
This dashboard uses Excel as the data source, which makes maintenance simple and flexible.
Input_Actual Sheet
In this sheet, users enter:
- KPI Name
- Month (first date of the month)
- MTD actual value
- YTD actual value
Input_Target Sheet
In this sheet, users enter:
- KPI Name
- Month (first date of the month)
- MTD target value
- YTD target value
KPI Definition Sheet
This sheet contains:
- KPI Number
- KPI Group
- KPI Name
- Unit
- Formula
- Definition
- Type (LTB or UTB)
Because data entry stays structured, Power BI calculations remain accurate and consistent.
Advantages of Business Transformation KPI Dashboard in Power BI
A Business Transformation KPI Dashboard in Power BI delivers strong value across the organization.
Key Advantages
- Centralized KPI tracking in one dashboard
- Real-time performance visibility
- Clear target vs actual comparison
- Improved accountability and ownership
- Faster decision-making
- Better alignment with strategy
- Reduced manual reporting effort
Moreover, because Power BI supports scalability, the dashboard grows as transformation initiatives expand.
Who Should Use This Dashboard?
This dashboard supports multiple stakeholders:
- CEOs and CXOs
- Transformation leaders
- Strategy teams
- PMO teams
- Department heads
Because the dashboard serves both executives and analysts, it bridges the gap between strategy and execution.
Best Practices for Business Transformation KPI Dashboard in Power BI
To get maximum value, organizations should follow proven best practices.
- Define Clear KPIs
Always align KPIs with transformation objectives. Avoid vague or vanity metrics.
- Maintain Data Consistency
Ensure consistent KPI names, units, and definitions across all sheets.
- Update Data Regularly
Update Excel input sheets on a fixed schedule to maintain accuracy.
- Use LTB and UTB Correctly
Assign KPI types correctly to ensure icons and comparisons work as expected.
- Review Trends Monthly
Analyze trend charts regularly to spot issues early.
- Train Users
Educate users on slicers, drill-through, and interpretation of metrics.
Following these practices ensures the dashboard remains reliable and trusted.
Conclusion
A Business Transformation KPI Dashboard in Power BI is not just a reporting tool. Instead, it is a strategic asset that guides organizations through complex change initiatives.
By combining Excel-based data entry with Power BI analytics, this dashboard delivers clarity, speed, and insight. Moreover, its structured pages, dynamic slicers, and visual indicators empower leaders to act confidently.
When organizations track transformation KPIs consistently, they increase success rates and reduce risk. Therefore, investing in a well-designed KPI dashboard becomes essential for sustainable transformation.
Frequently Asked Questions (FAQs)
What is a Business Transformation KPI Dashboard in Power BI?
It is an interactive Power BI report that tracks transformation KPIs using MTD, YTD, target, and trend analysis.
Can non-technical users update the data?
Yes. Users update data directly in Excel without touching Power BI.
Does this dashboard support drill-through?
Yes. Users can drill through to the KPI Definition page for detailed explanations.
Can organizations customize KPIs?
Yes. Organizations can add, remove, or modify KPIs by updating the Excel sheets.
Is this dashboard suitable for large organizations?
Yes. It scales easily and supports enterprise-level transformation programs.
Visit our YouTube channel to learn step-by-step video tutorials
Watch the step-by-step video tutorial:
Click to buy Business Transformation KPI Dashboard in Power BI