Innovation labs play a critical role in modern organizations. They experiment with new ideas, develop prototypes, test emerging technologies, and transform concepts into real business value. However, innovation without measurement quickly becomes guesswork. Therefore, organizations need a structured way to track performance, monitor progress, and improve outcomes.
That is exactly where an Innovation Labs KPI Dashboard in Excel becomes a powerful solution.
In this in-depth and SEO-friendly guide, you will learn what an Innovation Labs KPI Dashboard in Excel is, why it matters, how it works, and how each worksheet supports innovation performance tracking. Moreover, you will explore its advantages, best practices, and frequently asked questions. By the end of this article, you will clearly understand how this ready-to-use Excel dashboard helps innovation teams move from ideas to measurable impact.
Click to buy Innovation Labs KPI Dashboard in Excel
What Is an Innovation Labs KPI Dashboard in Excel?
An Innovation Labs KPI Dashboard in Excel is a structured, interactive, and data-driven reporting tool designed to track, measure, and analyze key performance indicators related to innovation activities.
Instead of relying on scattered spreadsheets, emails, or presentations, this dashboard centralizes all innovation KPIs into one Excel file. As a result, innovation leaders, product managers, and executives gain real-time visibility into performance.
Moreover, Excel makes this dashboard easy to use, flexible, and cost-effective. Teams can update data quickly, customize KPIs, and analyze trends without technical complexity.
Why Do Innovation Labs Need a KPI Dashboard?
Innovation labs often deal with uncertainty, experimentation, and fast changes. However, that does not mean performance should remain unclear. On the contrary, innovation requires strong measurement to succeed.
An Innovation Labs KPI Dashboard in Excel helps because it:
- Creates transparency across innovation initiatives
- Tracks progress against targets clearly
- Aligns innovation efforts with business goals
- Identifies bottlenecks early
- Improves decision-making with data
Therefore, organizations that measure innovation perform better, adapt faster, and scale ideas more effectively.
How Does an Innovation Labs KPI Dashboard in Excel Work?
This dashboard works by combining structured input sheets with automated calculations and dynamic visuals. You enter actual data, targets, and previous-year numbers. Then, Excel formulas and charts convert that data into insights.
Additionally, dropdown selections allow users to analyze KPIs by month or by KPI name. As a result, leaders can review performance quickly without manual effort.
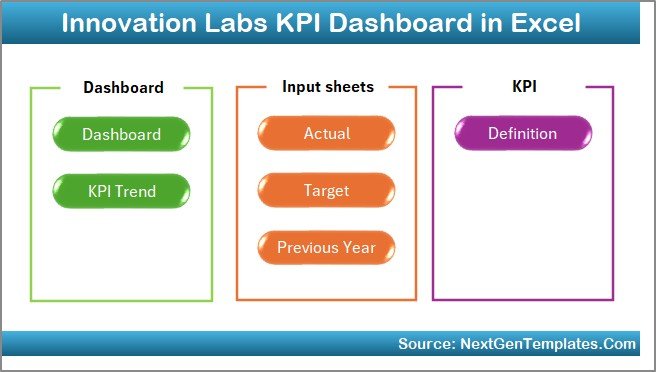
What Are the Key Features of the Innovation Labs KPI Dashboard in Excel?
This Innovation Labs KPI Dashboard in Excel includes 7 structured worksheets, each designed to serve a specific purpose. Let us explore them in detail.
Summary Page
The Summary Page acts as the index or navigation hub of the dashboard.
Key Highlights of the Summary Page
- Contains 6 navigation buttons
- Allows quick movement to all major sheets
- Improves usability and user experience
- Saves time during reviews and presentations
Because innovation leaders often need fast access to insights, this page ensures smooth navigation across the dashboard.
Click to buy Innovation Labs KPI Dashboard in Excel
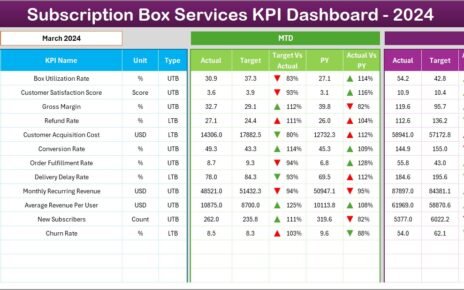
Dashboard Sheet Tab
The Dashboard Sheet is the core of the Innovation Labs KPI Dashboard in Excel.
Key Features of the Dashboard Sheet
- Centralized view of all KPIs
- Month selector available at cell D3
- Automatic refresh of all KPI values based on selected month
Metrics Displayed on the Dashboard
- MTD Actual
- MTD Target
- MTD Previous Year
- Target vs Actual
- Previous Year vs Actual
- YTD Actual
- YTD Target
- YTD Previous Year
Moreover, the dashboard uses conditional formatting with up and down arrows, which makes performance interpretation instant.
Why This Matters
Because innovation leaders need clarity, this dashboard transforms raw data into actionable insights in seconds.

Click to buy Innovation Labs KPI Dashboard in Excel
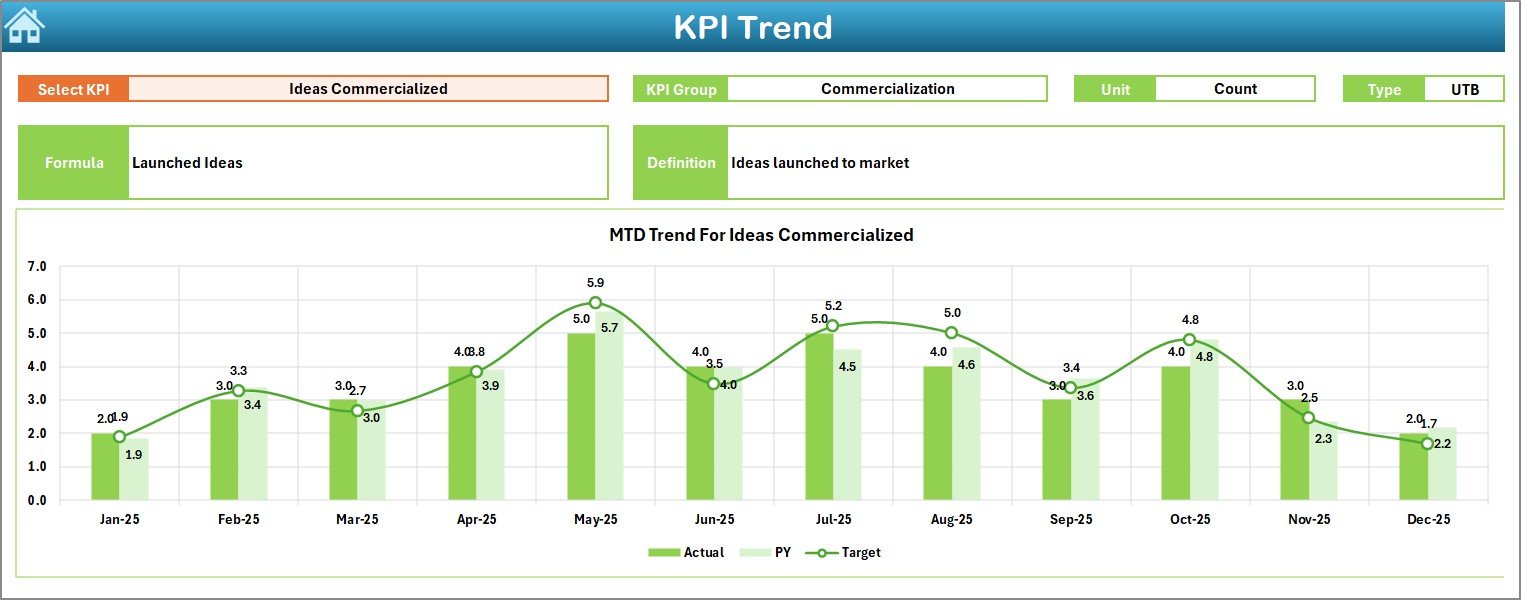
Trend Sheet
The Trend Sheet focuses on detailed KPI-level analysis.
Key Features of the Trend Sheet
- KPI selector dropdown at cell C3
- Displays:
KPI Group
KPI Unit
KPI Type (Lower the Better / Upper the Better)
KPI Formula
KPI Definition
Visual Insights
- MTD trend chart for Actual, Target, and Previous Year
- YTD trend chart for Actual, Target, and Previous Year
As a result, teams can identify improvement patterns, stagnation, or decline over time.
Click to buy Innovation Labs KPI Dashboard in Excel
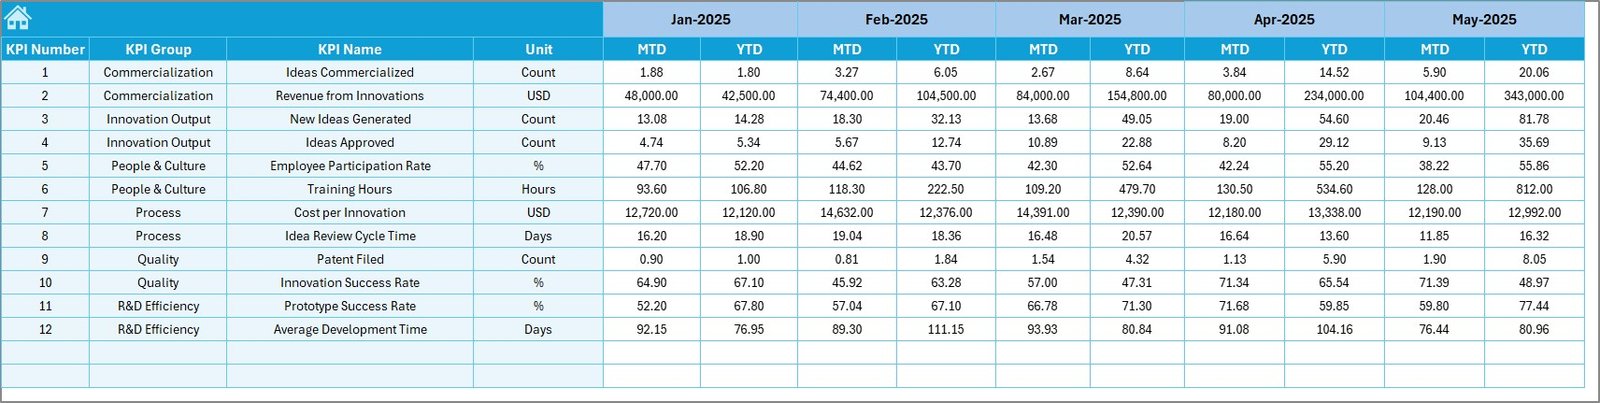
Actual Numbers
The Actual Numbers Input Sheet captures real performance data.
How This Sheet Works
- Enter MTD and YTD actual values
- Change the starting month at cell E1
- Automatically adjusts calculations for the entire year
Because innovation data changes frequently, this sheet ensures quick and accurate updates.
Click to buy Innovation Labs KPI Dashboard in Excel
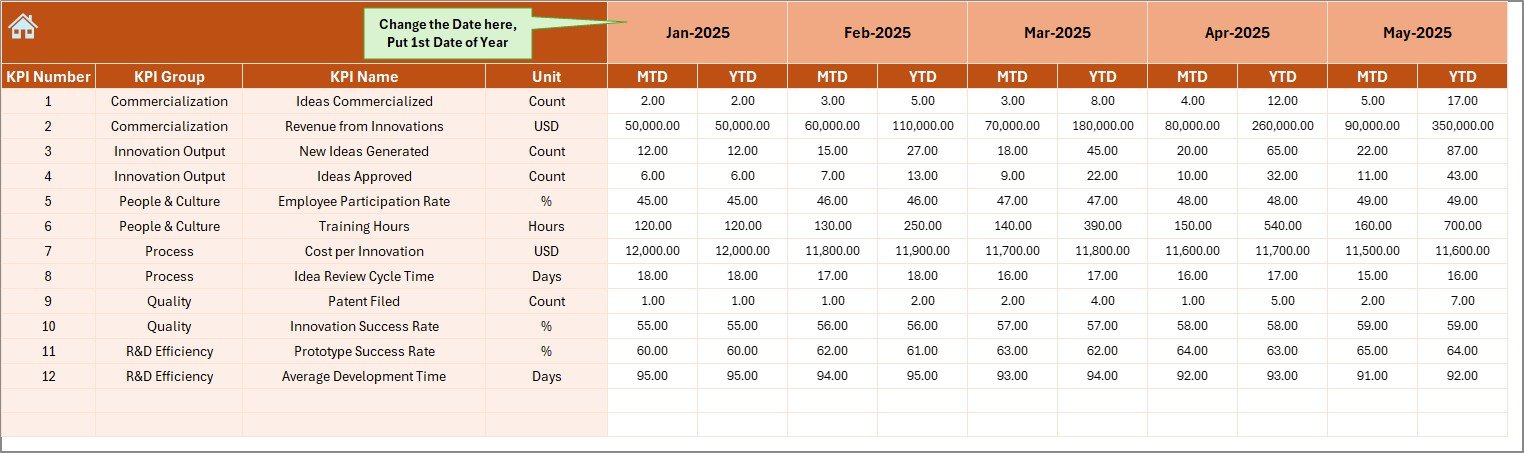
Target Sheet
The Target Sheet defines expected performance.
Key Functions
- Enter MTD target values
- Enter YTD target values
- Align innovation KPIs with strategic goals
Without clear targets, innovation becomes directionless. Therefore, this sheet keeps teams focused and accountable.
Click to buy Innovation Labs KPI Dashboard in Excel
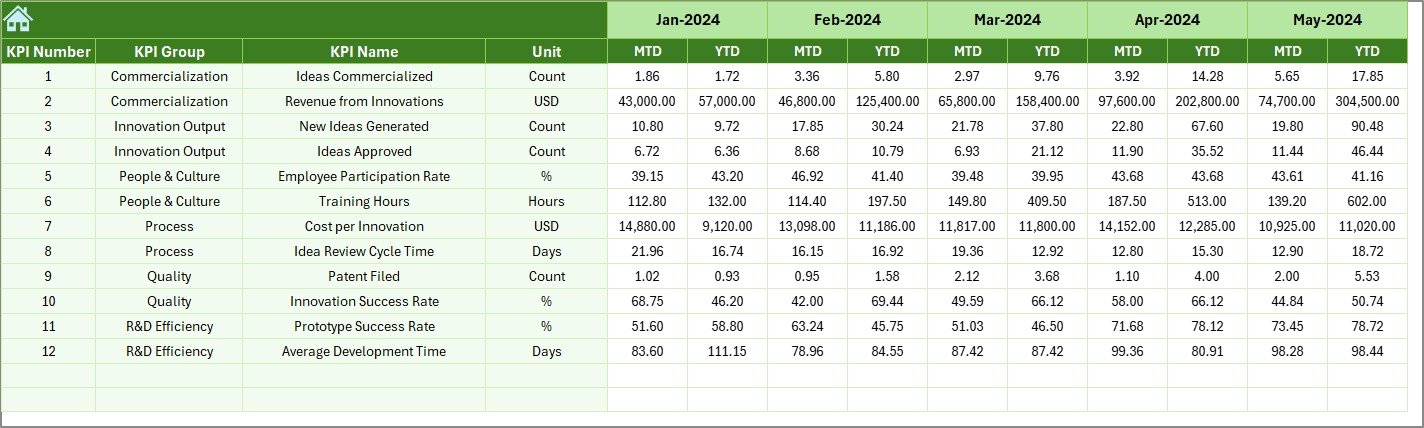
Previous Year Number Sheet
The Previous Year Number Sheet enables year-over-year analysis.
Key Benefits
- Stores last year’s MTD and YTD data
- Enables fair performance comparison
- Highlights long-term innovation trends
As a result, leaders can measure growth, maturity, and improvement across years.
Click to buy Innovation Labs KPI Dashboard in Excel
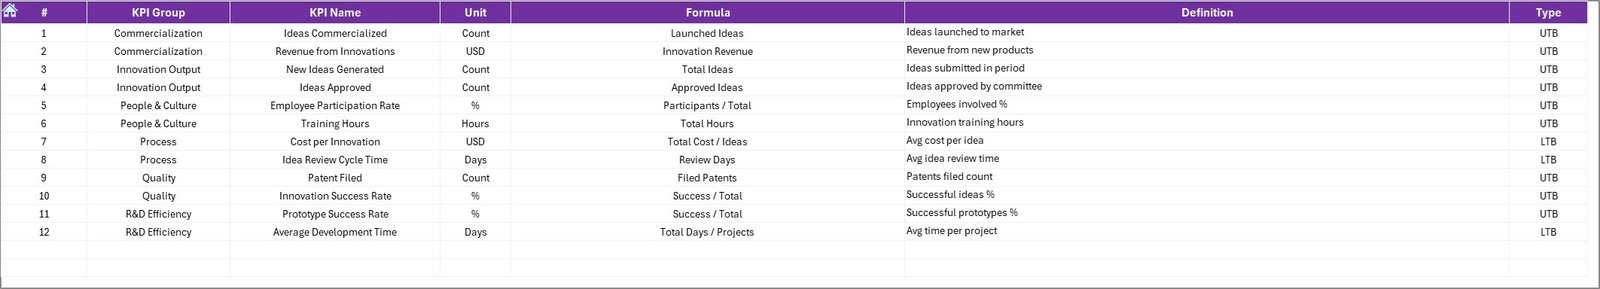
KPI Definition Sheet
The KPI Definition Sheet acts as the backbone of the dashboard.
Information Captured
- KPI Name
- KPI Group
- Unit of Measurement
- KPI Formula
- KPI Definition
Because innovation KPIs can be complex, this sheet ensures consistency and clarity across teams.
Click to buy Innovation Labs KPI Dashboard in Excel
Which KPIs Can You Track Using an Innovation Labs KPI Dashboard in Excel?
This dashboard supports a wide range of innovation-related KPIs, such as:
- Number of ideas generated
- Idea-to-prototype conversion rate
- Time to prototype
- Experiment success rate
- Cost per innovation project
- ROI from innovation initiatives
- Collaboration index
- Technology adoption rate
Moreover, teams can customize KPIs based on industry or strategy.
Advantages of Innovation Labs KPI Dashboard in Excel
Using an Innovation Labs KPI Dashboard in Excel delivers several advantages.
- Centralized Innovation Data
All KPIs remain in one structured file, which eliminates confusion.
- Improved Decision-Making
Because data updates automatically, leaders make faster and better decisions.
- Easy Customization
Excel allows teams to modify KPIs, formulas, and layouts easily.
- Cost-Effective Solution
Unlike complex BI tools, Excel requires no additional investment.
- Enhanced Accountability
Clear targets and trends promote ownership across innovation teams.
- Time-Saving Reporting
Automated calculations reduce manual effort significantly.
How Does This Dashboard Improve Innovation Governance?
Innovation governance requires transparency, discipline, and alignment. This dashboard supports governance by:
- Defining clear KPIs
- Tracking progress regularly
- Highlighting deviations instantly
- Supporting review meetings with visuals
Therefore, leadership gains confidence in innovation investments.
Who Should Use an Innovation Labs KPI Dashboard in Excel?
This dashboard suits multiple roles, including:
- Innovation Managers
- R&D Leaders
- Product Managers
- Strategy Teams
- CXOs and Founders
Because Excel remains widely used, adoption remains smooth across teams.
Best Practices for the Innovation Labs KPI Dashboard in Excel
To maximize value, follow these best practices.
- Define Clear Innovation KPIs
Choose KPIs that align with business goals and innovation maturity.
- Update Data Regularly
Ensure teams update actuals monthly to maintain accuracy.
- Review Trends, Not Just Numbers
Focus on patterns and direction rather than isolated values.
- Use Targets Wisely
Set realistic and measurable targets to encourage progress.
- Standardize KPI Definitions
Use the KPI Definition sheet consistently across teams.
- Use Dashboard Reviews in Meetings
Make this dashboard the single source of truth for innovation reviews.
How Can Innovation Teams Scale Using This Dashboard?
As innovation labs grow, complexity increases. This dashboard supports scaling by:
- Handling multiple KPIs easily
- Tracking long-term trends
- Supporting data-driven investment decisions
As a result, innovation efforts remain structured even during expansion.
How Does This Dashboard Support Continuous Improvement?
Continuous improvement depends on measurement. This dashboard enables improvement by:
- Highlighting underperforming KPIs
- Tracking improvement over time
- Supporting data-backed experiments
Therefore, teams learn faster and iterate better.
Conclusion: Why Should You Use an Innovation Labs KPI Dashboard in Excel?
An Innovation Labs KPI Dashboard in Excel transforms innovation from intuition to intelligence. It provides structure, visibility, and accountability without complexity.
Because it centralizes KPIs, automates calculations, and visualizes trends, this dashboard empowers innovation teams to measure what matters most. Moreover, Excel’s flexibility ensures that organizations can adapt the dashboard as innovation evolves.
Ultimately, this dashboard helps innovation labs deliver real, measurable business value.
Frequently Asked Questions (FAQs)
What is an Innovation Labs KPI Dashboard in Excel used for?
It tracks, measures, and analyzes innovation KPIs in a structured Excel format.
Can I customize KPIs in this dashboard?
Yes, you can easily add, remove, or modify KPIs and formulas.
Does this dashboard support month-wise analysis?
Yes, you can select months using dropdowns, and the dashboard updates automatically.
Is Excel suitable for innovation performance tracking?
Yes, Excel offers flexibility, accessibility, and ease of use for KPI tracking.
Who benefits most from this dashboard?
Innovation managers, R&D teams, and leadership teams benefit the most.
Does this dashboard support year-over-year comparison?
Yes, it includes previous-year data for accurate comparisons.
Can this dashboard scale with growing innovation teams?
Yes, it supports additional KPIs and extended timelines easily.
Visit our YouTube channel to learn step-by-step video tutorials
Watch the step-by-step video tutorial:
Click to buy Innovation Labs KPI Dashboard in Excel