Managing a car rental business without clear visibility always creates confusion. Rental data stays scattered across multiple sheets. Revenue numbers remain unclear. Maintenance costs grow silently. Customer satisfaction becomes difficult to measure. As a result, decision-making slows down and profits suffer.
That is exactly where a Car Rental Services Dashboard in Excel becomes extremely valuable.
A Car Rental Services Dashboard in Excel converts raw rental data into clear visuals, performance indicators, and trend analysis. Moreover, it helps car rental owners, managers, and analysts track revenue, customer ratings, maintenance costs, and rental performance from a single screen.
Click to Purchases Car Rental Services Dashboard in Excel
In this detailed guide, you will learn what a Car Rental Services Dashboard in Excel is, how it works, its key features, advantages, best practices, and frequently asked questions. By the end, you will clearly understand how this dashboard improves operational control and business growth.
What Is a Car Rental Services Dashboard in Excel?
A Car Rental Services Dashboard in Excel is a ready-to-use analytical template designed to monitor and analyze car rental operations.
Instead of reviewing raw rows of data, this dashboard presents information using charts, KPI cards, and filters. As a result, decision-makers instantly understand business performance.
Because it works in Microsoft Excel, teams can use it without advanced technical skills or expensive BI tools. Additionally, Excel allows easy customization, data entry, and reporting.
This dashboard focuses on:
-
Rental revenue
-
Ongoing rental performance
-
Customer ratings
-
Maintenance costs
-
Branch, city, and car category analysis
-
Monthly trends
Why Do Car Rental Businesses Need a Dashboard in Excel?
Car rental businesses handle high-volume transactions daily. Therefore, manual tracking always creates delays and errors.
Here is why an Excel dashboard becomes essential:
-
First, it centralizes all rental data in one place
-
Second, it improves visibility across branches and cities
-
Third, it highlights revenue and cost drivers clearly
-
Moreover, it helps identify underperforming car categories
-
Finally, it supports faster and smarter decisions
Without a dashboard, businesses rely on assumptions. However, with a dashboard, decisions rely on data.
How Does a Car Rental Services Dashboard in Excel Work?
The dashboard pulls data from a structured Data Sheet and processes it through Excel formulas and Pivot Tables.
Here is how it works step by step:
-
Data gets entered into a Data Sheet
-
Excel aggregates data using Pivot Tables
-
Charts update automatically
-
Slicers filter data dynamically
-
KPI cards reflect selected periods
As a result, every page updates instantly based on user selection.
Key Features of Car Rental Services Dashboard in Excel
This dashboard comes with multiple professional features that make analysis easy and interactive.
Page Navigator for Easy Navigation
A Page Navigator sits on the left side of the dashboard.
Because of this feature:
-
Users switch between pages instantly
-
Navigation remains smooth and intuitive
-
Dashboard usability improves significantly
This feature makes the dashboard user-friendly for non-technical users.
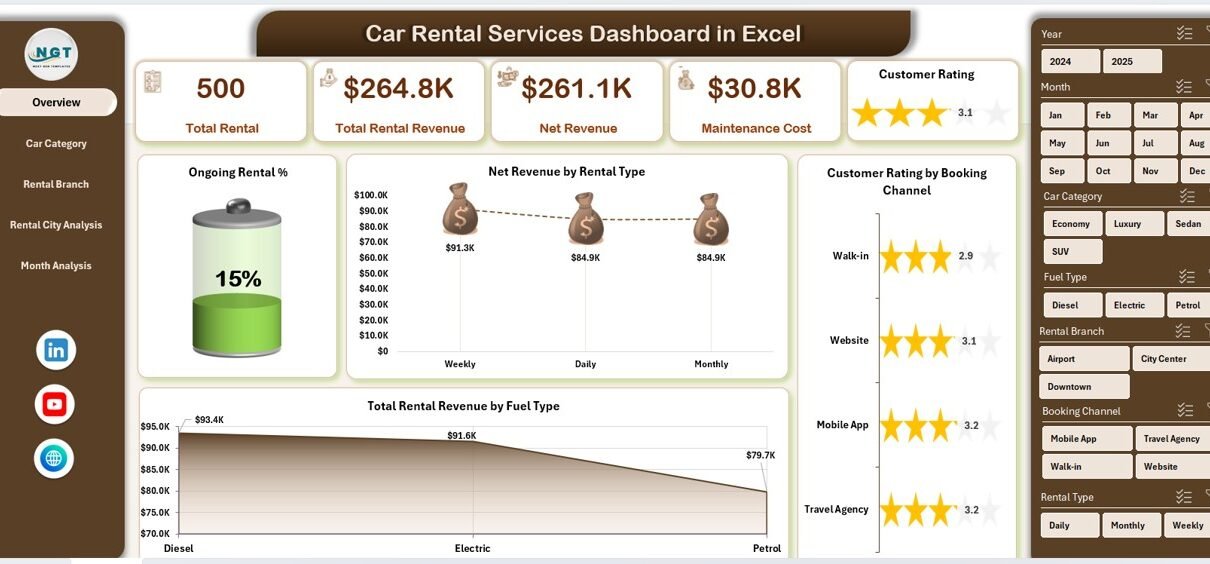
How Does the Overview Page Help in Decision-Making?
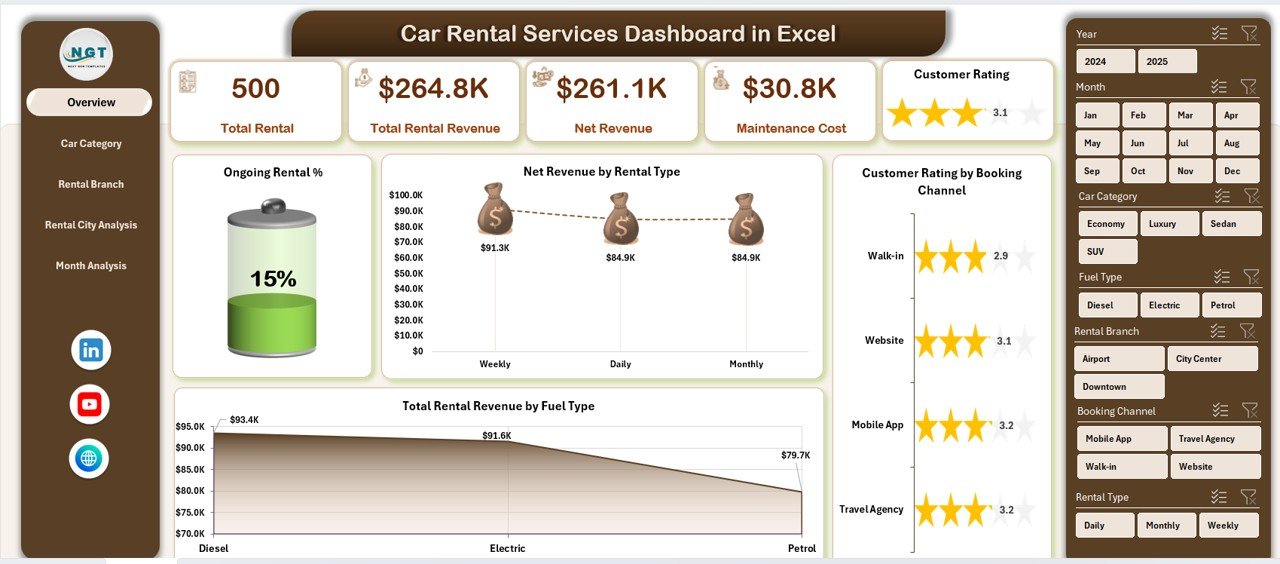
The Overview Page acts as the command center of the dashboard.
Key Highlights of the Overview Page
-
Right-side slicer for dynamic filtering
-
Five KPI cards for quick insights
-
Four powerful charts for performance overview
KPI Cards on the Overview Page
The dashboard displays five cards that summarize performance at a glance. These cards help users understand business health instantly.
Charts Available on the Overview Page
The Overview Page includes the following charts:
-
Ongoing Rental %
Shows how many rentals are currently active. This helps manage fleet availability. -
Net Revenue by Rental Type
Highlights which rental types generate higher profits. -
Customer Rating by Booking Channel
Shows customer satisfaction across online, offline, or partner channels. -
Total Rental Revenue by Fuel Type
Helps compare petrol, diesel, electric, or hybrid vehicle revenue.
Together, these visuals provide a complete business snapshot.
What Is Car Category Analysis in the Dashboard?
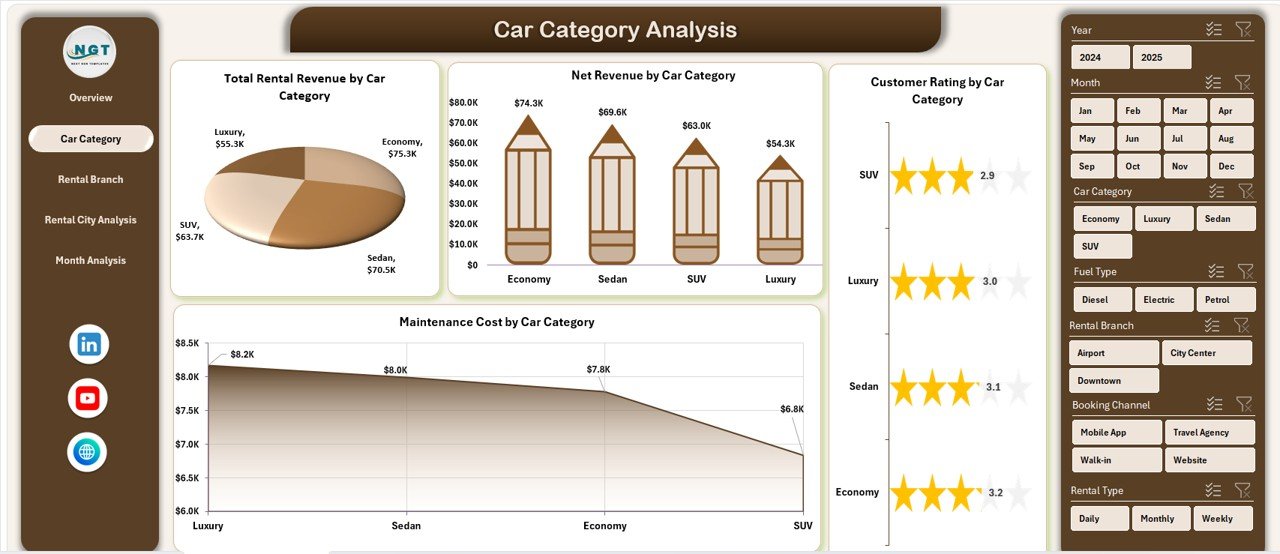
The Car Category Analysis Page helps analyze performance based on vehicle categories.
Why Is Car Category Analysis Important?
Different car categories generate different revenues and costs. Therefore, understanding category-wise performance becomes crucial.
Key Features of Car Category Analysis Page
Click to Purchases Car Rental Services Dashboard in Excel
-
Right-side slicer for filtering
-
Four analytical charts
Charts on Car Category Analysis Page
-
Net Revenue by Car Category
Shows which car categories generate the highest profits. -
Customer Rating by Car Category
Highlights customer satisfaction across categories. -
Total Rental Revenue by Car Category
Helps identify top revenue-generating segments. -
Maintenance Cost by Car Category
Reveals which categories require higher upkeep.
This page supports smarter fleet planning and investment decisions.
How Does Rental Branch Analysis Improve Performance?
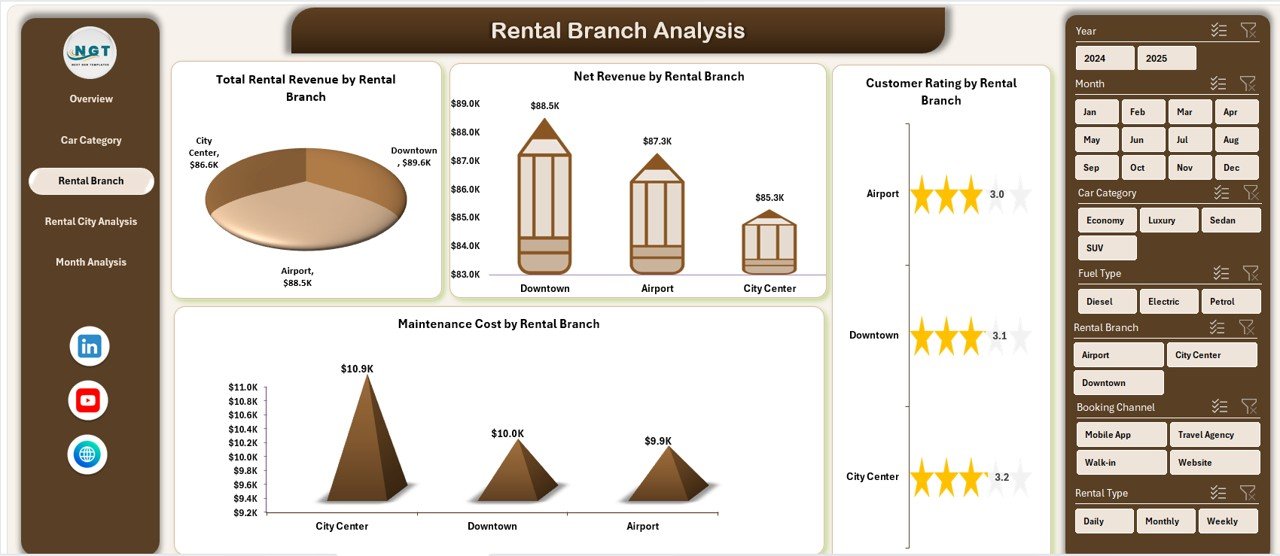
The Rental Branch Analysis Page focuses on branch-wise performance comparison.
Why Analyze Branch Performance?
Every branch operates under different conditions. Therefore, comparing branch performance helps identify best practices and improvement areas.
Key Features of Rental Branch Analysis Page
-
Right-side slicer
-
Four detailed charts
Charts on Rental Branch Analysis Page
-
Net Revenue by Rental Branch
Identifies high-performing branches. -
Customer Rating by Rental Branch
Shows service quality differences across branches. -
Total Rental Revenue by Rental Branch
Highlights revenue contribution per branch. -
Maintenance Cost by Rental Branch
Reveals cost inefficiencies.
As a result, managers can improve weaker branches and replicate success.
Why Is Rental City Analysis Important?
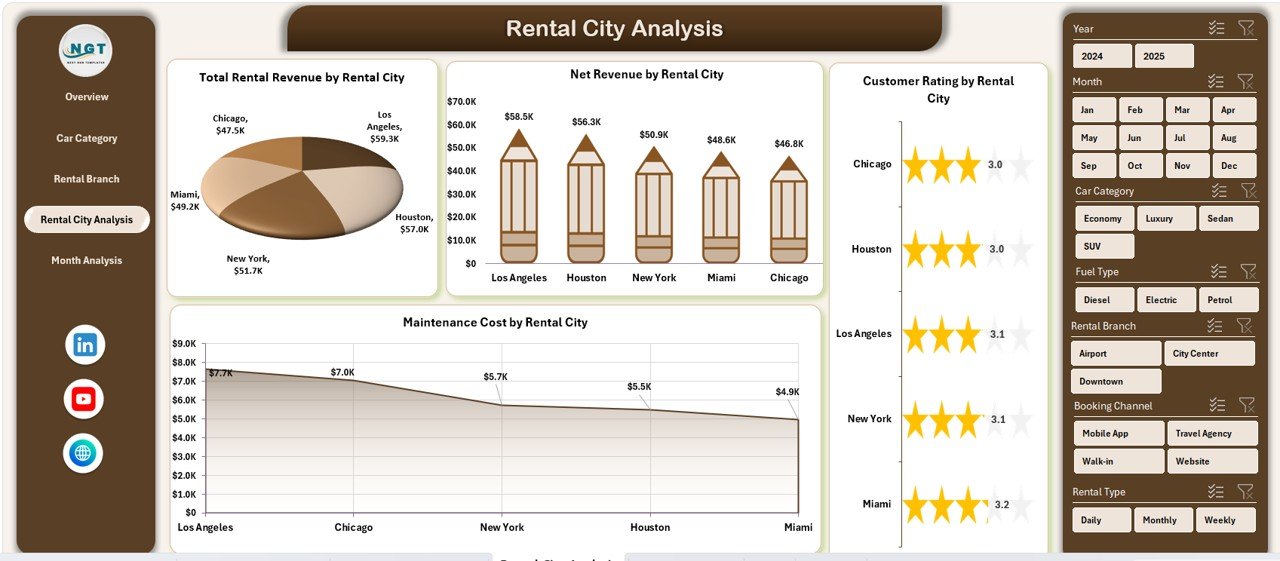
The Rental City Analysis Page provides city-wise performance insights.
Click to Purchases Car Rental Services Dashboard in Excel
Benefits of City-Level Analysis
-
Understand regional demand patterns
-
Improve city-specific pricing strategies
-
Optimize fleet allocation
Key Features of Rental City Analysis Page
-
Right-side slicer
-
Four performance charts
Charts on Rental City Analysis Page
-
Net Revenue by Rental City
Shows which cities generate higher profits. -
Customer Rating by Rental City
Helps improve customer experience city-wise. -
Total Rental Revenue by Rental City
Highlights market demand. -
Maintenance Cost by Rental City
Identifies cost-heavy locations.
This analysis helps scale operations in profitable cities.
How Does Month Analysis Support Trend Tracking?
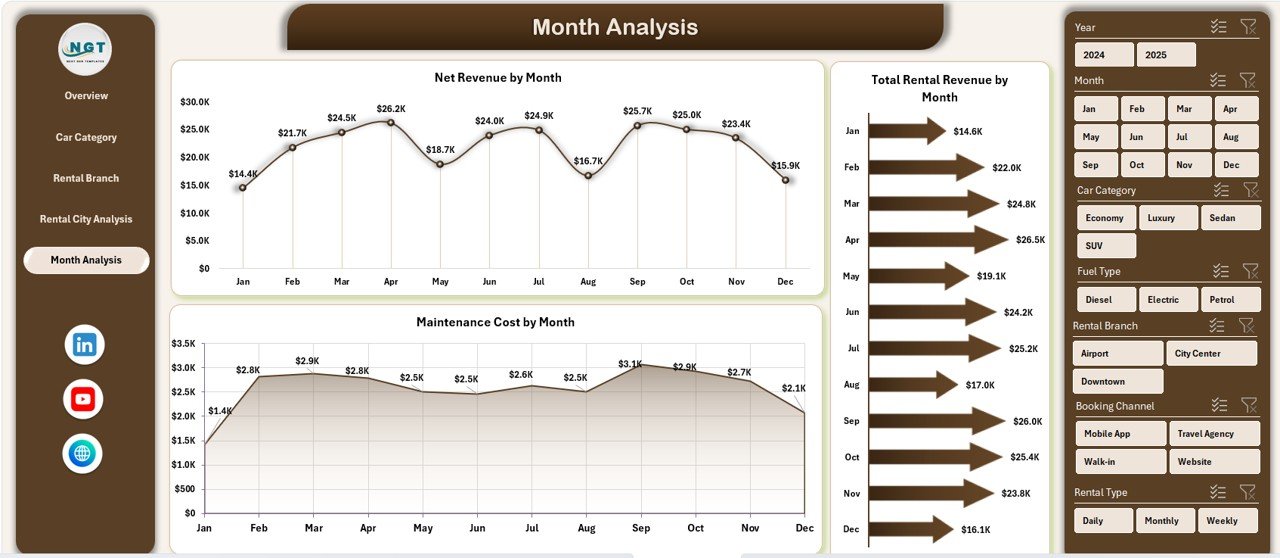
The Month Analysis Page tracks performance over time.
Why Monthly Analysis Matters?
Trends reveal seasonality, growth patterns, and cost behavior. Therefore, monthly analysis becomes essential.
Key Features of Month Analysis Page
-
Right-side slicer
-
Three time-based charts
Charts on Month Analysis Page
-
Net Revenue by Month
Tracks profitability trends. -
Total Rental Revenue by Month
Shows revenue growth or decline. -
Maintenance Cost by Month
Helps control rising costs.
This page supports forecasting and budgeting decisions.
What Is the Role of Data Sheet and Support Sheet?
Click to Purchases Car Rental Services Dashboard in Excel
Data Sheet
The Data Sheet stores all raw rental data. It includes:
-
Booking details
-
Rental dates
-
Car category
-
Branch and city
-
Revenue and maintenance cost
-
Customer ratings
Because data remains structured, Pivot Tables work efficiently.
Support Sheet
The Support Sheet holds helper data such as:
-
Lookup tables
-
Dropdown lists
-
Formatting logic
This sheet ensures smooth dashboard functionality.
Advantages of Car Rental Services Dashboard in Excel
Using this dashboard delivers several business benefits.
Key Advantages
-
Centralized rental data tracking
-
Real-time performance visibility
-
Easy comparison across categories and locations
-
Improved revenue and cost control
-
Faster decision-making
-
No advanced software required
-
Fully customizable in Excel
Because of these advantages, businesses gain better operational control.
Best Practices for Car Rental Services Dashboard in Excel
Following best practices ensures long-term success.
Recommended Best Practices
-
Keep data clean and structured
-
Update the Data Sheet regularly
-
Use consistent naming conventions
-
Validate formulas periodically
-
Avoid manual edits in Pivot areas
-
Protect dashboard sheets
-
Use slicers wisely
-
Review trends monthly
By following these practices, the dashboard remains accurate and reliable.
Who Should Use a Car Rental Services Dashboard in Excel?
This dashboard suits multiple roles:
-
Car rental business owners
-
Operations managers
-
Branch managers
-
Finance teams
-
Business analysts
-
Fleet managers
Anyone involved in performance tracking benefits from this dashboard.
How Does This Dashboard Improve Business Growth?
This dashboard directly impacts growth by:
-
Identifying profitable segments
-
Reducing maintenance costs
-
Improving customer satisfaction
-
Supporting data-driven pricing
-
Optimizing fleet utilization
As a result, businesses scale faster with fewer risks.
Click to Purchases Car Rental Services Dashboard in Excel
Conclusion
A Car Rental Services Dashboard in Excel transforms complex rental data into clear, actionable insights. It provides full visibility into revenue, costs, customer ratings, and operational performance.
Because it uses Excel, it remains affordable, flexible, and easy to use. Moreover, its structured pages—Overview, Car Category Analysis, Rental Branch Analysis, Rental City Analysis, and Month Analysis—cover every critical business angle.
If you want better control, smarter decisions, and higher profitability, this dashboard becomes an essential tool.
Frequently Asked Questions (FAQs)
What is a Car Rental Services Dashboard in Excel used for?
A Car Rental Services Dashboard in Excel tracks rental revenue, customer ratings, maintenance costs, and performance across categories, branches, cities, and months.
Do I need advanced Excel skills to use this dashboard?
No. Basic Excel knowledge is enough to use and update the dashboard.
Can I customize the dashboard?
Yes. You can modify charts, KPIs, slicers, and layouts easily.
How often should I update the data?
You should update data daily or weekly for accurate insights.
Can this dashboard handle large datasets?
Yes. Excel Pivot Tables handle thousands of records efficiently.
Is this dashboard suitable for multi-city operations?
Yes. The Rental City Analysis page supports multi-city performance tracking.
Does the dashboard support monthly trend analysis?
Yes. The Month Analysis page tracks revenue and costs over time.
Visit our YouTube channel to learn step-by-step video tutorials