Budget planning plays a critical role in every organization, regardless of size or industry. However, many finance teams still rely on static Excel files, disconnected reports, or manual calculations. As a result, forecasting errors increase, visibility decreases, and decision-making becomes reactive instead of proactive.
That is exactly where a Budget Forecasting Dashboard in Power BI makes a powerful difference.
This detailed guide explains what a Budget Forecasting Dashboard in Power BI is, why businesses need it, how it works, and how each dashboard page supports smarter financial decisions. Additionally, you will explore its advantages, best practices, and frequently asked questions to help you implement it effectively.
Click to buy Budget Forecasting Dashboard in Power BI
What Is a Budget Forecasting Dashboard in Power BI?
A Budget Forecasting Dashboard in Power BI is an interactive financial reporting solution designed to compare budgeted, forecasted, and actual amounts in real time.
Instead of reviewing multiple spreadsheets, finance teams analyze performance through:
- Visual KPIs
- Department-level analysis
- Category-wise tracking
- Monthly trends
- Budget status insights
Because Power BI supports slicers, drill-downs, and dynamic visuals, users can instantly identify over-budget areas, under-utilized budgets, and forecast risks. As a result, organizations gain full control over financial planning and execution.
Why Do Businesses Need a Budget Forecasting Dashboard?
Budgeting without visibility often leads to overspending, missed targets, and poor resource allocation. Therefore, businesses need a centralized and transparent system.
A Budget Forecasting Dashboard helps because:
- It shows real-time financial performance
- It highlights budget variance instantly
- It improves forecasting accuracy
- It supports data-driven decisions
- It reduces manual reporting effort
Moreover, finance leaders can act faster because they no longer wait for month-end reports.
How Does a Budget Forecasting Dashboard in Power BI Work?
The dashboard works by connecting structured budget data—usually from Excel or databases—into Power BI.
Typically, the data includes:
- Budget amounts
- Forecast values
- Actual expenses
- Departments
- Categories
- Months
- Budget status
Once loaded, Power BI calculates KPIs such as variance, over-budget percentage, and under-budget count. Then, interactive visuals display insights across multiple pages. Because of slicers, users can filter by department, category, or time period instantly.
What Are the Key Pages in a Budget Forecasting Dashboard in Power BI?
This dashboard contains five powerful analytical pages, each designed for a specific financial perspective.
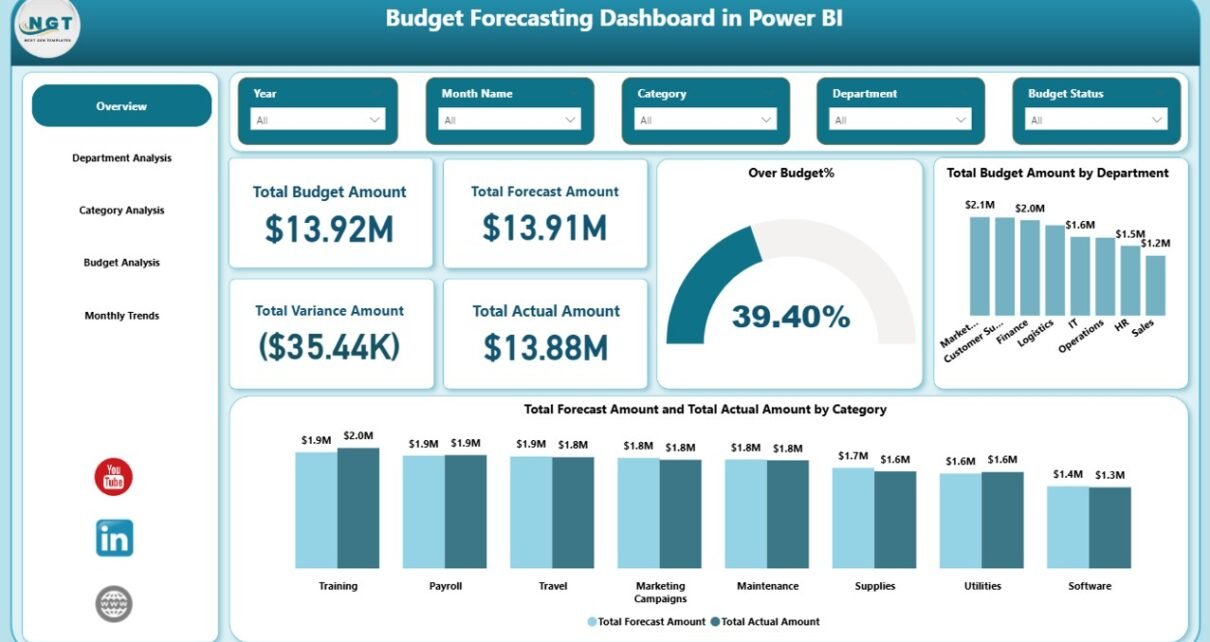
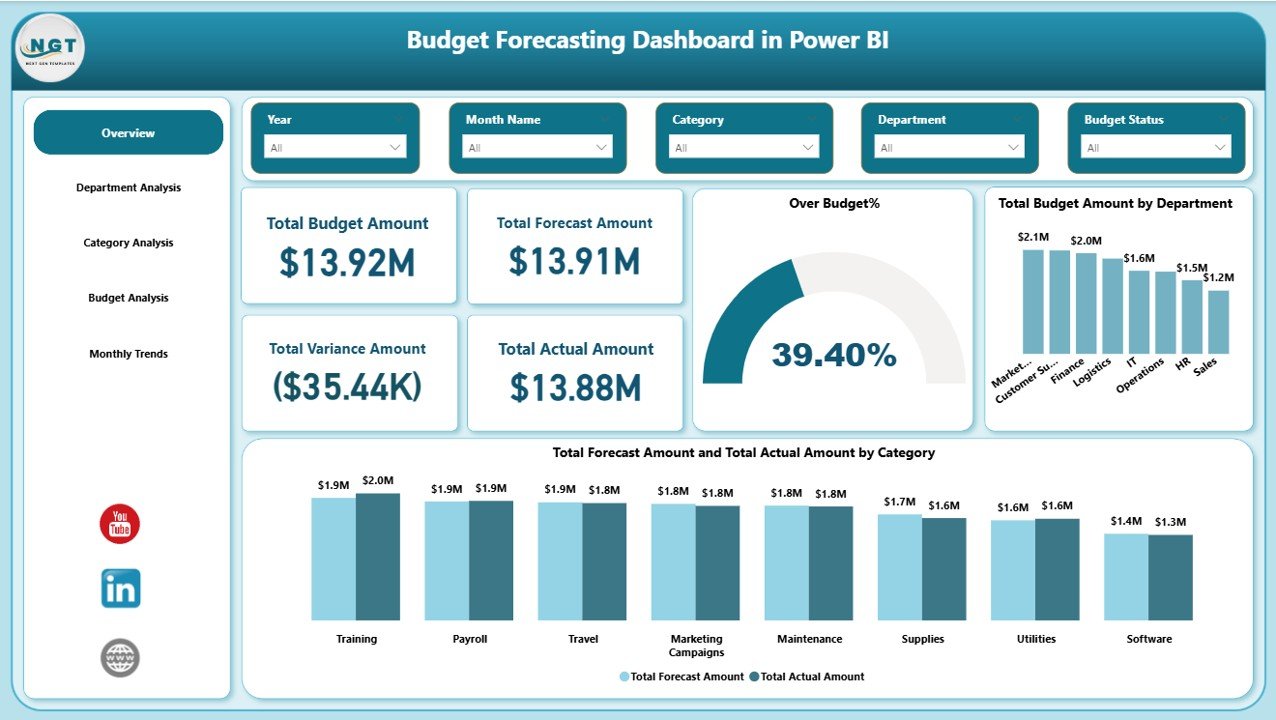
Overview Page
The Overview Page acts as the command center of the dashboard. It delivers a quick financial snapshot for management and finance teams.
Key KPIs on the Overview Page
This page includes five critical KPI cards:
- Total Budget Amount
- Total Forecast Amount
- Total Actual Amount
- Total Variance Amount
- Over Budget Percentage
Because these KPIs appear at the top, decision-makers immediately understand overall financial health.
Visual Analysis on the Overview Page
Additionally, this page includes charts such as:
- Total budget amount by department
- Total forecast amount by category
- Total actual amount by category
Thanks to slicers, users can filter the entire page by department, category, or time period. As a result, leadership gains clarity within seconds.
Click to buy Budget Forecasting Dashboard in Power BI
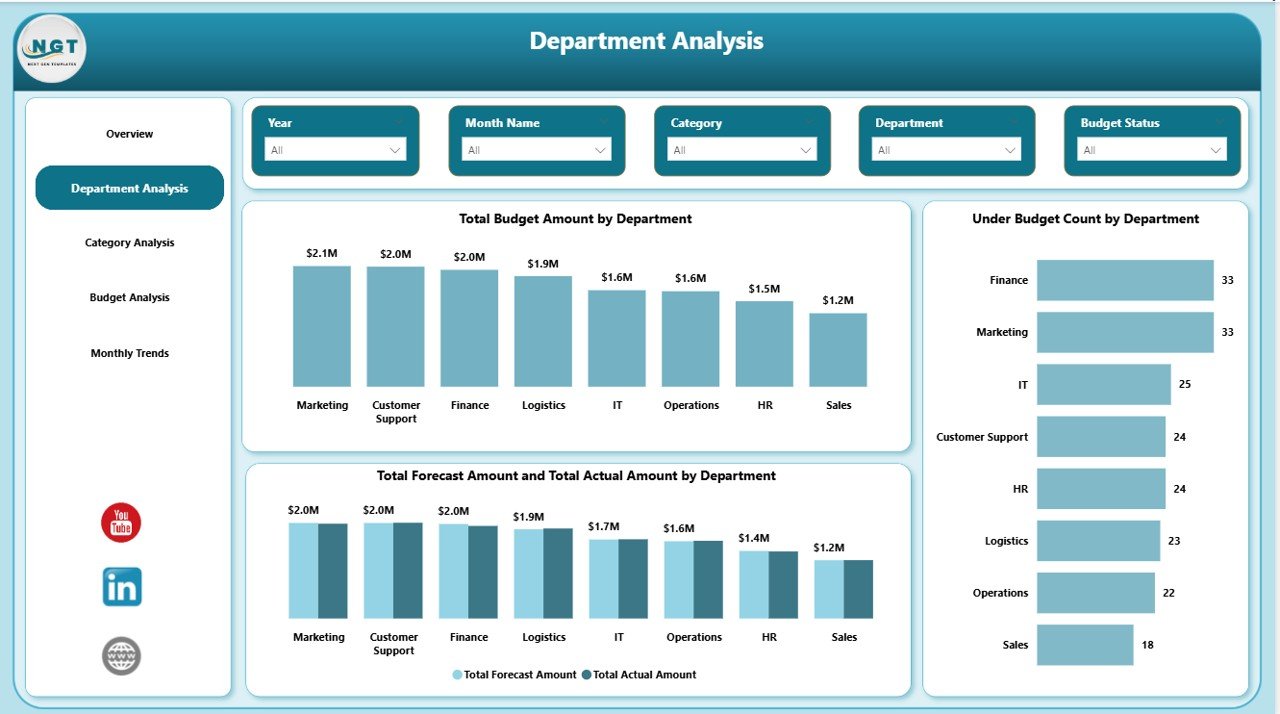
How Does the Department Analysis Page Improve Cost Control?
The Department Analysis Page focuses on departmental spending and performance.
Key Visuals on the Department Analysis Page
This page includes:
- Total budget amount by department
- Under-budget count by department
- Total forecast amount by department
- Total actual amount by department
Because departments often control separate budgets, this page helps identify which teams manage funds efficiently and which teams require intervention.
Click to buy Budget Forecasting Dashboard in Power BI
When finance teams compare budget vs actual at the department level, they:
- Control overspending early
- Improve accountability
- Support fair budget allocation
- Encourage responsible spending behavior
As a result, organizations operate with stronger financial discipline.
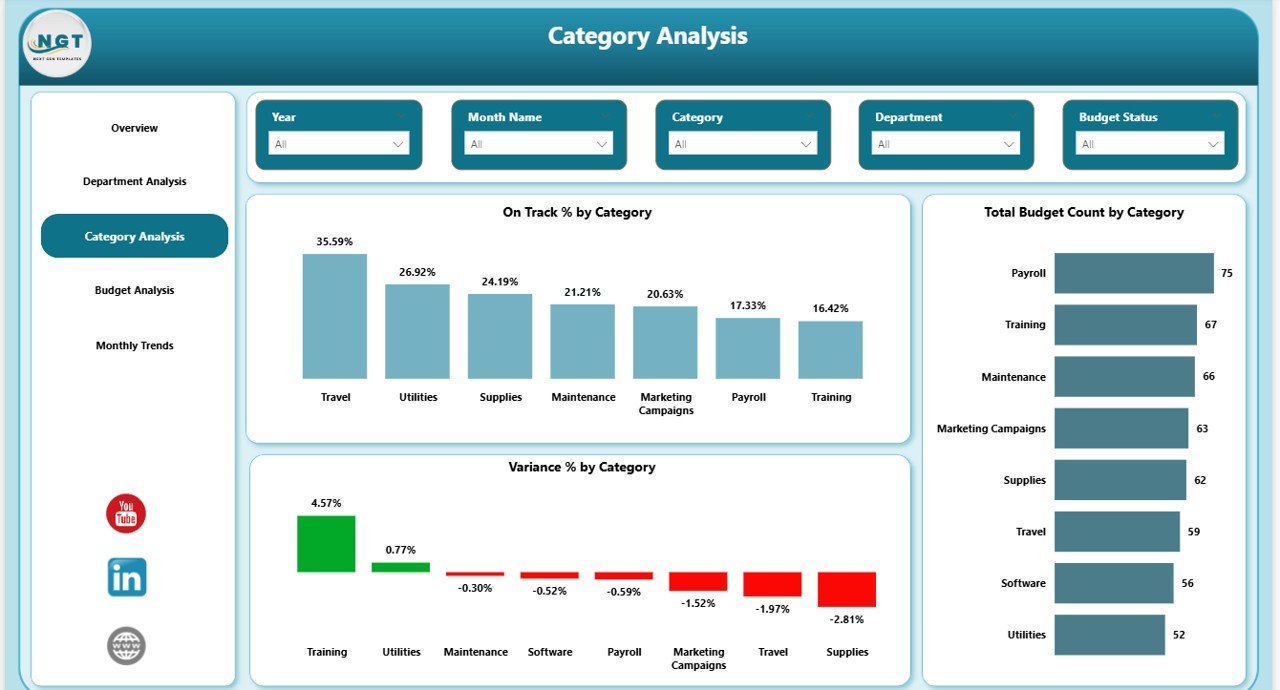
Category Analysis
The Category Analysis Page provides insights into expense categories such as marketing, operations, IT, or HR.
Key Metrics on the Category Analysis Page
This page includes:
- On-Track Percentage by Category
- Total Budget Count by Category
- Variance by Category
Because categories often hide inefficiencies, this analysis helps uncover cost leakage.
Click to buy Budget Forecasting Dashboard in Power BI
How Category Analysis Helps Finance Teams
With this page, finance teams can:
- Identify high-risk categories
- Optimize spending patterns
- Adjust future forecasts
- Improve cost structure
Therefore, businesses gain better cost transparency across functions.
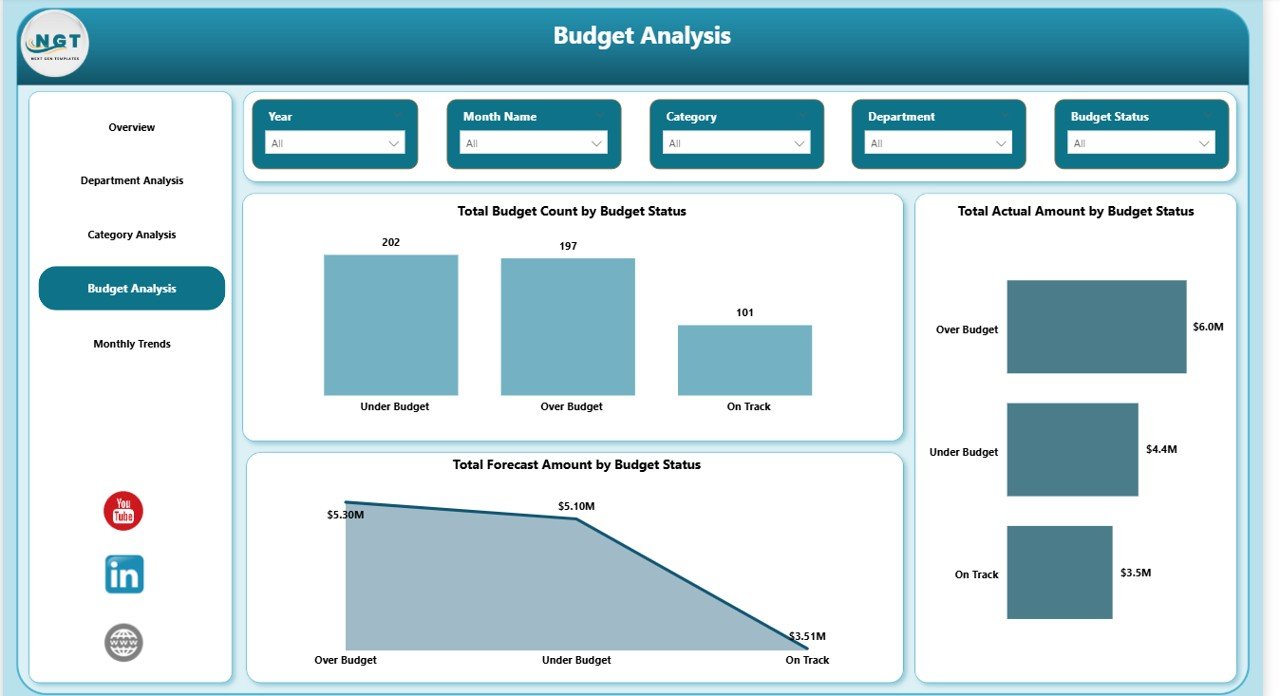
Budget Analysis
The Budget Analysis Page groups budgets based on their status, such as on-track, over-budget, or under-budget.
Key Visuals on the Budget Analysis Page
This page includes:
- Total budget count by budget status
- Total actual amount by budget status
- Total forecast amount by budget status
Because budget status reflects financial risk, this page helps leaders prioritize corrective actions.
Strategic Value of Budget Status Tracking
With this page, organizations can:
- Detect overspending trends early
- Focus on high-risk budgets
- Improve budget governance
- Strengthen forecasting accuracy
As a result, financial surprises reduce significantly.
Click to buy Budget Forecasting Dashboard in Power BI
Monthly Trends
The Monthly Trends Page highlights time-based financial performance.
Key Charts on the Monthly Trends Page
This page includes:
- Total forecast amount by month
- Total actual amount by month
- Over-budget percentage by month
- Under-budget percentage by month
Because trends matter more than isolated numbers, this page supports proactive planning.
Why Monthly Trends Matter
With monthly trend analysis, finance teams can:
- Detect seasonal spending patterns
- Adjust forecasts in advance
- Prevent cumulative overspending
- Improve cash flow planning
Therefore, forecasting becomes more accurate and reliable.
Advantages of a Budget Forecasting Dashboard in Power BI
A Budget Forecasting Dashboard delivers measurable business value. Below are the key advantages explained clearly.
- Real-Time Financial Visibility
The dashboard updates automatically when data refreshes. As a result, finance teams always work with the latest numbers.
- Improved Forecast Accuracy
By comparing budget, forecast, and actual data continuously, teams refine forecasting assumptions faster.
- Faster Decision-Making
Because insights appear visually, leaders make decisions without waiting for manual reports.
- Better Budget Control
The dashboard highlights over-budget areas early. Therefore, corrective actions happen on time.
- Reduced Manual Effort
Automation eliminates repetitive Excel work and reduces human error.
- Enhanced Accountability
Department-level analysis encourages responsible spending across teams.
Best Practices for the Budget Forecasting Dashboard in Power BI
To get maximum value, organizations should follow these proven best practices.
- Use Clean and Structured Data
Always maintain consistent formats for dates, departments, and categories. Clean data improves accuracy.
- Define Clear KPIs
Track meaningful KPIs such as variance, over-budget percentage, and on-track status.
- Use Slicers Wisely
Limit slicers to relevant fields so users avoid confusion and overload.
- Refresh Data Regularly
Schedule data refreshes to keep forecasts and actuals up to date.
- Maintain Consistent Visual Design
Use uniform colors, labels, and layouts for better readability.
- Review Forecast Assumptions Monthly
Update forecasts based on real spending behavior and trends.
Who Should Use a Budget Forecasting Dashboard?
This dashboard suits many roles and industries, including:
- Finance managers
- CFOs and finance directors
- Department heads
- Budget analysts
- Business controllers
- Operations managers
Because the dashboard uses visuals instead of complex tables, both technical and non-technical users can use it confidently.
How Does This Dashboard Support Strategic Planning?
Strategic planning depends on accurate financial insights. This dashboard supports planning by:
- Aligning budgets with business goals
- Identifying cost optimization opportunities
- Supporting scenario planning
- Improving long-term financial stability
As a result, finance teams move from reporting to strategic partnership.
Conclusion: Why Every Organization Needs a Budget Forecasting Dashboard in Power BI
A Budget Forecasting Dashboard in Power BI transforms how organizations plan, track, and control budgets. Instead of reacting to overspending after it happens, finance teams act early with confidence.
Because the dashboard combines real-time KPIs, department analysis, category insights, budget status tracking, and monthly trends, it delivers a complete financial view in one place.
If your organization wants better budget control, accurate forecasts, and smarter financial decisions, this dashboard becomes an essential solution.
Frequently Asked Questions About Budget Forecasting Dashboard in Power BI
What is the main purpose of a Budget Forecasting Dashboard in Power BI?
The main purpose is to compare budget, forecast, and actual amounts in real time and support better financial decisions.
Can small businesses use this dashboard?
Yes, small businesses can use it because Power BI scales easily and works well with Excel-based data.
Does this dashboard replace Excel budgeting?
No, it complements Excel by converting raw data into interactive insights.
How often should forecasts be updated?
Finance teams should review and update forecasts monthly or whenever spending patterns change.
Is Power BI required to view the dashboard?
Yes, users need Power BI Desktop or Power BI Service access to view and interact with the dashboard.
Can this dashboard track multiple years?
Yes, with proper data modeling, it can track multiple financial years easily.
Click to buy Budget Forecasting Dashboard in Power BI
Visit our YouTube channel to learn step-by-step video tutorials
Watch the step-by-step video tutorial: