The robotics industry grows rapidly across manufacturing, automation, logistics, healthcare, and smart factories. Because competition increases every year, organizations must track performance carefully. However, when teams manage KPIs using scattered files or manual reports, they lose visibility and control. Therefore, businesses now rely on a Robotics Industry KPI Scorecard in Excel to monitor performance clearly and consistently.
A structured KPI scorecard helps robotics companies measure efficiency, quality, cost, and growth using data-driven insights. Moreover, Excel makes KPI tracking simple, flexible, and cost-effective. As a result, managers and analysts can focus on decision-making instead of manual calculations.
In this detailed article, you will learn everything about the Robotics Industry KPI Scorecard in Excel, including how it works, its worksheets, advantages, best practices, and frequently asked questions.
Click to Purchases Robotics Industry KPI Scorecard in Excel
What Is a Robotics Industry KPI Scorecard in Excel?
A Robotics Industry KPI Scorecard in Excel is a ready-to-use performance management template designed specifically for robotics and automation-focused organizations. It helps teams track, analyze, and compare key performance indicators using Month-to-Date (MTD) and Year-to-Date (YTD) metrics.
Instead of reviewing static reports, teams use this Excel scorecard to:
-
Compare actual vs target values
-
Monitor performance trends
-
Identify gaps quickly
-
Take corrective actions on time
Because Excel supports formulas, charts, and conditional formatting, this scorecard delivers powerful insights without complex tools.
Why Is KPI Tracking Important in the Robotics Industry?
The robotics industry operates in a high-precision and high-investment environment. Therefore, even small performance gaps can impact cost, delivery, and customer satisfaction.
A KPI scorecard becomes essential because it helps organizations:
-
Track operational efficiency
-
Monitor production quality
-
Control costs and timelines
-
Align teams with business goals
Moreover, KPI tracking ensures transparency across engineering, production, quality, and operations teams.
Click to Purchases Robotics Industry KPI Scorecard in Excel
How Does a Robotics Industry KPI Scorecard in Excel Work?
The scorecard works by combining structured data entry with automated calculations and visuals.
Here is how it works step by step:
-
First, users enter actual and target KPI values in the input sheet.
-
Next, Excel calculates MTD and YTD values automatically.
-
Then, the scorecard compares actual vs target results.
-
Finally, visual indicators highlight performance status instantly.
As a result, managers get a clear and actionable performance overview.
Click to Purchases Robotics Industry KPI Scorecard in Excel
What Are the Key Worksheets in a Robotics Industry KPI Scorecard in Excel?
This Robotics Industry KPI Scorecard in Excel includes four well-structured worksheets, each designed for a specific purpose.
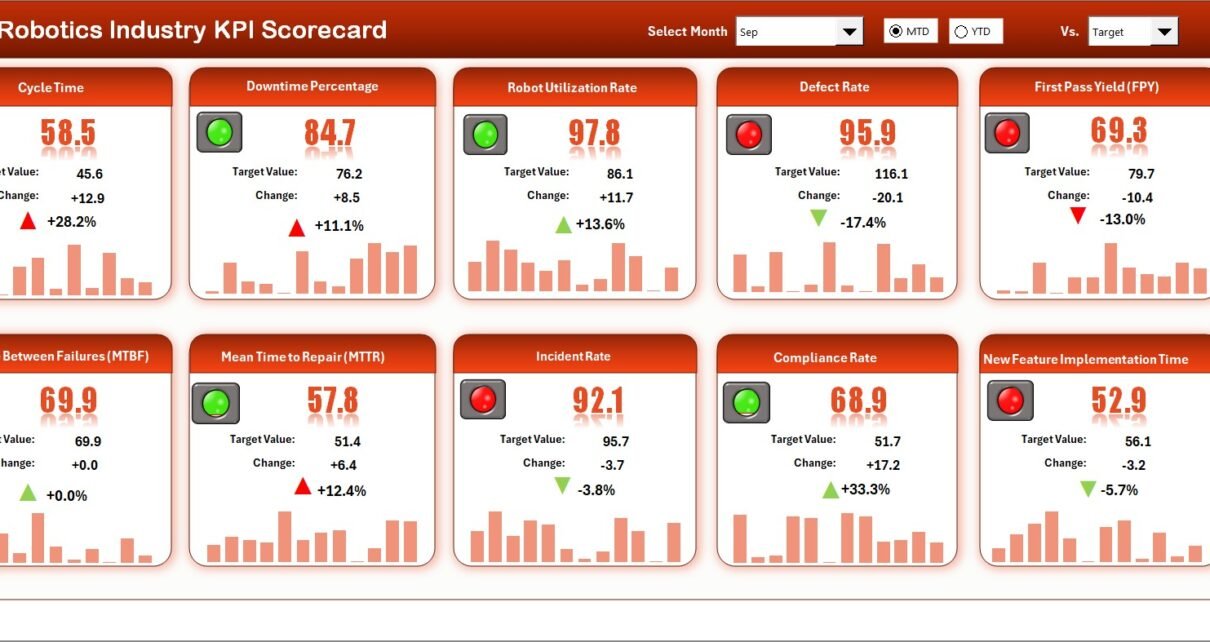
What Is the Scorecard Sheet and How Does It Help?
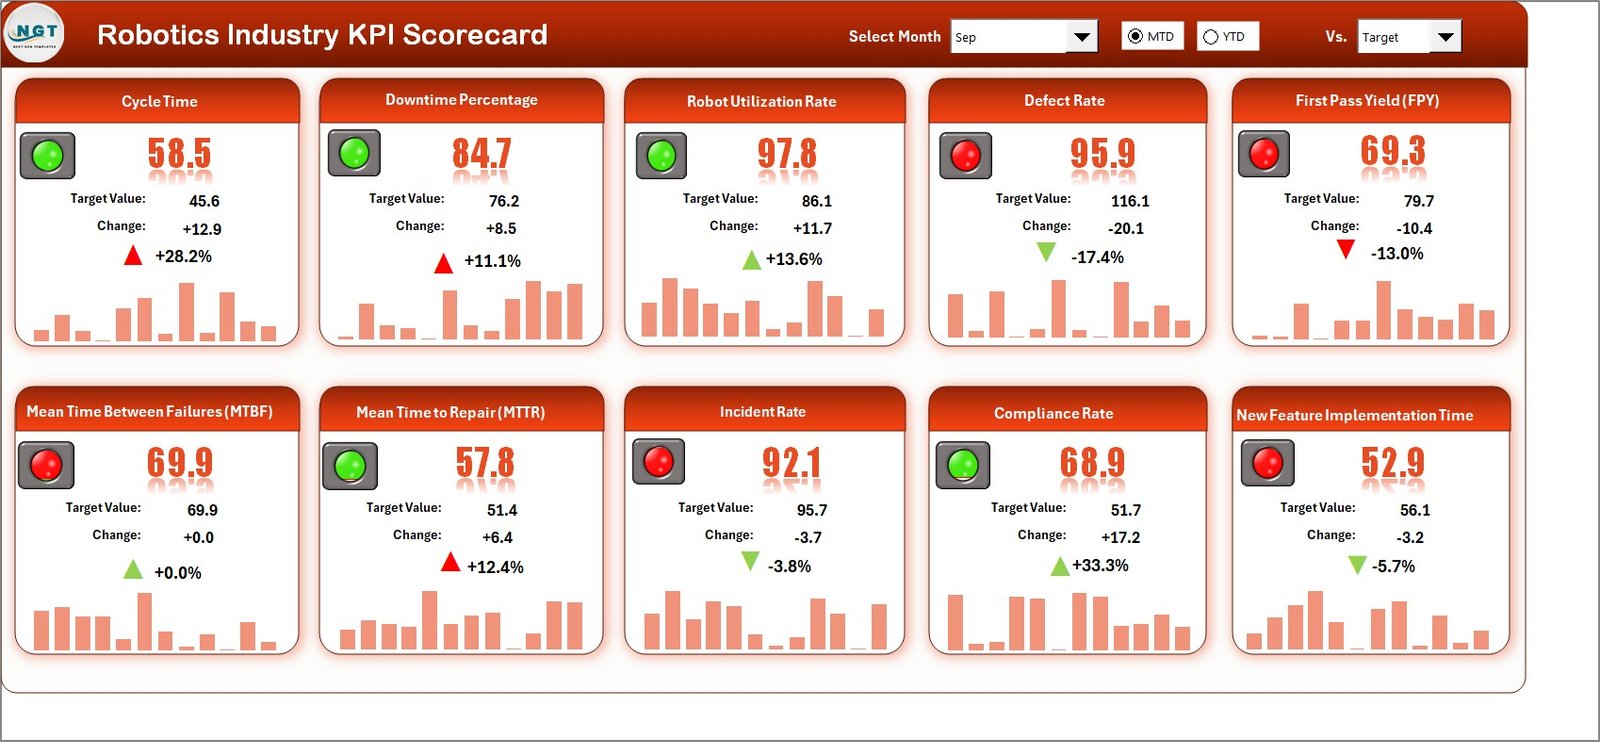
The Scorecard Sheet acts as the main interface of the KPI scorecard. It displays overall KPI performance in a clean and structured format.
Key Features of the Scorecard Sheet
Dropdown Menus for Period Selection
Users can select:
-
Month
-
MTD (Month-to-Date)
-
YTD (Year-to-Date)
Because of this flexibility, users can analyze short-term and long-term performance easily.
Actual vs Target Comparison
For each KPI, the scorecard displays:
-
Actual values
-
Target values
-
Variance indicators
This comparison helps teams identify performance gaps immediately.
Visual Indicators for Quick Insights
Color-coded indicators and conditional formatting highlight:
-
Target met
-
Target missed
-
Performance trends
Therefore, users understand performance status at a glance.
Comprehensive KPI Overview
The scorecard shows:
-
KPI Name
-
KPI Group
-
Unit of measurement
-
MTD and YTD results
Because everything appears on one screen, reviews become faster and more effective.
Click to Purchases Robotics Industry KPI Scorecard in Excel
What Is the KPI Trend Sheet and Why Is It Important?
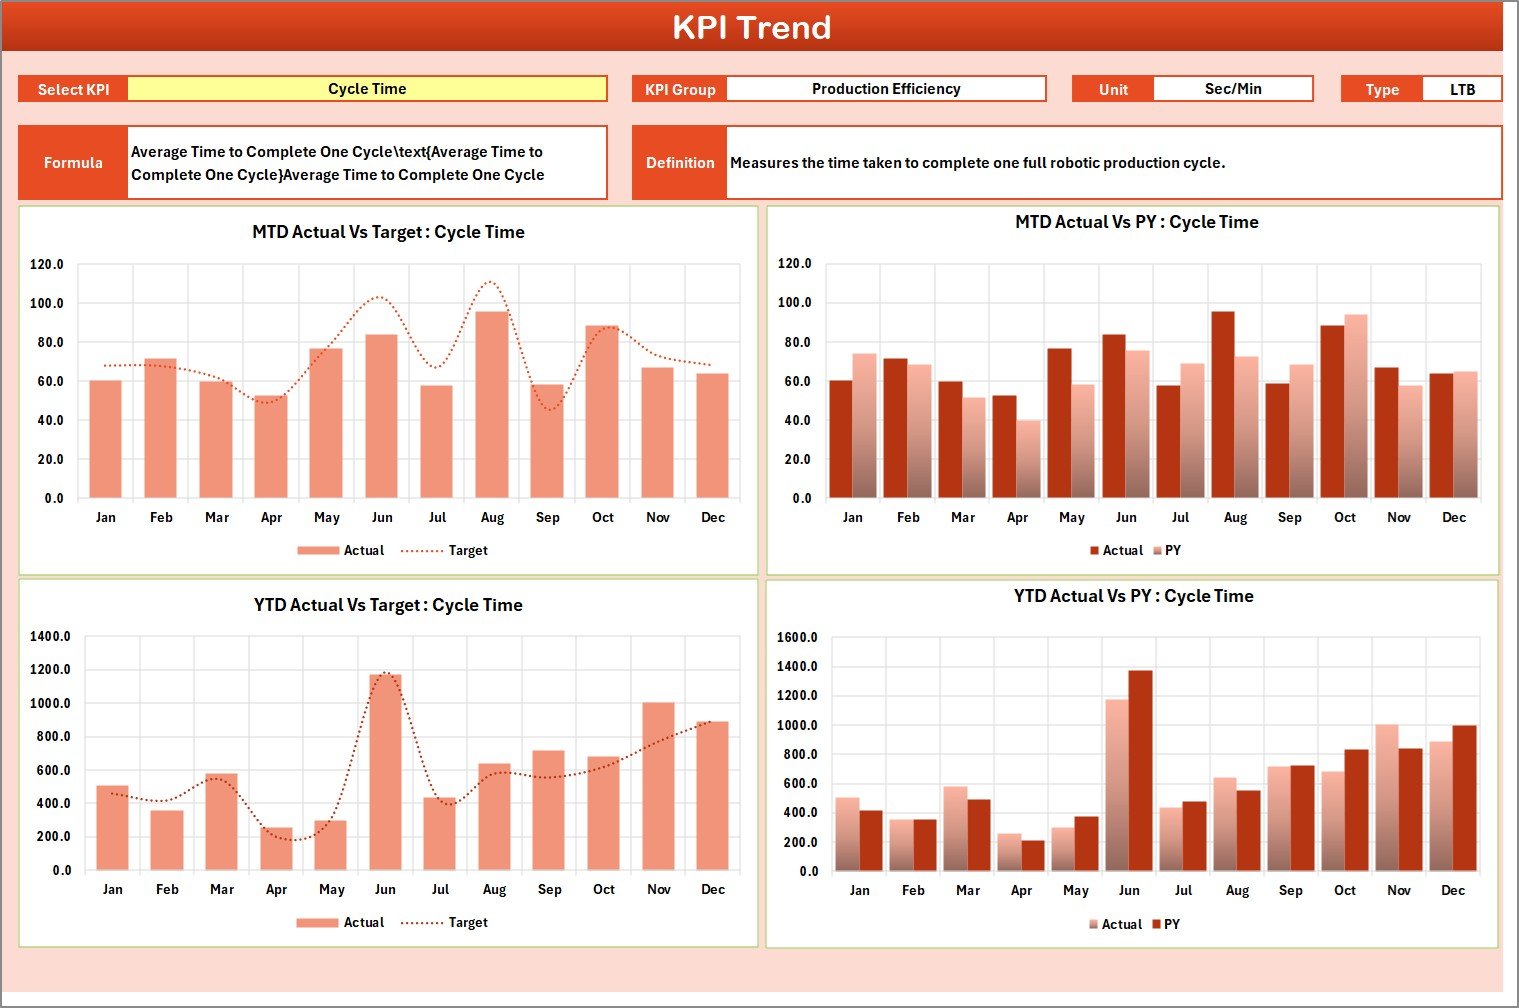
The KPI Trend Sheet focuses on performance trends over time. This sheet helps users understand whether performance improves, declines, or remains stable.
Key Features of the KPI Trend Sheet
KPI Selection Dropdown
Users select the KPI name from a dropdown available in range C3. As soon as they select a KPI, all related information updates automatically.
Detailed KPI Information Display
The sheet displays:
-
KPI Group
-
KPI Unit
-
KPI Type (Lower the Better or Upper the Better)
-
KPI Formula
-
KPI Definition
This information helps users understand the KPI clearly before analyzing trends.
MTD and YTD Trend Charts
The sheet shows trend charts for:
-
Actual values
-
Target values
-
Previous Year (PY) values
Because of these charts, users can compare current performance with historical data easily.
Click to Purchases Robotics Industry KPI Scorecard in Excel
How Does the Input Data Sheet Support Accurate KPI Tracking?
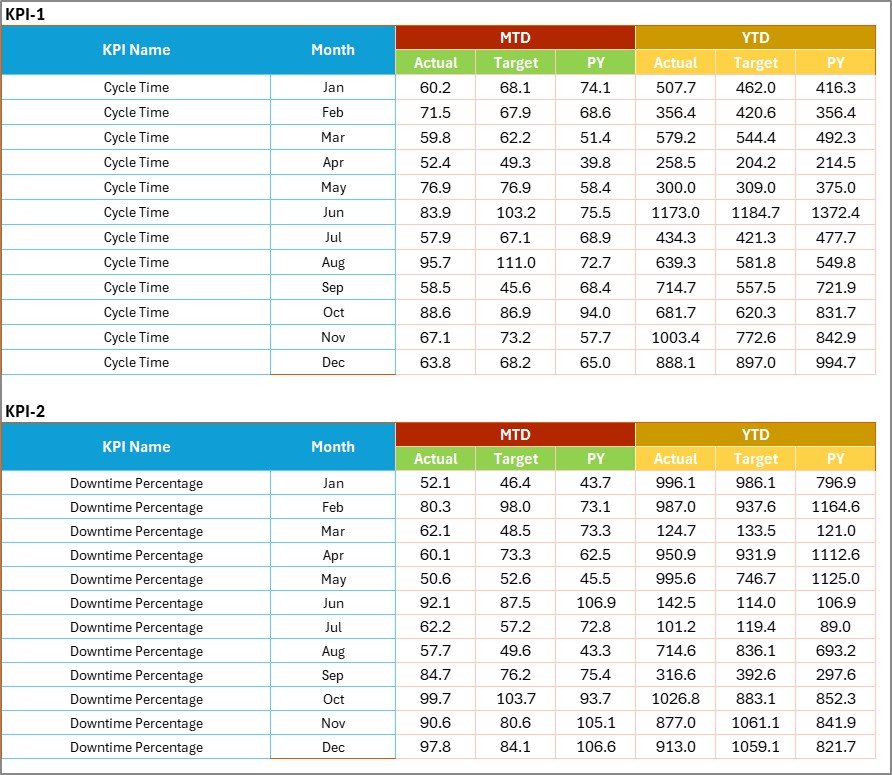
The Input Data Sheet acts as the data foundation of the scorecard.
Key Features of the Input Data Sheet
Structured Data Entry
Users record:
-
Actual KPI values
-
Target values
-
Time-based data
Because data entry remains structured, calculation errors reduce significantly.
Easy Updates
Users can update data whenever new results become available. Therefore, the scorecard always remains current and reliable.
Flexibility for Expansion
Teams can add new KPIs or periods without rebuilding the entire scorecard.
What Is the KPI Definition Sheet and Why Is It Needed?
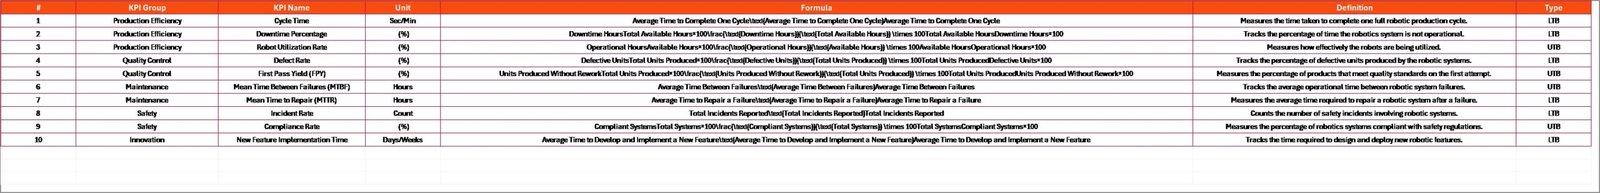
The KPI Definition Sheet ensures clarity and consistency across the scorecard.
Key Information Stored in the KPI Definition Sheet
-
KPI Name
-
KPI Group
-
Unit of Measurement
-
Formula
-
KPI Definition
Because of this sheet, users avoid confusion and misinterpretation of KPIs.
How Does This KPI Scorecard Improve Robotics Industry Performance?
A Robotics Industry KPI Scorecard in Excel improves performance by turning raw data into actionable insights.
It helps organizations:
-
Monitor operational efficiency
-
Improve production quality
-
Reduce downtime and delays
-
Align KPIs with strategic goals
Moreover, because Excel updates values instantly, teams respond faster to performance issues.
Who Should Use a Robotics Industry KPI Scorecard in Excel?
This KPI scorecard suits various professionals, including:
-
Robotics Operations Managers
-
Manufacturing Managers
-
Automation Engineers
-
Quality Assurance Teams
-
Plant Heads
-
Business Analysts
Because Excel remains familiar, adoption becomes quick and easy.
Click to Purchases Robotics Industry KPI Scorecard in Excel
Advantages of Robotics Industry KPI Scorecard in Excel
Using a Robotics Industry KPI Scorecard in Excel offers several business advantages.
1. Centralized KPI Monitoring
All KPIs remain available in one structured dashboard.
2. Faster Performance Reviews
Visual indicators and charts reduce analysis time significantly.
3. Improved Decision-Making
Real-time comparisons help managers take timely corrective actions.
4. Cost-Effective Solution
Excel eliminates the need for expensive KPI software.
5. Easy Customization
Teams can modify KPIs, targets, and layouts easily.
6. Better Accountability
Clear targets and results improve ownership and responsibility.
7. Scalable for Growing Organizations
The scorecard grows easily as KPI requirements expand.
How Can You Customize a Robotics Industry KPI Scorecard in Excel?
Customization allows organizations to tailor the scorecard to their specific needs.
You can:
-
Add new KPIs
-
Change KPI groups
-
Adjust targets
-
Modify charts and visuals
-
Add conditional formatting rules
Therefore, the scorecard adapts as business requirements evolve.
How Does MTD and YTD Analysis Help Robotics Companies?
MTD and YTD analysis provides different perspectives on performance.
-
MTD analysis helps track short-term operational efficiency.
-
YTD analysis helps evaluate long-term strategic progress.
Because both views appear in the scorecard, managers gain a complete performance picture.
Click to Purchases Robotics Industry KPI Scorecard in Excel
What Are the Best Practices for Robotics Industry KPI Scorecard in Excel?
Following best practices ensures maximum value from the scorecard.
1. Define KPIs Clearly
Always document KPI definitions and formulas properly.
2. Update Data Regularly
Frequent updates keep insights accurate and reliable.
3. Review Trends Monthly
Monthly reviews help detect performance issues early.
4. Align KPIs with Business Goals
Ensure every KPI supports strategic objectives.
5. Use Visual Indicators Wisely
Keep visuals simple and easy to understand.
6. Protect Formula Cells
Lock calculation cells to avoid accidental changes.
7. Train Users Briefly
A short walkthrough improves adoption and accuracy.
How Does This Scorecard Support Management Reviews?
The scorecard simplifies management reviews by:
-
Presenting KPIs clearly
-
Highlighting gaps visually
-
Supporting data-driven discussions
As a result, meetings become focused and productive.
When Should Organizations Use a Robotics KPI Scorecard?
Organizations should use this scorecard when:
-
KPI tracking becomes manual
-
Performance visibility decreases
-
Decision-making slows down
-
Robotics operations scale rapidly
Therefore, the scorecard acts as a control and improvement tool.
Conclusion: Why Is a Robotics Industry KPI Scorecard in Excel Essential?
A Robotics Industry KPI Scorecard in Excel provides a structured, visual, and data-driven way to track performance across robotics operations. Instead of relying on scattered reports, organizations gain a single source of truth for KPI monitoring.
Moreover, because Excel remains flexible and familiar, teams adopt the scorecard quickly. When used consistently, this KPI scorecard improves transparency, accountability, and overall business performance.
Click to Purchases Robotics Industry KPI Scorecard in Excel
Frequently Asked Questions About Robotics Industry KPI Scorecard in Excel
What Is the Purpose of a Robotics Industry KPI Scorecard in Excel?
The purpose is to track, analyze, and compare robotics KPIs using MTD and YTD metrics in one dashboard.
Can Small Robotics Companies Use This Scorecard?
Yes, small and mid-sized companies benefit because it requires no additional software.
Does the Scorecard Require VBA or Macros?
No, the scorecard works using standard Excel formulas and charts.
Can Users Add New KPIs Easily?
Yes, users can add or modify KPIs in the input and definition sheets.
How Often Should Data Be Updated?
Teams should update data monthly or as frequently as required.
Can This Scorecard Be Used for Management Reporting?
Yes, it works perfectly for monthly and quarterly management reviews.
Is This Scorecard Customizable for Different Robotics Segments?
Yes, it can be customized for manufacturing, automation, logistics, or R&D KPIs.
Click to Purchases Robotics Industry KPI Scorecard in Excel
Visit our YouTube channel to learn step-by-step video tutorials