Tax litigation continues to challenge businesses, professionals, and organizations across industries. Because tax laws change frequently and compliance scrutiny keeps increasing, companies must track tax disputes with clarity and accuracy. However, when teams rely on scattered Excel files, emails, or manual reports, they often miss deadlines, lose visibility, and struggle to measure performance.
That is exactly where a Tax Litigation KPI Dashboard in Excel becomes a powerful and practical solution.
In this detailed article, you will learn what a Tax Litigation KPI Dashboard in Excel is, why it matters, how it works, its structure, key features, advantages, best practices, and common questions. By the end, you will clearly understand how this dashboard supports better tax dispute management and smarter decision-making.
What Is a Tax Litigation KPI Dashboard in Excel?
A Tax Litigation KPI Dashboard in Excel is a structured, interactive reporting tool designed to track, monitor, and analyze key performance indicators related to tax disputes and litigation cases.
Instead of reviewing multiple spreadsheets or static reports, users analyze all tax litigation KPIs in one centralized Excel dashboard. As a result, tax teams gain instant visibility into case status, performance trends, and compliance outcomes.
Moreover, because Excel supports formulas, drop-downs, charts, and conditional formatting, this dashboard delivers real-time insights without complex software.
Why Do Organizations Need a Tax Litigation KPI Dashboard in Excel?
Tax litigation involves strict timelines, high financial risk, and regulatory pressure. Therefore, organizations must monitor their litigation performance continuously.
Here is why a Tax Litigation KPI Dashboard in Excel becomes essential:
- It centralizes all tax litigation KPIs in one place
- It reduces manual tracking errors
- It improves visibility across months and years
- It supports faster and more accurate decisions
- It strengthens compliance and audit readiness
Without a proper dashboard, teams often rely on reactive reporting. However, with this Excel-based solution, organizations move toward proactive tax litigation management.
How Does a Tax Litigation KPI Dashboard in Excel Work?
The Tax Litigation KPI Dashboard in Excel works by connecting input sheets with dynamic dashboard visuals.
First, users enter actual numbers, targets, and previous year values. Then, Excel formulas calculate Month-to-Date (MTD) and Year-to-Date (YTD) results. Finally, the dashboard displays these results using tables, arrows, and charts.
Because the dashboard uses drop-down selectors, users can instantly change the month or KPI and see updated results. As a result, analysis becomes fast, flexible, and reliable.
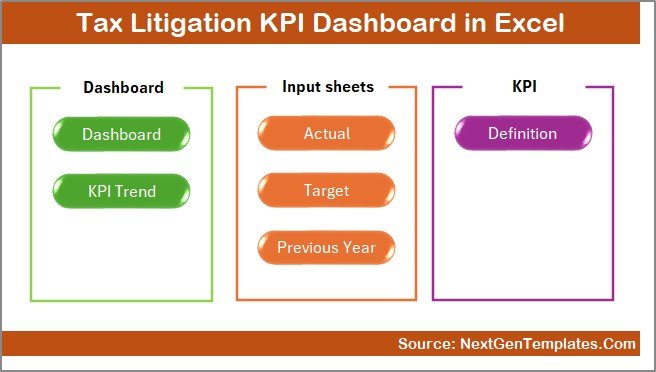
What Are the Key Features of a Tax Litigation KPI Dashboard in Excel?
This dashboard includes seven well-structured worksheets, each serving a specific purpose. Together, they create a complete and professional tax litigation performance solution.
Summary Page
The Summary Page acts as the index sheet of the dashboard.
Key Highlights of the Summary Page
- Provides six navigation buttons
- Allows quick movement between dashboard sections
- Improves usability and user experience
- Reduces time spent searching for sheets
Because navigation matters, this page ensures users access the right information instantly.
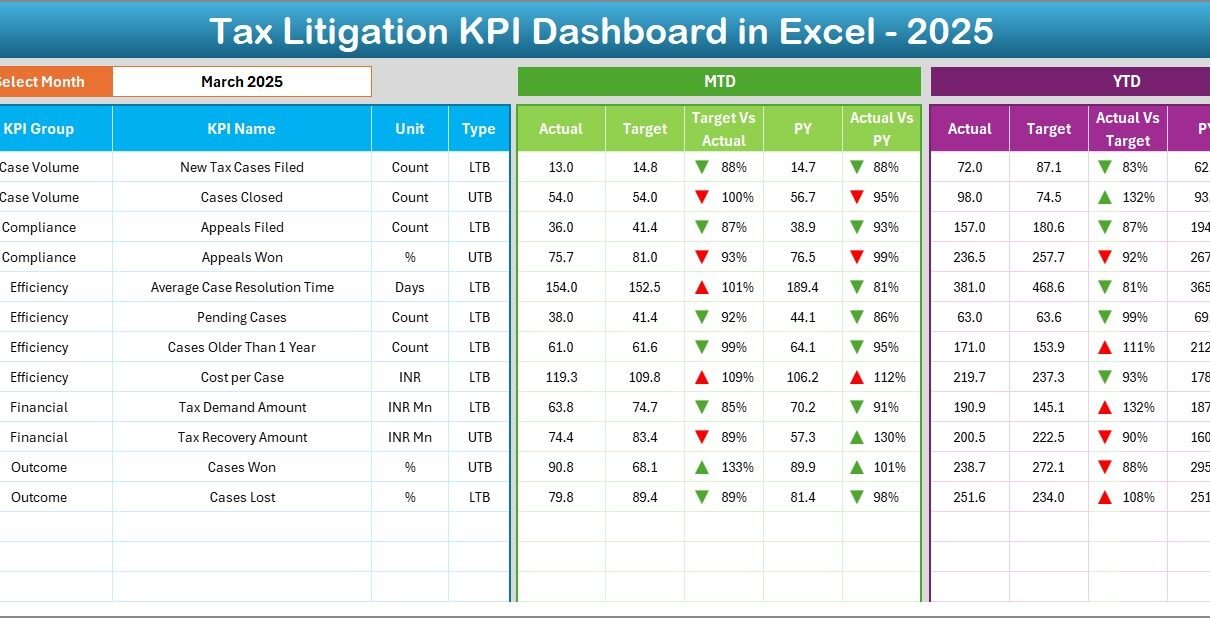
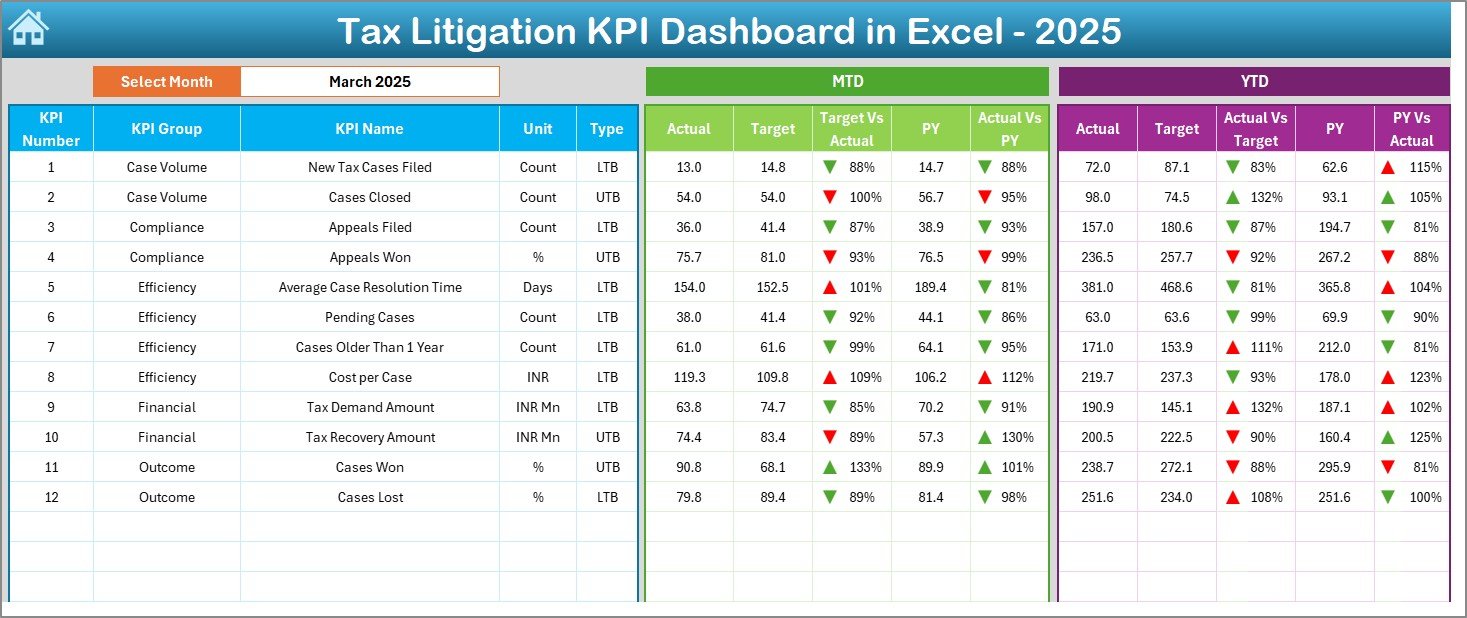
Dashboard Sheet
The Dashboard Sheet serves as the core of the Tax Litigation KPI Dashboard in Excel.
Key Functionalities of the Dashboard Sheet
- Month selection using a drop-down at cell D3
- Automatic update of all KPIs based on the selected month
- Display of MTD Actual, Target, and Previous Year values
- Display of YTD Actual, Target, and Previous Year values
- Visual comparison using Target vs Actual
- Visual comparison using Previous Year vs Actual
- Conditional formatting with up and down arrows
Because of these features, users instantly identify performance gaps, improvements, and risks.
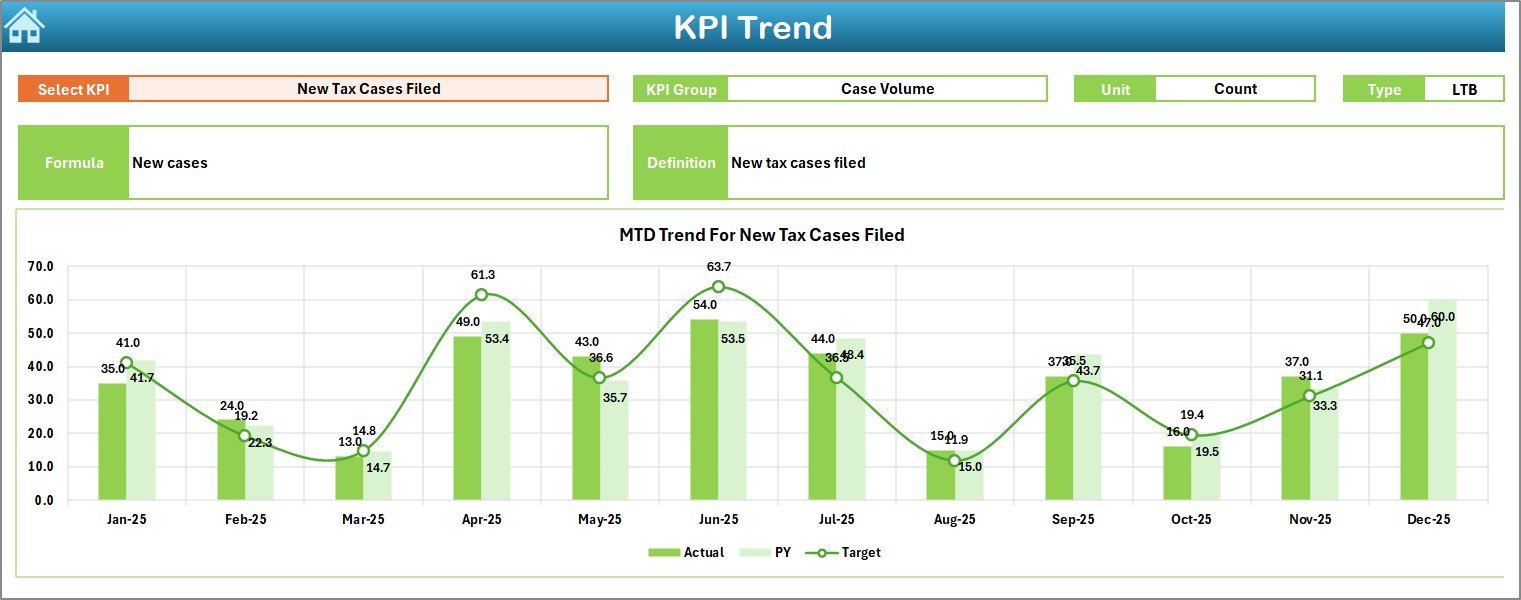
Trend Sheet
The Trend Sheet focuses on detailed KPI-level analysis.
Key Elements of the Trend Sheet
- KPI selection drop-down at C3
- Display of KPI Group
- Display of KPI Unit
- Display of KPI Type (Lower the Better or Upper the Better)
- Display of KPI Formula
- Display of KPI Definition
- MTD trend chart for Actual, Target, and PY
- YTD trend chart for Actual, Target, and PY
Because trends reveal patterns, this sheet helps users analyze performance over time rather than relying on single-month values.
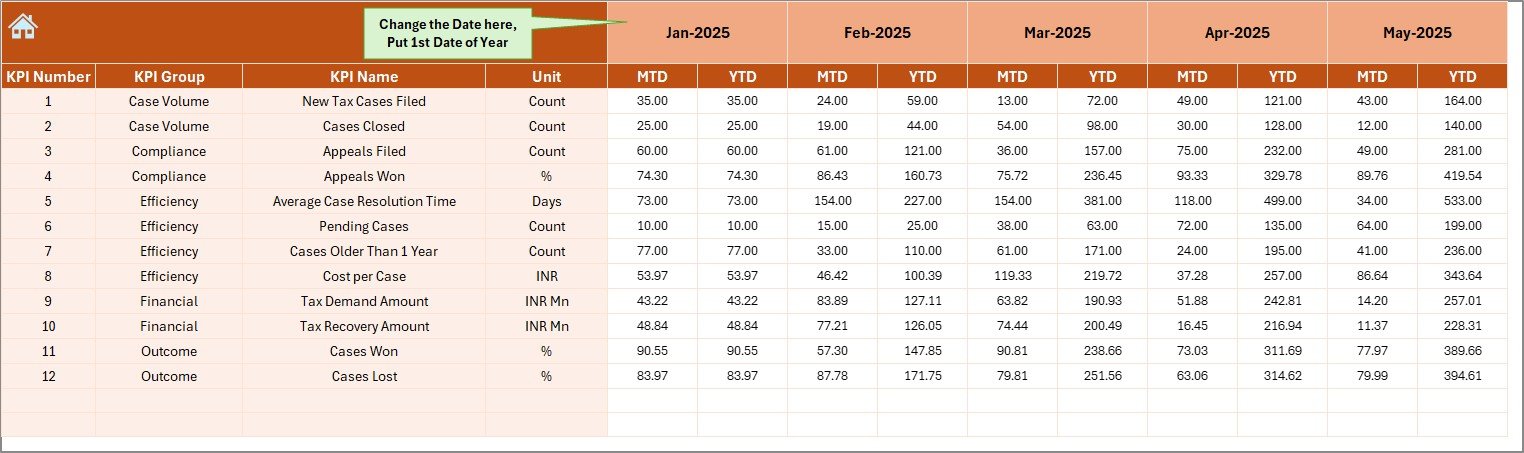
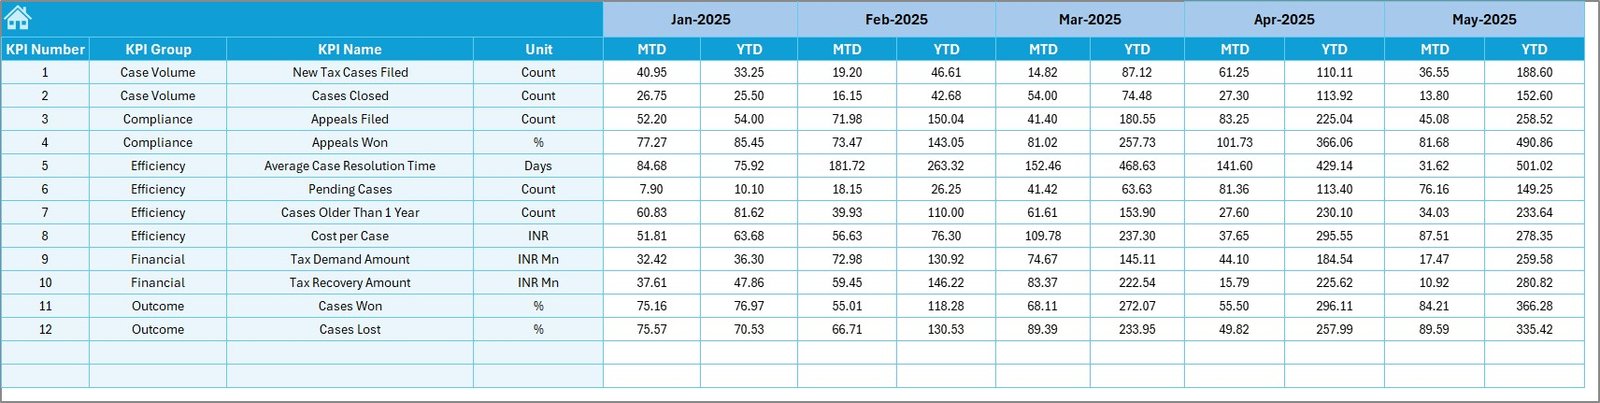
Actual Numbers Input
The Actual Numbers Input Sheet captures real performance data.
How This Sheet Works
- Users enter actual MTD and YTD values
- Month selection available in cell E1
- Users define the first month of the year in E1
- Data updates dynamically across the dashboard
Because accurate inputs drive accurate insights, this sheet plays a critical role.
Target Sheet
The Target Sheet stores benchmark values for each KPI.
Purpose of the Target Sheet
- Enter monthly MTD targets
- Enter cumulative YTD targets
- Enable performance comparison
- Support goal-based analysis
By comparing actual results with targets, organizations identify underperformance early.
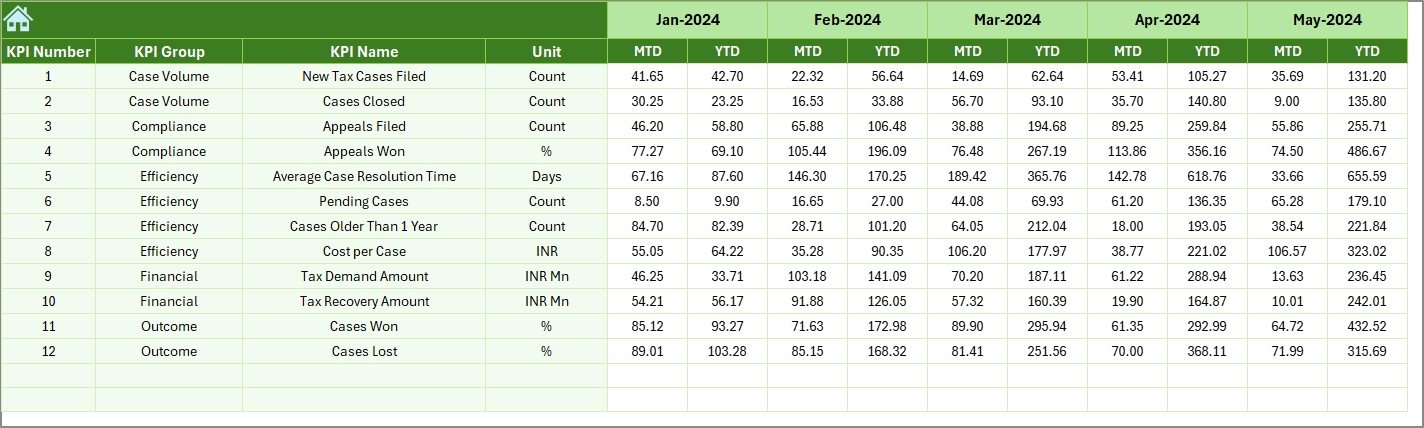
Previous Year Number
The Previous Year Number Sheet enables historical comparison.
Benefits of This Sheet
- Stores previous year MTD values
- Stores previous year YTD values
- Helps track year-over-year improvement
- Supports trend and variance analysis
Because historical data adds context, this sheet strengthens decision-making.
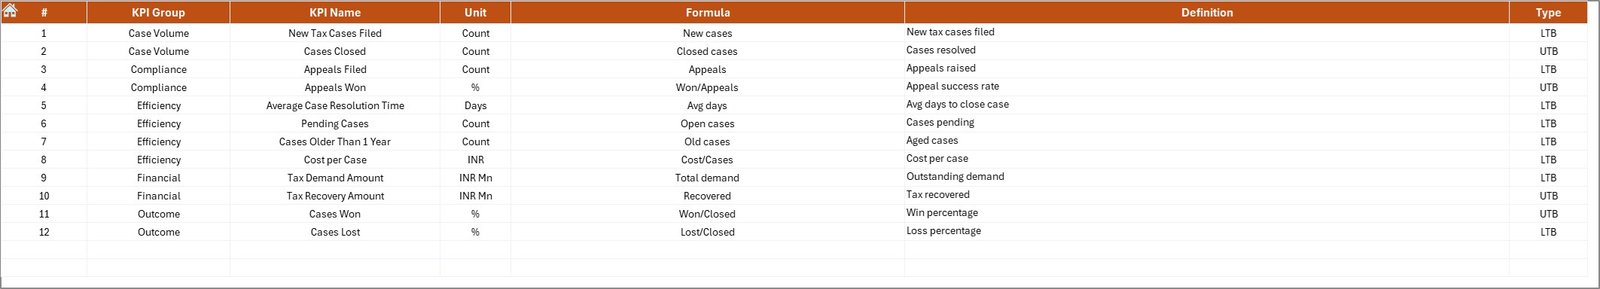
KPI Definition Sheet
The KPI Definition Sheet acts as the knowledge base of the dashboard.
Information Stored in the KPI Definition Sheet
- KPI Name
- KPI Group
- Unit of Measurement
- Formula
- KPI Definition
- KPI Type (LTB or UTB)
Because clarity matters, this sheet ensures everyone understands what each KPI represents.
Which KPIs Can You Track Using a Tax Litigation KPI Dashboard in Excel?
A Tax Litigation KPI Dashboard in Excel supports a wide range of litigation-related KPIs, such as:
- Number of active tax cases
- Tax demand under dispute
- Cases resolved within timeline
- Success rate of appeals
- Average case resolution time
- Penalty reduction percentage
- Litigation cost efficiency
Because the KPI Definition Sheet remains flexible, organizations can customize KPIs as needed.
Advantages of a Tax Litigation KPI Dashboard in Excel
Why Should You Use a Tax Litigation KPI Dashboard in Excel?
Using this dashboard delivers several practical benefits:
- Centralized tracking of tax litigation KPIs
- Improved visibility across MTD and YTD performance
- Faster identification of risks and delays
- Better comparison with targets and past performance
- Easy customization without advanced tools
- Cost-effective alternative to complex software
Moreover, Excel familiarity ensures quick adoption across teams.
How Does This Dashboard Improve Decision-Making?
Because the dashboard updates dynamically, decision-makers:
- Spot problem areas early
- Track progress against goals
- Allocate resources more effectively
- Improve litigation strategies
- Reduce compliance risks
As a result, decisions become data-driven instead of assumption-based.
Best Practices for the Tax Litigation KPI Dashboard in Excel
To maximize the value of your dashboard, follow these best practices:
- Define Clear and Measurable KPIs
Choose KPIs that directly reflect litigation performance and outcomes.
- Maintain Consistent Data Entry
Ensure users follow a standard format while entering actual, target, and PY data.
- Update Data Regularly
Refresh the dashboard monthly to keep insights relevant.
- Review Trends, Not Just Numbers
Use the Trend Sheet to analyze patterns over time.
- Validate KPI Definitions
Keep formulas and definitions short, clear, and accurate.
- Use Conditional Formatting Wisely
Apply arrows and indicators consistently for easy interpretation.
- Limit Manual Changes in Dashboard Sheets
Restrict changes to input sheets only to avoid formula errors.
Who Can Use a Tax Litigation KPI Dashboard in Excel?
This dashboard suits multiple roles and industries:
- Tax managers and tax heads
- Finance and compliance teams
- Legal and litigation departments
- Audit professionals
- Consulting firms
Because Excel remains widely used, this dashboard fits both small teams and large enterprises.
How Is This Dashboard Better Than Manual Tracking?
Manual tracking creates delays, errors, and confusion. In contrast, this dashboard:
- Automates calculations
- Reduces duplication
- Improves transparency
- Saves time
- Enhances reporting quality
Therefore, organizations achieve better control over tax litigation activities.
Conclusion: Why Should You Use a Tax Litigation KPI Dashboard in Excel?
A Tax Litigation KPI Dashboard in Excel transforms how organizations manage tax disputes. Instead of juggling multiple files, teams gain a structured, visual, and reliable reporting system.
Because the dashboard tracks MTD, YTD, targets, and previous year values, it supports informed decisions and proactive compliance. Moreover, its flexible design allows easy customization for different tax environments.
If you want clarity, control, and confidence in tax litigation management, this Excel dashboard becomes an essential tool.
Frequently Asked Questions (FAQs)
What is a Tax Litigation KPI Dashboard in Excel used for?
It helps track, analyze, and monitor tax litigation KPIs in one centralized Excel file.
Can I customize KPIs in the dashboard?
Yes, you can easily modify or add KPIs using the KPI Definition Sheet.
Does the dashboard support month-wise analysis?
Yes, users can select the month using a drop-down, and all values update automatically.
Can I compare current performance with the previous year?
Yes, the dashboard includes previous year data for both MTD and YTD comparisons.
Is this dashboard suitable for non-technical users?
Yes, because it uses Excel features, most users can operate it without training.
How often should I update the dashboard?
You should update it monthly to maintain accurate and timely insights.
Visit our YouTube channel to learn step-by-step video tutorials
Watch the step-by-step video tutorial: