Managing a warehouse involves constant movement—inventory flows in, orders flow out, and data flows across systems. However, when warehouse data stays scattered across spreadsheets and manual reports, visibility drops and decisions slow down. That is exactly why businesses now rely on a Warehousing Dashboard in Power BI.
A Warehousing Dashboard in Power BI brings all warehouse-related data into one interactive, visual, and real-time reporting platform. Instead of spending hours preparing reports, managers instantly track inventory levels, transactions, storage utilization, and shipment delays. As a result, warehouses move from reactive operations to proactive performance management.
In this detailed guide, you will learn what a Warehousing Dashboard in Power BI is, why it is important, how it works, its dashboard structure, key pages, advantages, best practices, and frequently asked questions. By the end of this article, you will clearly understand how this dashboard improves efficiency, accuracy, and control across warehouse operations.
Click to Purchases Warehousing Dashboard in Power BI
What Is a Warehousing Dashboard in Power BI?
A Warehousing Dashboard in Power BI is an interactive analytics solution designed to monitor, analyze, and visualize warehouse performance metrics in real time.
Instead of reviewing static reports, warehouse managers use this dashboard to:
-
Monitor available stock levels
-
Track storage utilization across categories and locations
-
Analyze delayed shipments and order types
-
Review transaction volumes by zone, warehouse, and month
-
Identify operational bottlenecks quickly
Because Power BI supports dynamic filters, slicers, and visuals, users interact with data instead of simply viewing it. Therefore, warehouse teams gain faster insights and better control over daily operations.
Why Do Businesses Need a Warehousing Dashboard in Power BI?
Warehousing operations generate massive amounts of data every day. However, without a centralized reporting system, teams struggle to extract meaningful insights. That is where a Warehousing Dashboard in Power BI becomes essential.
Key Reasons Warehouses Need This Dashboard
-
Warehouse data often exists in multiple systems
-
Manual reports consume time and introduce errors
-
Managers need real-time visibility for quick decisions
-
Inventory and space optimization require accurate tracking
-
Leadership teams need summarized insights, not raw data
Because Power BI connects multiple data sources and refreshes automatically, the dashboard eliminates manual effort and improves reporting accuracy.
How Does a Warehousing Dashboard in Power BI Work?
A Warehousing Dashboard in Power BI works by connecting warehouse data sources and transforming them into interactive visuals.
Step-by-Step Workflow
-
Data Collection
Warehouse data comes from ERP systems, WMS, Excel files, or databases. -
Data Modeling
Power BI cleans, structures, and relates data tables for analysis. -
Visual Creation
Charts, cards, and tables display key warehouse KPIs. -
Filtering and Slicers
Users filter data by item category, storage type, warehouse name, or month. -
Insight Generation
Managers identify trends, issues, and opportunities instantly.
Because this process runs continuously, the dashboard always reflects the latest warehouse performance.
What Are the Key Pages in a Warehousing Dashboard in Power BI?
Click to Purchases Warehousing Dashboard in Power BI
A well-designed Warehousing Dashboard in Power BI follows a structured layout. In this dashboard, we use five analytical pages, each focusing on a specific operational view.
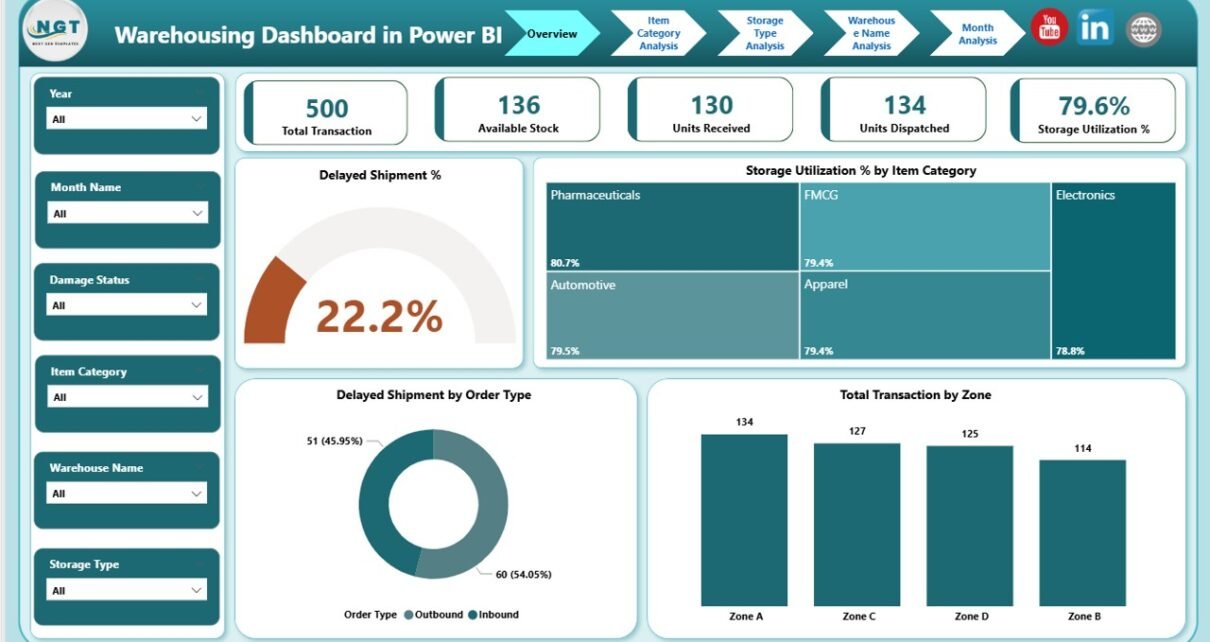
What Does the Overview Page Show in a Warehousing Dashboard in Power BI?
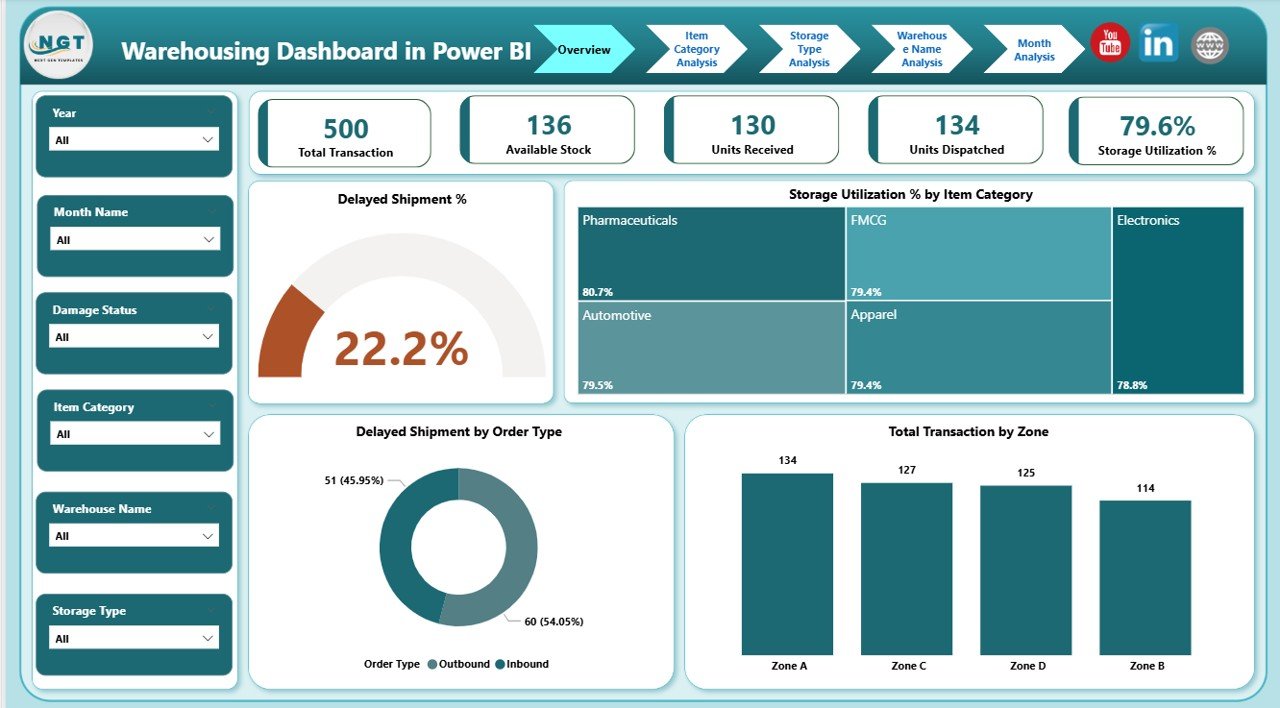
The Overview Page acts as the central control panel for warehouse performance. It provides a high-level snapshot of key metrics so decision-makers quickly understand the overall situation.
Key Features of the Overview Page
-
Interactive slicers for quick filtering
-
KPI cards for instant performance tracking
-
Summary charts for operational trends
KPIs and Visuals on the Overview Page
-
Delayed Shipment %
Shows the percentage of shipments delivered late. -
Storage Utilization % by Item Category
Displays how efficiently warehouse space is used. -
Delayed Shipment by Order Type
Identifies which order types cause delays. -
Total Transactions by Zone
Highlights activity levels across warehouse zones.
Because everything appears on one page, managers quickly spot issues and take action.
How Does Item Category Analysis Improve Inventory Insights?
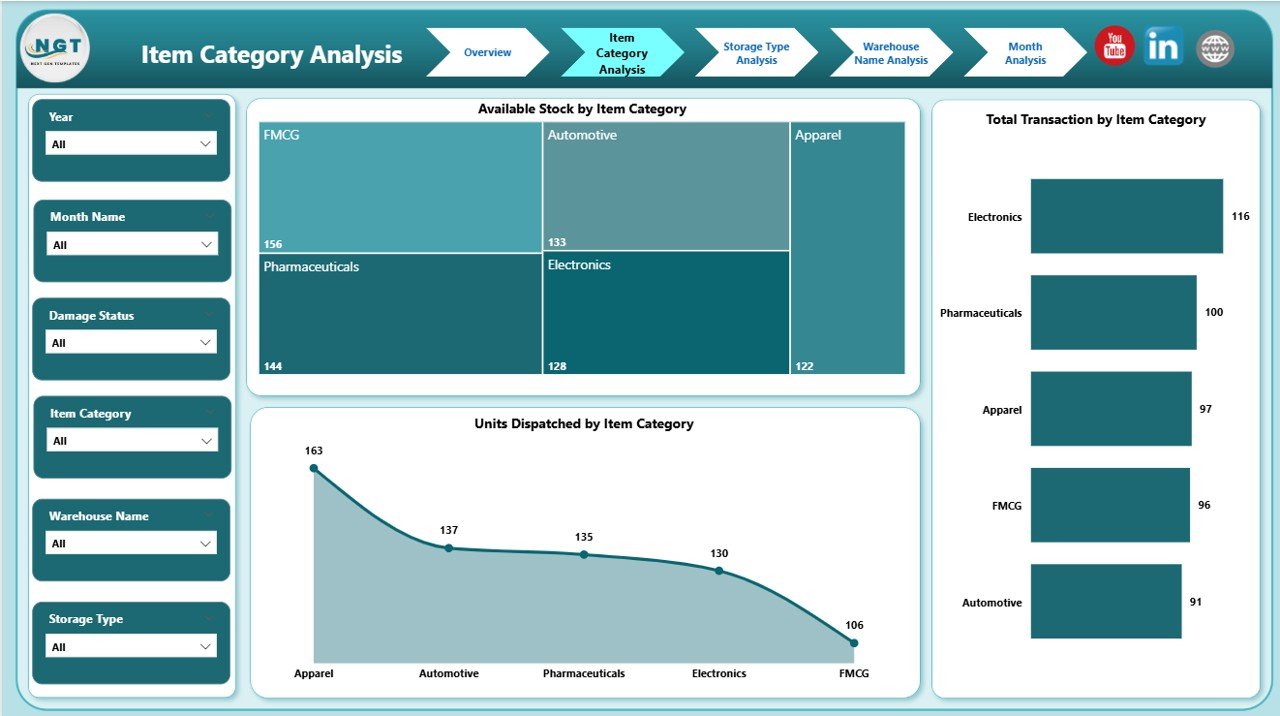
The Item Category Analysis Page focuses on inventory performance by product category. Instead of viewing stock as a single number, managers analyze category-level behavior.
Key Charts on the Item Category Analysis Page
-
Available Stock by Item Category
Shows inventory distribution across categories. -
Total Transactions by Item Category
Highlights high- and low-movement categories. -
Units Dispersion by Item Category
Displays how inventory spreads across categories.
Why This Page Matters
-
Helps identify fast-moving and slow-moving items
-
Supports demand planning and replenishment
-
Improves category-wise space allocation
As a result, warehouses balance stock levels more effectively.
What Insights Does Storage Type Analysis Provide?
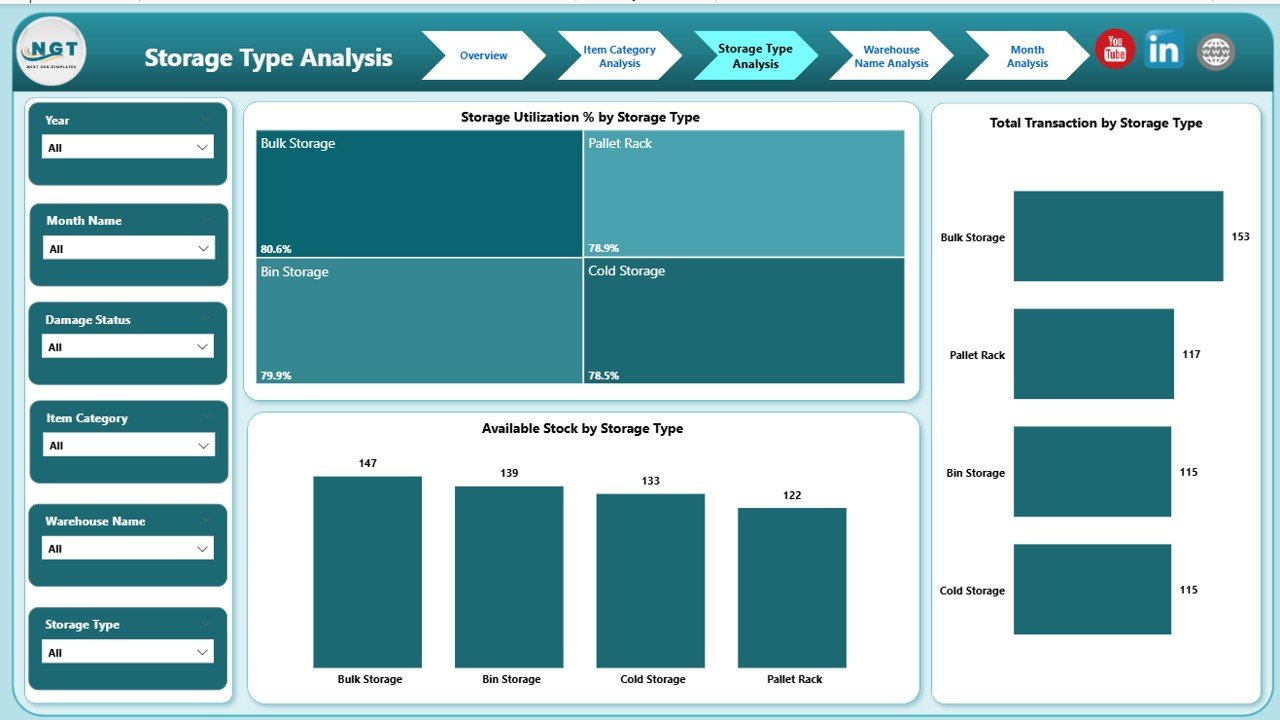
The Storage Type Analysis Page evaluates how different storage methods perform. Because warehouses use multiple storage types, this analysis becomes critical.
Key Charts on the Storage Type Analysis Page
-
Available Stock by Storage Type
Shows inventory held in each storage method. -
Total Transactions by Storage Type
Highlights operational activity by storage type. -
Storage Utilization % by Storage Type
Measures space efficiency.
Business Benefits of This Page
-
Identifies underutilized storage areas
-
Improves warehouse layout planning
-
Reduces congestion and wasted space
Therefore, warehouses optimize storage costs and efficiency.
Why Is Warehouse Name Analysis Important?
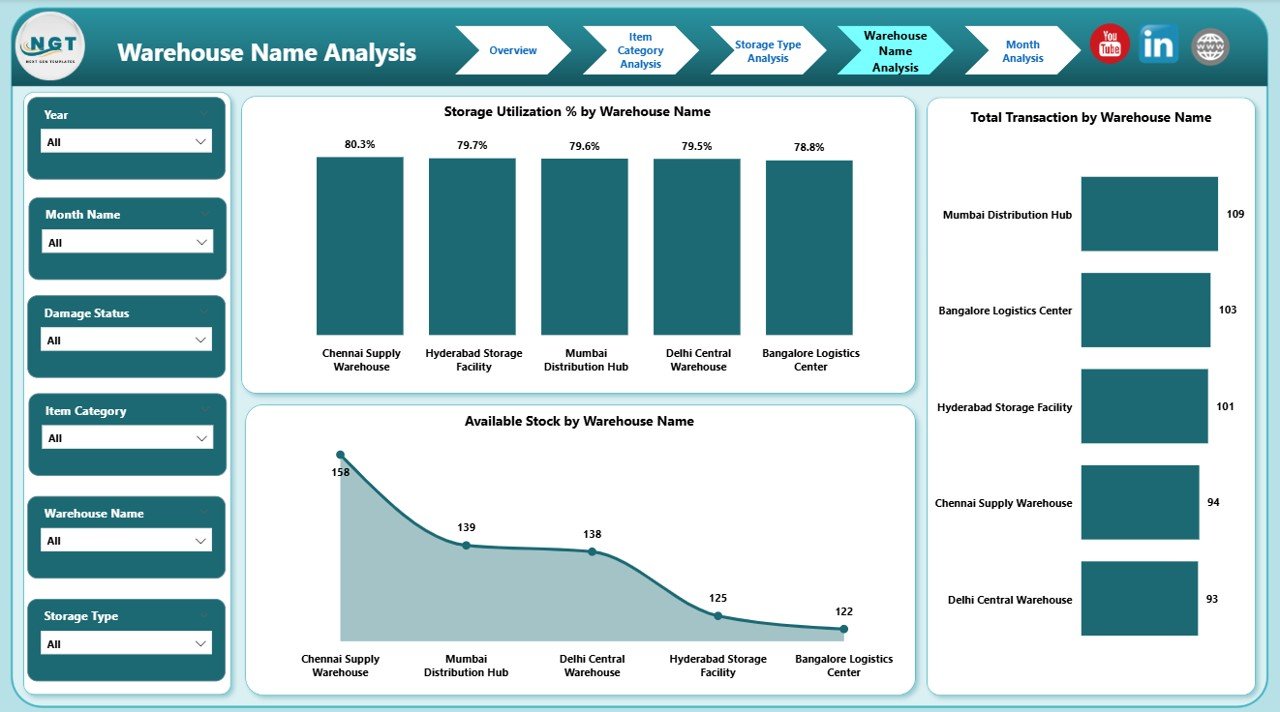
Large organizations operate multiple warehouses. The Warehouse Name Analysis Page compares performance across locations.
Key Charts on the Warehouse Name Analysis Page
-
Available Stock by Warehouse Name
Displays inventory levels by location. -
Total Transactions by Warehouse Name
Shows workload distribution. -
Storage Utilization % by Warehouse Name
Measures space efficiency per warehouse.
How This Page Helps Decision-Makers
-
Compares warehouse performance objectively
-
Identifies overstocked or underperforming locations
-
Supports strategic capacity planning
Consequently, leadership allocates resources more effectively.
How Does Month Analysis Support Trend Monitoring?
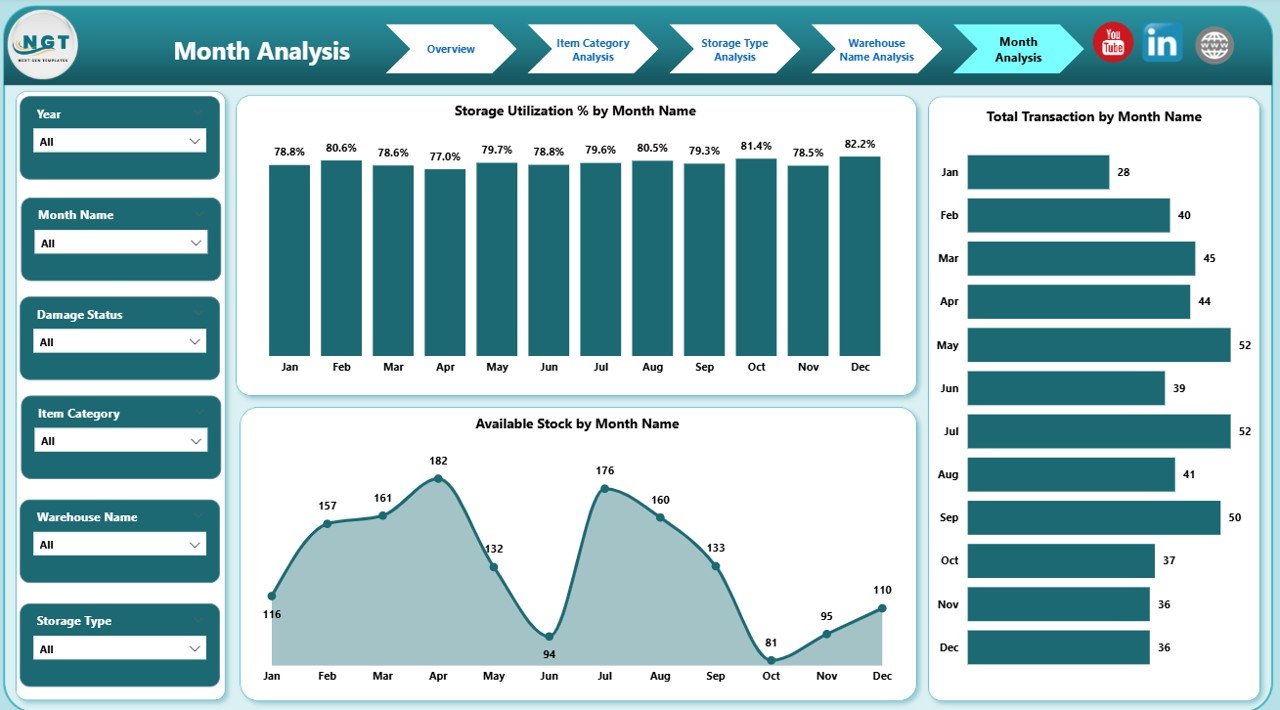
The Month Analysis Page focuses on time-based performance. Instead of static numbers, managers track trends over months.
Key Charts on the Month Analysis Page
Click to Purchases Warehousing Dashboard in Power BI
-
Available Stock by Month
Shows inventory movement trends. -
Total Transactions by Month
Highlights seasonality and demand patterns. -
Storage Utilization % by Month
Tracks space usage changes over time.
Why Monthly Analysis Matters
-
Identifies seasonal demand patterns
-
Supports forecasting and budgeting
-
Improves long-term planning
As a result, warehouses stay prepared for fluctuations.
Advantages of Warehousing Dashboard in Power BI
A Warehousing Dashboard in Power BI delivers measurable benefits across operations, management, and strategy.
Key Advantages
-
Centralized Reporting
All warehouse data stays in one dashboard. -
Real-Time Insights
Managers track performance instantly. -
Improved Inventory Control
Accurate stock visibility reduces shortages. -
Better Space Utilization
Storage optimization lowers operational costs. -
Faster Decision-Making
Visual insights replace manual analysis. -
Scalable Design
Dashboards grow with business needs.
Because of these advantages, warehouses operate more efficiently and profitably.
Best Practices for the Warehousing Dashboard in Power BI
To maximize the value of a Warehousing Dashboard in Power BI, businesses must follow proven best practices.
Best Practices to Follow
-
Define Clear KPIs
Focus on metrics that drive decisions. -
Use Clean and Structured Data
Ensure accurate and consistent inputs. -
Limit Visual Clutter
Keep dashboards simple and readable. -
Use Consistent Filters
Maintain uniform slicers across pages. -
Optimize Performance
Reduce unnecessary visuals and columns. -
Train End Users
Ensure teams understand how to use the dashboard.
By following these practices, organizations ensure long-term dashboard success.
How Does a Warehousing Dashboard in Power BI Improve Decision-Making?
A Warehousing Dashboard in Power BI turns raw data into actionable insights.
-
Managers quickly identify delayed shipments
-
Inventory planners adjust stock levels proactively
-
Operations teams optimize storage utilization
-
Leadership tracks performance across warehouses
Because insights appear instantly, decisions improve in speed and quality.
Who Should Use a Warehousing Dashboard in Power BI?
This dashboard supports multiple roles across the organization.
Primary Users
-
Warehouse Managers
-
Inventory Planners
-
Operations Heads
-
Supply Chain Analysts
-
Senior Leadership
Each user benefits from role-specific insights without technical complexity.
Conclusion: Why Should You Invest in a Warehousing Dashboard in Power BI?
A Warehousing Dashboard in Power BI transforms how warehouses manage data, performance, and decisions. Instead of relying on static reports, businesses gain a dynamic, visual, and real-time analytics solution.
With structured pages like Overview, Item Category Analysis, Storage Type Analysis, Warehouse Name Analysis, and Month Analysis, the dashboard delivers complete operational visibility. As a result, warehouses improve efficiency, reduce costs, and support data-driven growth.
If your warehouse operations demand speed, accuracy, and clarity, a Warehousing Dashboard in Power BI becomes a powerful and essential tool.
Frequently Asked Questions About Warehousing Dashboard in Power BI
What is the main purpose of a Warehousing Dashboard in Power BI?
The main purpose is to provide real-time visibility into inventory, transactions, storage utilization, and shipment performance.
Can small warehouses use a Warehousing Dashboard in Power BI?
Yes, small warehouses benefit greatly because Power BI scales easily and reduces manual reporting effort.
Does a Warehousing Dashboard in Power BI require technical expertise?
No, once built, end users interact with filters and visuals without technical skills.
How often does the data refresh in Power BI?
Data refresh depends on configuration and can occur daily, hourly, or in real time.
Can this dashboard integrate with ERP or WMS systems?
Yes, Power BI connects seamlessly with ERP, WMS, databases, and Excel files.
Is a Warehousing Dashboard in Power BI customizable?
Yes, businesses customize KPIs, visuals, and pages based on operational needs.
How does this dashboard improve inventory accuracy?
It provides centralized, real-time stock visibility, which reduces errors and mismatches.
Can the dashboard track multiple warehouses?
Yes, the Warehouse Name Analysis page supports multi-location tracking and comparison.
Visit our YouTube channel to learn step-by-step video tutorials