Influencer marketing has changed digital marketing completely. Brands no longer depend only on traditional ads. Instead, they collaborate with creators across platforms like Instagram, YouTube, and TikTok. However, many businesses still struggle to measure results properly.
As a result, they overspend. They miss trends. They fail to identify high-performing influencers.
That is exactly why an Influencer Marketing Dashboard in Excel becomes a powerful solution.
This ready-to-use Excel dashboard transforms raw campaign data into clear, actionable insights. Moreover, it helps you track budget, engagement, revenue, cost per conversion, and more — all in one structured system.
Click to Purchases Influencer Marketing Dashboard in Excel
In this detailed guide, you will learn:
-
What an Influencer Marketing Dashboard in Excel is
-
Why businesses need it
-
Dashboard structure and worksheet details
-
Key metrics included
-
Advantages of using it
-
Best practices for implementation
-
Frequently asked questions
Let’s dive in.
What Is an Influencer Marketing Dashboard in Excel?
An Influencer Marketing Dashboard in Excel is a structured performance tracking system designed to monitor and analyze influencer campaigns.
Instead of checking multiple spreadsheets, you can:
-
Track engagement rates
-
Monitor campaign budgets
-
Analyze revenue by platform
-
Compare campaign performance
-
Measure cost efficiency
Because Excel offers flexibility and automation, you can create dynamic reports using pivot tables, slicers, and charts. Therefore, you can make faster and smarter marketing decisions.
Why Do You Need an Influencer Marketing Dashboard?
Influencer campaigns involve multiple moving parts. You deal with:
-
Different platforms
-
Various content types
-
Multiple influencers
-
Regional markets
-
Campaign timelines
Without a dashboard, you lose visibility. However, with a structured Excel dashboard, you gain full control.
Here’s why it matters:
-
You identify top-performing campaigns quickly.
-
You optimize budget allocation effectively.
-
You compare platforms easily.
-
You improve ROI strategically.
As competition increases, structured analytics becomes essential.
Dashboard Structure: What Pages Are Included?
This Influencer Marketing Dashboard in Excel contains 5 interactive pages along with support and data sheets.
Moreover, a Page Navigator located on the left side allows smooth navigation between analytical pages.
Let us explore each page in detail.
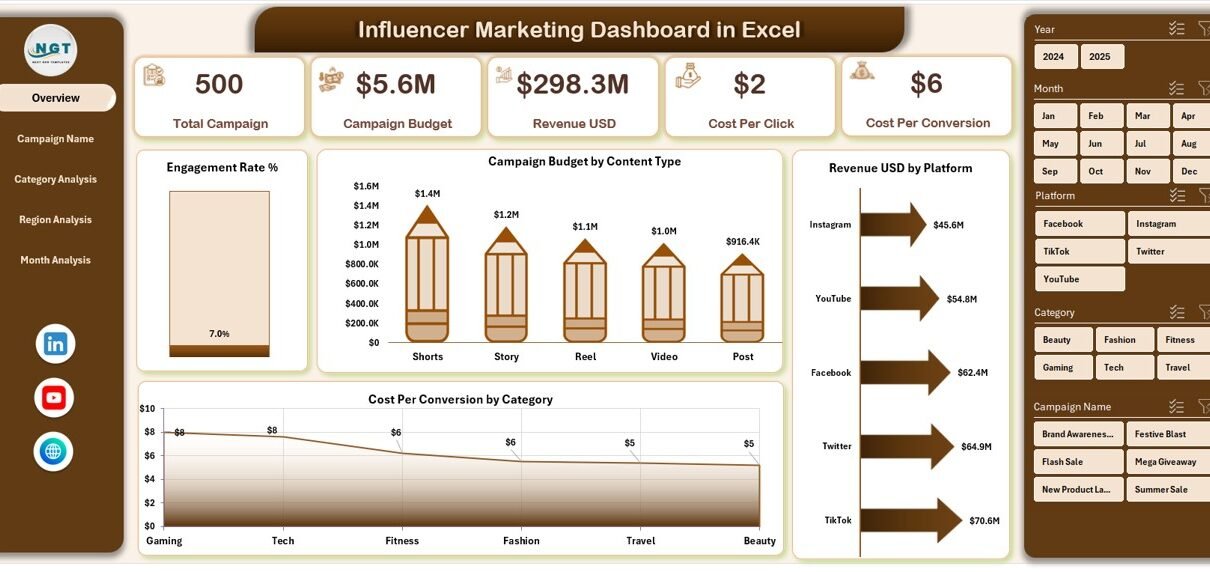
1️⃣ Overview Page – The Executive Summary
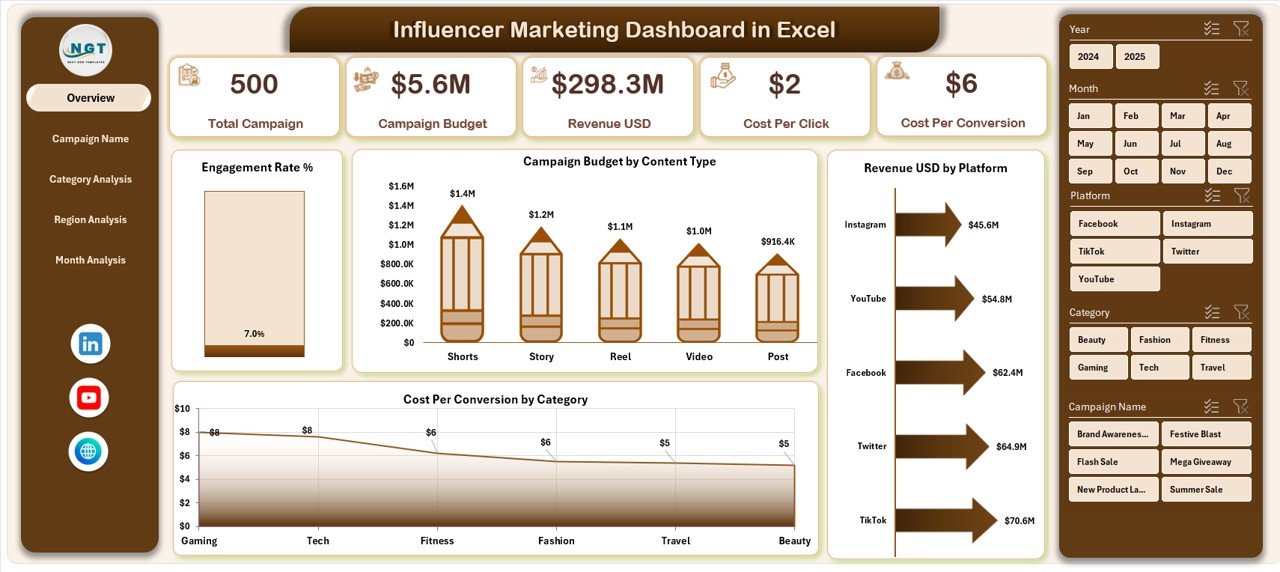
The Overview page acts as the main dashboard screen.
What does it include?
-
Right-side slicer (filter by campaign, category, region, month)
-
4 KPI cards
-
4 analytical charts
KPI Cards Display:
-
Total Campaign Budget
-
Total Revenue
-
Engagement Rate %
-
Cost Per Conversion
Charts Included:
-
📊 Engagement Rating %
-
📊 Campaign Budget by Content Type
-
📊 Revenue by Platform
-
📊 Cost Per Conversion by Category
Because this page summarizes all major KPIs, decision-makers can quickly review overall performance.
2️⃣ Campaign Name Analysis – Which Campaign Performs Best?
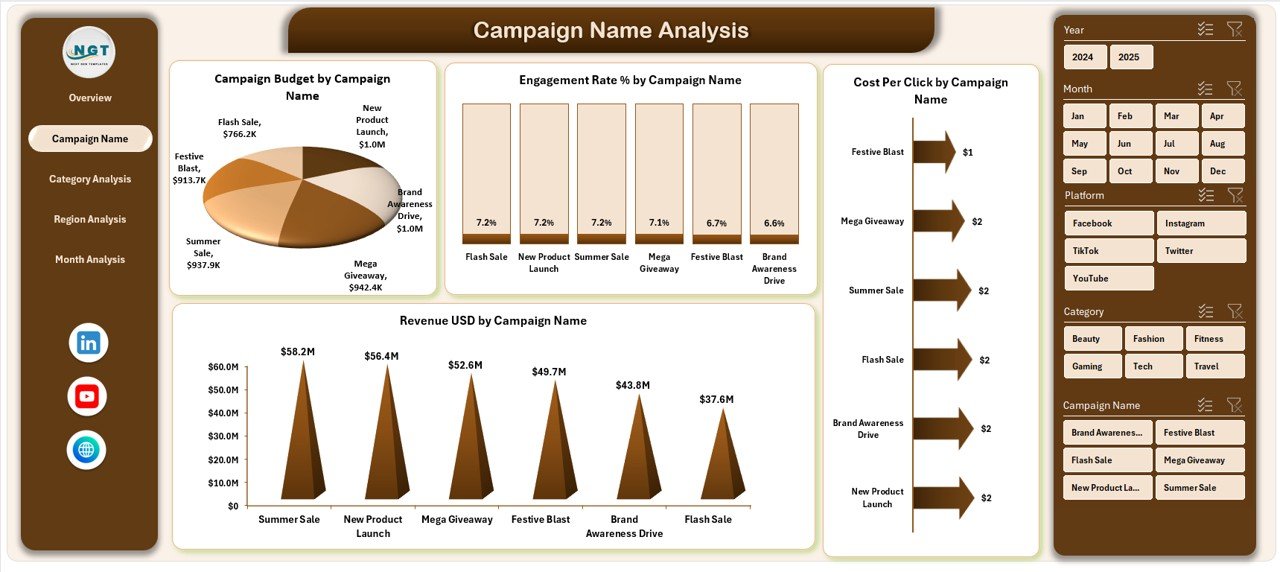
This page helps you compare performance by campaign.
It includes:
-
Right-side slicer
-
4 performance charts
Charts Display:
-
Engagement Rating % by Campaign Name
-
Campaign Budget by Campaign Name
-
Revenue by Campaign Name
-
Cost Per Conversion by Campaign Name
Therefore, marketers can instantly identify:
-
High-performing campaigns
-
Low ROI campaigns
-
Budget-heavy but low-return campaigns
As a result, you can reallocate resources wisely.
Click to Purchases Influencer Marketing Dashboard in Excel
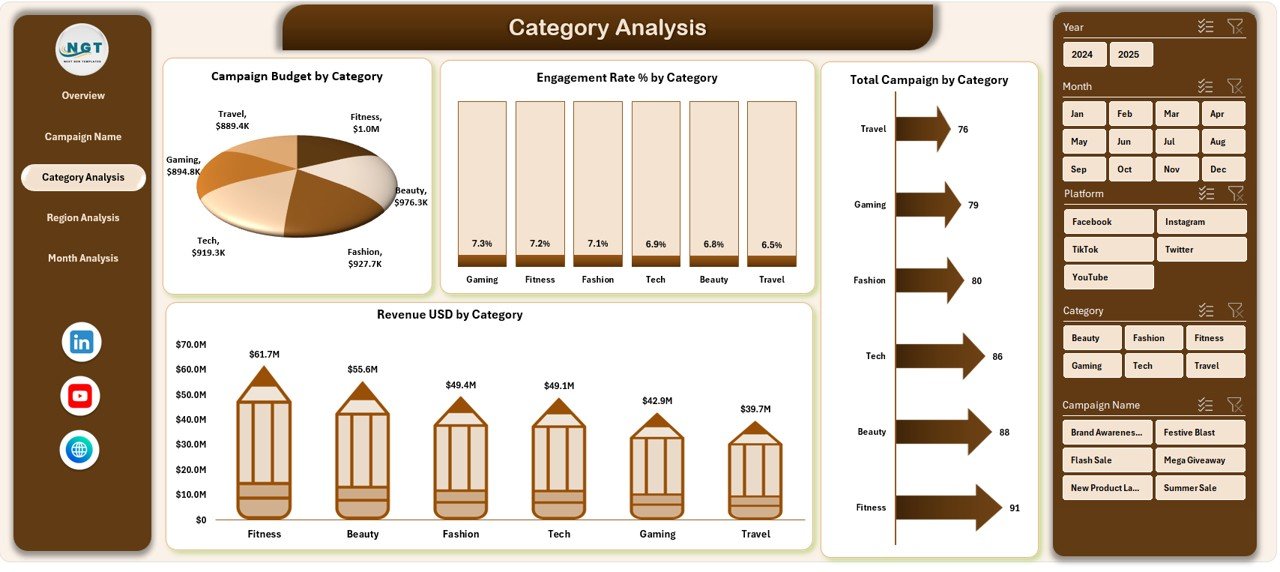
3️⃣ Category Analysis – Which Content Category Wins?
Influencer campaigns often fall into categories such as:
-
Fashion
-
Beauty
-
Fitness
-
Tech
-
Travel
This page helps analyze performance by category.
Charts Included:
-
Engagement Rating % by Category
-
Campaign Budget by Category
-
Revenue by Category
-
Total Campaign by Category
Consequently, you can discover which niche generates the highest engagement and revenue.
4️⃣ Region Analysis – Where Does Your Audience Convert?
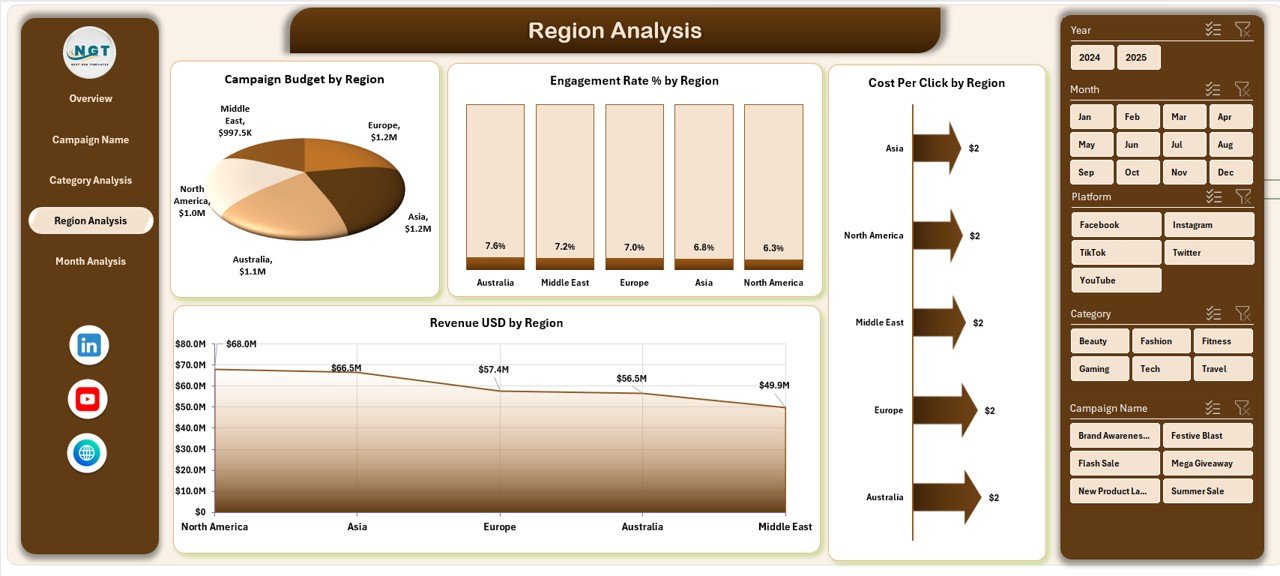
Geography matters in influencer marketing.
Different regions show different engagement behaviors. Therefore, this page focuses on regional performance.
Charts Included:
-
Engagement Rating % by Region
-
Campaign Budget by Region
-
Revenue by Region
-
Cost Per Click by Region
Because of this analysis, you can:
-
Focus on high-performing regions
-
Reduce spending in underperforming regions
-
Optimize targeting strategies
-
Click to Purchases Influencer Marketing Dashboard in Excel
5️⃣ Month Analysis – How Does Performance Change Over Time?
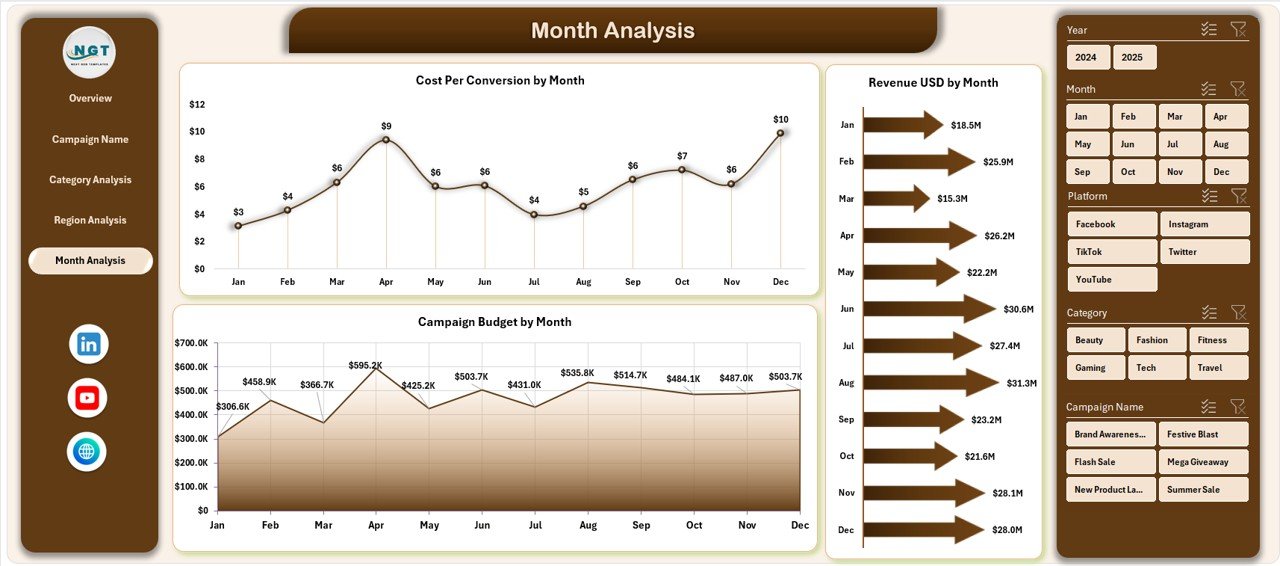
Marketing trends change monthly. Hence, tracking monthly performance becomes essential.
Charts Included:
-
Campaign Budget by Month
-
Revenue by Month
-
Cost Per Conversion by Month
This page helps you identify:
-
Seasonal spikes
-
Budget utilization patterns
-
Revenue growth trends
Therefore, you can plan future campaigns better.
What Data Does the Dashboard Require?
The dashboard depends on structured data.
Data Sheet Should Include:
-
Campaign Name
-
Influencer Name
-
Platform
-
Content Type
-
Category
-
Region
-
Month
-
Campaign Budget
-
Impressions
-
Clicks
-
Engagement
-
Conversions
-
Revenue
Once you enter data properly, pivot tables and charts update automatically.
Key Metrics Used in Influencer Marketing Dashboard
Let’s understand the important KPIs included in this dashboard.
Engagement Rate %
Formula:
Engagement ÷ Impressions × 100
This metric shows how actively audiences interact with content.
Cost Per Conversion
Formula:
Campaign Budget ÷ Total Conversions
This metric indicates campaign efficiency.
Cost Per Click (CPC)
Formula:
Campaign Budget ÷ Total Clicks
This metric helps evaluate traffic cost.
Return on Investment (ROI)
Formula:
(Revenue – Campaign Budget) ÷ Campaign Budget
This metric measures profitability.
Advantages of Influencer Marketing Dashboard in Excel
Using this dashboard offers multiple benefits.
1️⃣ Centralized Data Management
You keep all campaign data in one file. Therefore, you avoid confusion.
2️⃣ Real-Time Analysis
When you update data, charts refresh instantly. As a result, you get quick insights.
3️⃣ Budget Optimization
You can compare spending versus revenue easily. Hence, you control costs better.
4️⃣ Improved Decision-Making
Clear visuals simplify analysis. Consequently, management teams make faster decisions.
5️⃣ Easy Customization
Excel allows full flexibility. So, you can modify metrics based on your needs.
Best Practices for the Influencer Marketing Dashboard in Excel
To get maximum value, follow these best practices.
1️⃣ Maintain Clean Data
Always standardize platform names and categories. Otherwise, pivot tables may show errors.
2️⃣ Update Data Regularly
Add new campaign data weekly or monthly. Therefore, your dashboard remains accurate.
3️⃣ Use Data Validation
Apply dropdown lists to avoid spelling mistakes.
4️⃣ Monitor KPIs Consistently
Do not review performance only at the end of the campaign. Instead, monitor weekly.
5️⃣ Compare Across Dimensions
Analyze by region, category, and platform simultaneously. Consequently, you gain deeper insights.
How Does This Dashboard Improve Marketing ROI?
Click to Purchases Influencer Marketing Dashboard in Excel
This dashboard supports ROI improvement in several ways:
-
It highlights low-performing campaigns quickly.
-
It reveals profitable content categories.
-
It identifies cost-heavy regions.
-
It tracks engagement trends over time.
Therefore, marketers can take corrective actions early.
Who Should Use This Dashboard?
This Influencer Marketing Dashboard suits:
-
Digital Marketing Agencies
-
Brand Managers
-
E-commerce Businesses
-
Social Media Teams
-
Startups
Because it offers structured reporting, teams of all sizes can use it effectively.
How to Build This Dashboard in Excel?
You can create this dashboard using:
-
Pivot Tables
-
Pivot Charts
-
Slicers
-
KPI Cards
-
Conditional Formatting
Steps:
-
Import campaign data.
-
Create pivot tables.
-
Insert charts.
-
Add slicers for filtering.
-
Design clean layouts.
With proper structuring, you can create a professional-level dashboard.
How to Use the Page Navigator Effectively?
The Page Navigator on the left side improves user experience.
Instead of scrolling through sheets, you can:
-
Click to jump to Overview
-
Click to open Campaign Analysis
-
Click to review Category Analysis
-
Click to check Region Analysis
-
Click to analyze Month trends
Therefore, the dashboard feels interactive and user-friendly.
How Can You Customize the Dashboard?
You can customize:
-
KPI formulas
-
Chart types
-
Color themes
-
Additional filters
-
New calculated metrics
For example, you can add:
-
Influencer-level analysis
-
Platform growth trends
-
Conversion funnel charts
Thus, the dashboard can grow with your business.
Conclusion: Why Should You Use an Influencer Marketing Dashboard in Excel?
Influencer marketing drives modern brand growth. However, without structured tracking, you cannot measure success properly.
The Influencer Marketing Dashboard in Excel provides:
-
Clear visualization
-
Budget tracking
-
Revenue analysis
-
Cost efficiency monitoring
-
Performance comparison
Therefore, it empowers marketers to make data-driven decisions confidently.
If you want to improve ROI, increase engagement, and optimize influencer spending, this dashboard becomes a must-have tool.
Frequently Asked Questions (FAQs)
1. What is an Influencer Marketing Dashboard in Excel?
It is a structured Excel-based system that tracks influencer campaign performance using charts, slicers, and pivot tables.
2. Can beginners use this dashboard?
Yes. If you understand basic Excel functions, you can use it easily.
3. Which KPIs should I track in influencer marketing?
You should track engagement rate, revenue, cost per conversion, CPC, ROI, and campaign budget.
4. How often should I update the dashboard?
You should update it weekly or monthly for accurate tracking.
5. Can I customize this dashboard for my business?
Yes. You can modify formulas, add new metrics, and change layout design.
6. Does this dashboard support multiple platforms?
Yes. You can analyze Instagram, YouTube, TikTok, Facebook, and more.
Visit our YouTube channel to learn step-by-step video tutorials