The luxury handbags industry moves with elegance. However, behind every premium brand, strong numbers drive real growth. Trends shift quickly. Customer preferences change with seasons. Influencers impact demand overnight. Moreover, festive collections, limited editions, and celebrity endorsements push sudden sales spikes.
Therefore, luxury handbag retailers, distributors, and brand owners must track performance carefully.
Yet, many premium stores still use scattered spreadsheets. As a result, they miss profit gaps. They overlook inventory issues. They fail to compare targets with actual sales. Eventually, they lose visibility.So, how can you monitor revenue, margin, stock turnover, customer growth, and seasonal performance in one place?You need a Luxury Handbags KPI Dashboard in Excel.In this complete guide, you will learn:
- What a Luxury Handbags KPI Dashboard in Excel is
- Why luxury brands need it
- Detailed explanation of all 7 worksheets
- Important KPIs for handbag businesses
- Advantages of Luxury Handbags KPI Dashboard in Excel
- Best Practices for the Luxury Handbags KPI Dashboard
- Frequently Asked Questions with Answers
Click to buy Luxury Handbags KPI Dashboard in Excel
What Is a Luxury Handbags KPI Dashboard in Excel?
A Luxury Handbags KPI Dashboard in Excel is a ready-to-use performance tracking template designed specifically for premium handbag brands and retailers.
It helps you:
- Track Monthly (MTD) and Year-to-Date (YTD) performance
- Compare Actual vs Target vs Previous Year
- Monitor profit margin and sales growth
- Analyze inventory and stock movement
- Identify top-performing categories
Instead of switching between multiple sheets, you get one centralized dashboard.
Moreover, you gain instant insights. Therefore, you make faster decisions.
Why Do Luxury Handbag Brands Need a KPI Dashboard?
Luxury brands operate differently from regular retail stores.
They deal with:
- High-value products
- Limited stock
- Seasonal collections
- Premium customer segments
- Brand image sensitivity
Because of this, small mistakes create large financial impact.
For example:
- A 5% margin drop on premium bags reduces large profits.
- Slow-moving stock blocks capital.
- Missed target analysis delays strategy changes.
Therefore, a structured KPI dashboard becomes essential.
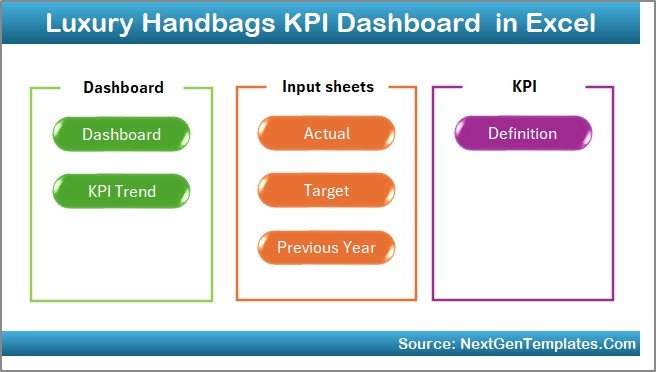
What Are the 7 Worksheets in the Luxury Handbags KPI Dashboard in Excel?
This dashboard contains 7 structured worksheets. Each sheet serves a specific purpose.
Let us understand each sheet clearly.
Summary Page – The Navigation Hub
The Summary Page works as an index.
Here, you get:
- 6 navigation buttons
- Quick access to all sheets
- Clean layout
Instead of searching manually, you jump instantly to any sheet.
This improves usability and saves time.
Click to buy Luxury Handbags KPI Dashboard in Excel
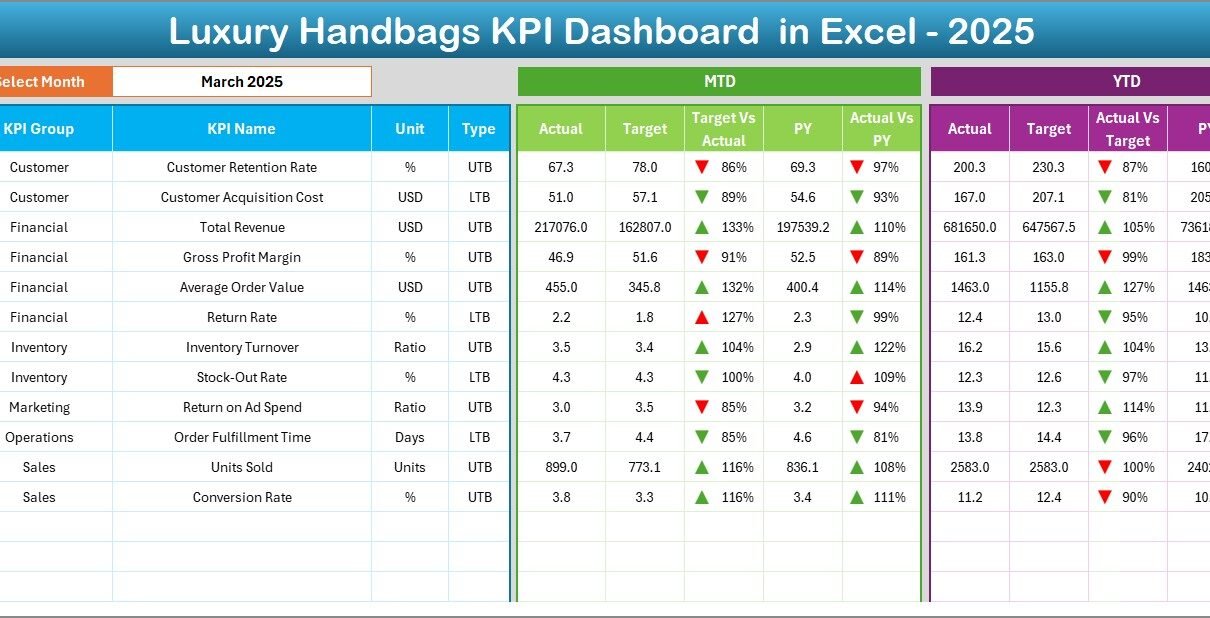
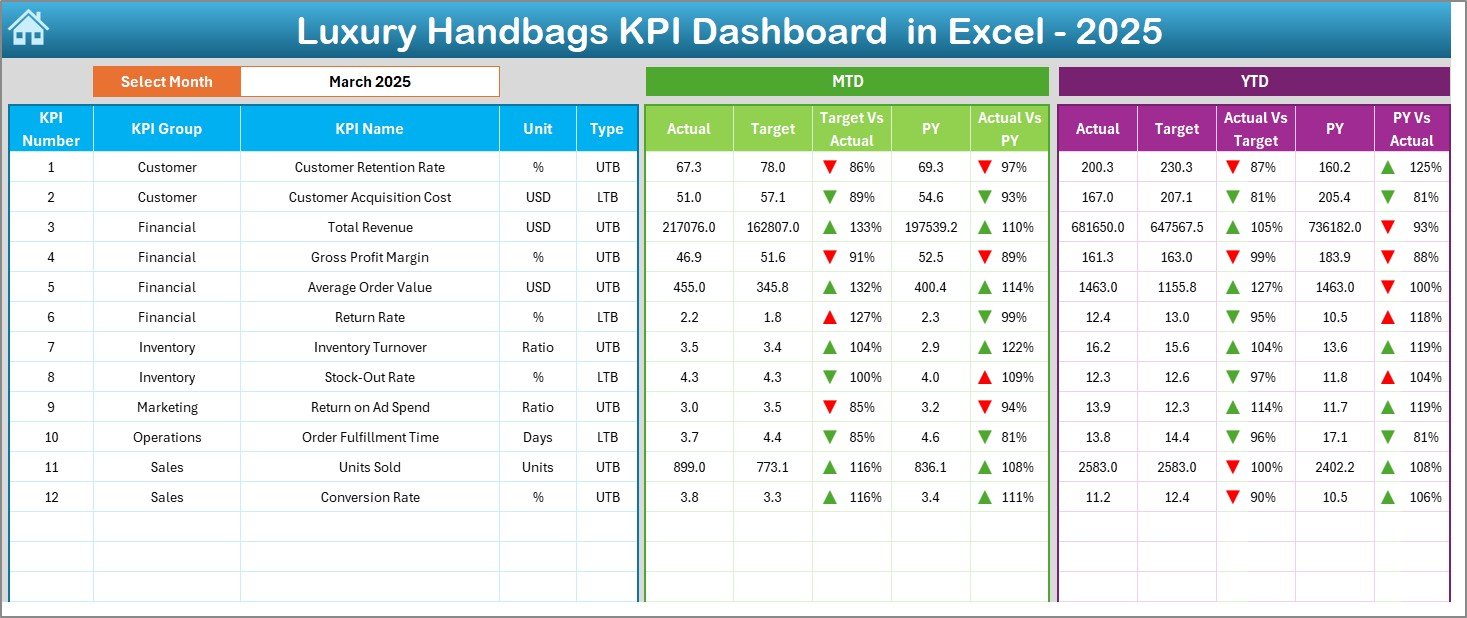
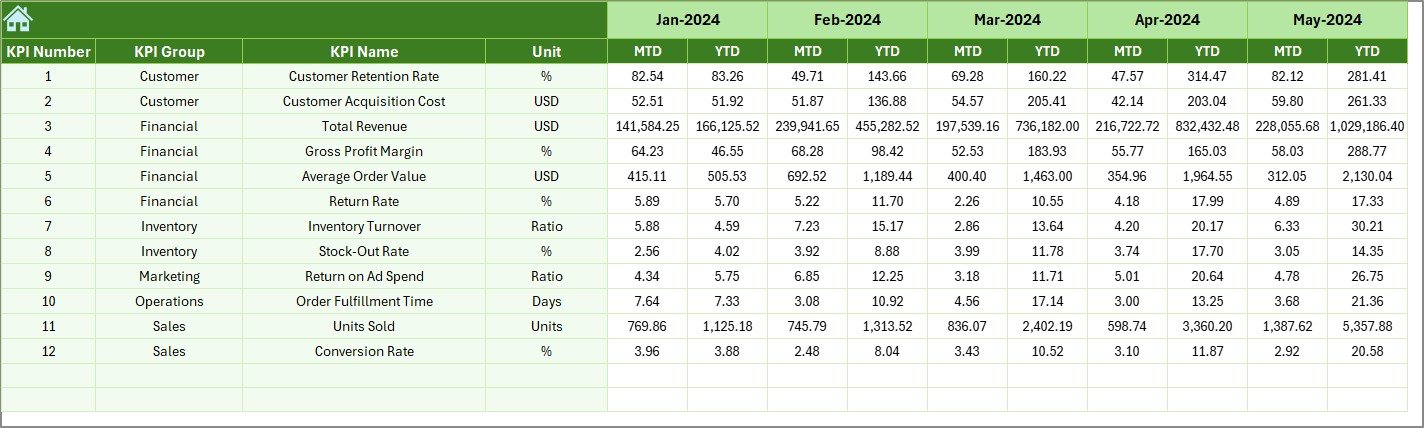
Dashboard Sheet Tab – The Main Control Center
This sheet shows all KPIs in one place.
Key Feature: Month Selection
On cell D3, you select the month from a drop-down list.
Immediately:
- All numbers update automatically
- MTD and YTD values refresh
- Charts reflect selected month
What Does the Dashboard Show?
For each KPI, you see:
- MTD Actual
- MTD Target
- MTD Previous Year
- Target vs Actual (with arrow indicator)
- PY vs Actual (with arrow indicator)
Similarly, you see:
- YTD Actual
- YTD Target
- YTD Previous Year
- YTD Target vs Actual
- YTD PY vs Actual
Conditional formatting arrows show performance direction:
- Up arrow = Good performance
- Down arrow = Underperformance
Therefore, you instantly identify gaps.
Click to buy Luxury Handbags KPI Dashboard in Excel
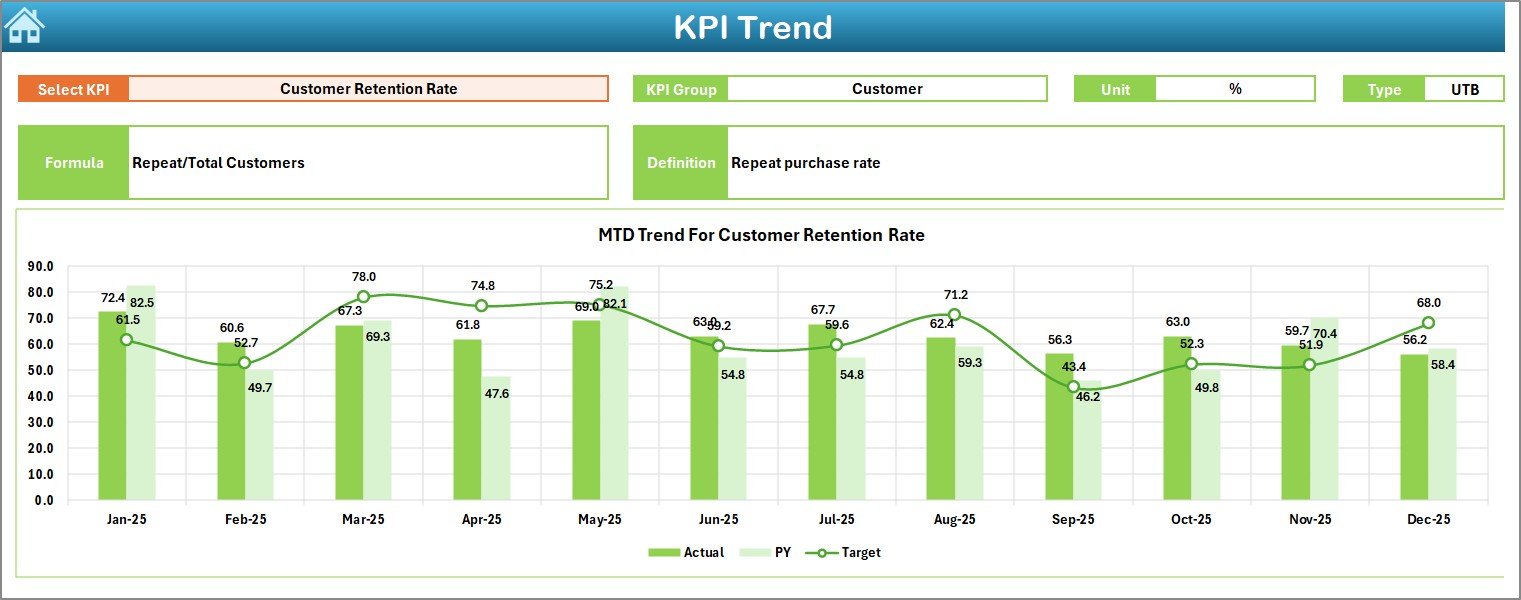
Trend Sheet Tab – Deep KPI Analysis
On this sheet, you can select the KPI name from C3.
Once selected, the dashboard displays:
- KPI Group
- KPI Unit
- KPI Type (UTB – Upper the Better / LTB – Lower the Better)
- KPI Formula
- KPI Definition
Additionally, you see:
- MTD Trend Chart (Actual, Target, PY)
- YTD Trend Chart (Actual, Target, PY)
Therefore, you analyze performance trends visually.
Instead of guessing patterns, you see real movement.
Click to buy Luxury Handbags KPI Dashboard in Excel
Actual Numbers Input Sheet – Data Entry Area
This sheet captures actual performance.
You:
- Enter MTD and YTD numbers
- Select month from cell E1
- Input data for selected month
The system automatically pulls data into the dashboard.
Because of structured format, errors reduce.
Click to buy Luxury Handbags KPI Dashboard in Excel
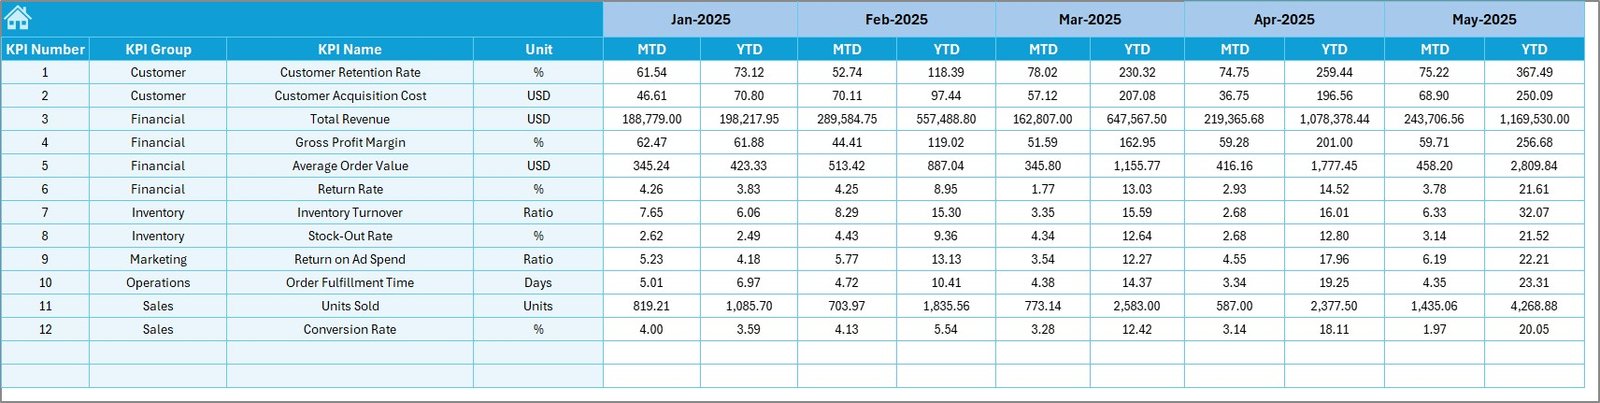
Target Sheet Tab – Monthly Planning Sheet
Here, you enter:
- Monthly MTD Target
- Monthly YTD Target
This sheet helps you:
- Define business goals
- Compare planned vs actual
- Monitor achievement rate
Therefore, strategy stays aligned with targets.
Click to buy Luxury Handbags KPI Dashboard in Excel
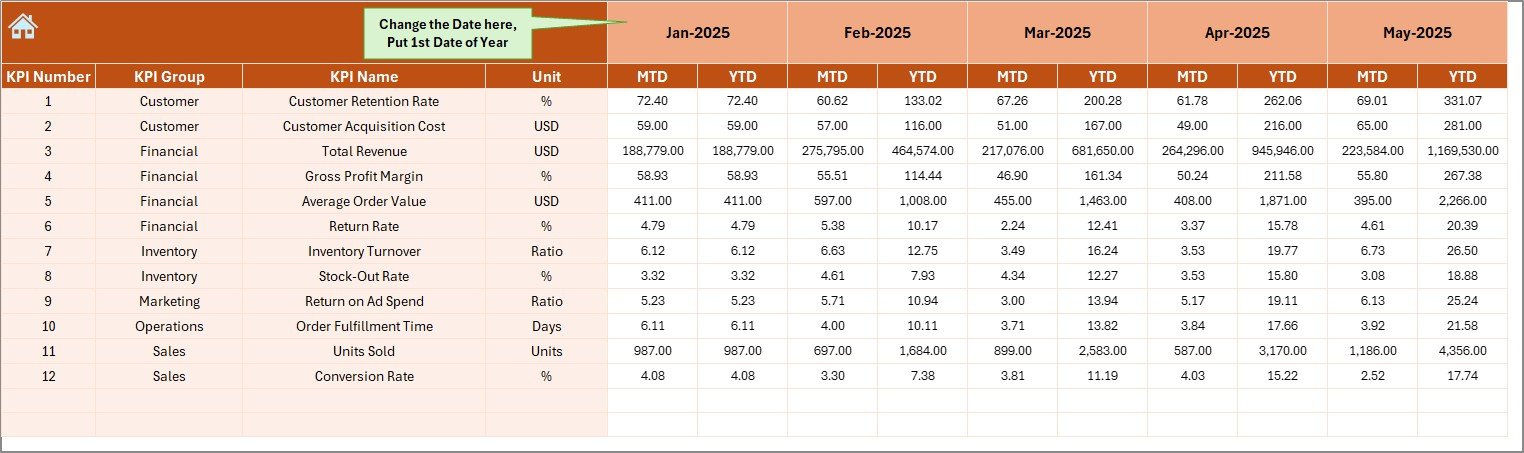
Previous Year Number Sheet – Historical Comparison
Luxury businesses depend heavily on historical trends.
In this sheet, you enter:
- Previous year MTD data
- Previous year YTD data
This enables:
- Growth rate analysis
- Seasonal comparison
- Year-over-year trend tracking
Without previous year comparison, growth analysis remains incomplete.
Click to buy Luxury Handbags KPI Dashboard in Excel
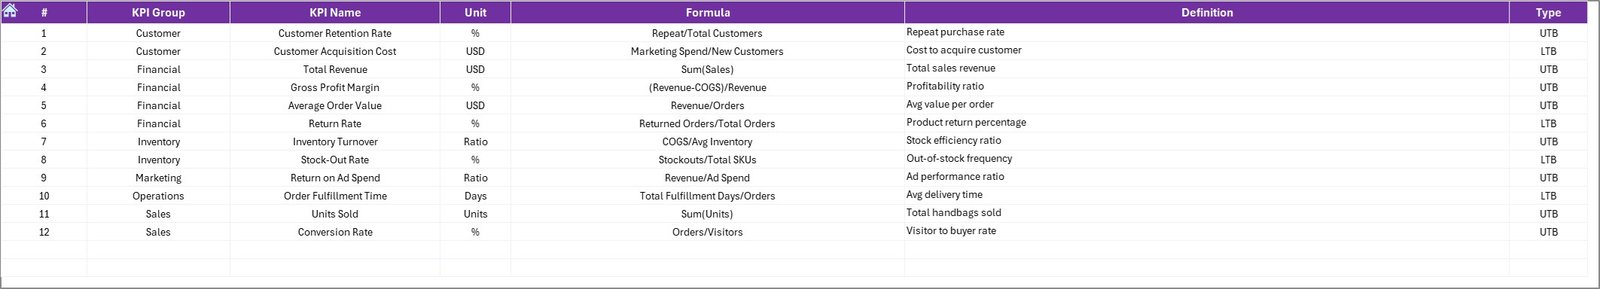
KPI Definition Sheet – KPI Management Center
This sheet stores:
- KPI Name
- KPI Group
- Unit
- Formula
- Definition
- KPI Type (UTB / LTB)
Because of this sheet:
- You customize KPIs easily
- You modify formulas anytime
- You expand dashboard without redesign
This makes the dashboard scalable.
Click to buy Luxury Handbags KPI Dashboard in Excel
Which KPIs Should You Track in a Luxury Handbags Business?
Let us explore important KPIs.
Sales KPIs
- Total Sales Revenue
- Average Order Value
- Sales Growth %
- Sales per Store
- Sales per Collection
Profitability KPIs
- Gross Margin %
- Net Profit Margin %
- Cost of Goods Sold
- Discount Rate %
Inventory KPIs
- Inventory Turnover Ratio
- Stock Aging Days
- Dead Stock %
- Sell-Through Rate
Customer KPIs
- Repeat Purchase Rate
- New Customers
- Customer Acquisition Cost
- Customer Lifetime Value
Tracking these KPIs gives complete business visibility.
How Does the Dashboard Improve Decision-Making?
Because the dashboard shows MTD and YTD together, you:
- Identify short-term issues
- Track long-term trends
- Monitor performance vs target
- Compare with previous year
For example:
If YTD Sales show growth but MTD declines, you detect a seasonal dip.
Then, you adjust promotions.
Thus, decisions become proactive instead of reactive.
Advantages of Luxury Handbags KPI Dashboard in Excel
Let us now explore key advantages.
Centralized Performance Tracking
You manage all KPIs in one file. Therefore, you reduce confusion.
Real-Time Comparison
Because month selection updates instantly, you analyze performance quickly.
Easy Customization
You can:
- Add new KPIs
- Modify formulas
- Update target structure
Therefore, the dashboard adapts to business changes.
Clear Visual Indicators
Arrow indicators simplify analysis. You immediately know:
- Which KPI performs well
- Which KPI needs attention
Budget-Friendly Solution
Unlike expensive BI tools, Excel offers cost-effective analytics.
Therefore, small and mid-sized brands benefit greatly.
No Technical Expertise Required
Because the layout remains simple, business users operate it easily.
Best Practices for the Luxury Handbags KPI Dashboard
To maximize benefits, follow these best practices.
Update Data Regularly
Enter data monthly without delay. Delayed entry creates wrong analysis.
Keep KPI Definitions Clear
Define each KPI properly in the KPI Definition sheet.
Review Trends Monthly
Do not only check numbers. Always review trend charts.
Align Targets with Strategy
Set realistic but challenging targets.
Monitor Inventory Carefully
Luxury products tie up large capital. Therefore, track inventory turnover consistently.
Avoid Overloading KPIs
Track only meaningful KPIs. Too many KPIs reduce focus.
How to Implement the Dashboard in Your Business?
Follow these steps:
- Define KPIs clearly
- Enter previous year data
- Set monthly targets
- Start entering actual data
- Review dashboard monthly
- Conduct performance review meetings
Within 2–3 months, you will see better clarity in operations.
How Does This Dashboard Support Luxury Brand Growth?
Luxury brands focus on:
- Brand positioning
- Premium pricing
- Exclusive collections
- Customer loyalty
Therefore, accurate data becomes powerful.
When you track:
- Margin trends
- Inventory levels
- Repeat purchase rate
You protect brand value.
Moreover, you increase profitability strategically.
Conclusion
Luxury handbag businesses operate in a competitive and premium market. Therefore, performance tracking must remain structured and precise.
A Luxury Handbags KPI Dashboard in Excel provides:
- Clear monthly performance visibility
- Target vs Actual comparison
- Previous year trend analysis
- Inventory and margin monitoring
Because of this structured system, you make faster decisions. You reduce risks. You improve profitability.
If you want clarity, control, and confidence in your luxury handbag business, this dashboard offers the perfect solution.
Frequently Asked Questions with Answers
- What is a Luxury Handbags KPI Dashboard in Excel?
It is an Excel-based performance tracking tool that monitors sales, margin, inventory, and customer KPIs.
- Can I customize the KPIs?
Yes. You can modify KPI definitions, formulas, and units from the KPI Definition sheet.
- Do I need advanced Excel skills?
No. The dashboard uses simple input sheets and drop-down selections.
- How often should I update the dashboard?
You should update it monthly. However, you can update weekly if required.
- Can small boutiques use this dashboard?
Yes. Small luxury boutiques and large brands both can use it.
- Does the dashboard compare previous year data?
Yes. It includes a dedicated sheet for previous year numbers.
Visit our YouTube channel to learn step-by-step video tutorials
Watch the step-by-step video tutorial:
Click to buy Luxury Handbags KPI Dashboard in Excel