The gig economy continues to grow rapidly. Millions of freelancers, delivery partners, ride-share drivers, digital creators, and independent contractors now earn through flexible work models. However, flexibility alone does not guarantee success.
If you manage a gig platform, delivery network, freelance marketplace, or on-demand service, you must track performance carefully. Otherwise, you may lose revenue, miss growth trends, and struggle with service quality.
So, how can you monitor revenue, active workers, order fulfillment, customer ratings, retention rate, and cost efficiency in one structured system?
The answer is simple.
You need a Gig Economy KPI Scorecard in Excel.
In this comprehensive guide, you will learn:
-
What a Gig Economy KPI Scorecard in Excel is
-
Why gig businesses need it
-
Detailed explanation of all 4 worksheets
-
Important KPIs for gig platforms
-
Advantages of Gig Economy KPI Scorecard in Excel
-
Best Practices for the Gig Economy KPI Scorecard
-
Frequently Asked Questions with Answers
Let us explore everything step by step.
Click to Purchases Gig Economy KPI Scorecard in Excel
What Is a Gig Economy KPI Scorecard in Excel?
A Gig Economy KPI Scorecard in Excel is a ready-to-use performance tracking system designed specifically for gig-based businesses. It allows you to:
-
Track operational performance
-
Compare actual vs target values
-
Monitor Month-to-Date (MTD) and Year-to-Date (YTD) results
-
Analyze trends visually
-
Maintain structured KPI definitions
Unlike scattered spreadsheets, this scorecard brings all important metrics into one interactive dashboard.
Moreover, you can use dropdown menus, conditional formatting, and automated calculations to evaluate performance instantly. Therefore, managers can make quick and informed decisions.
Why Does the Gig Economy Need a KPI Scorecard?
The gig economy operates at high speed. Demand fluctuates daily. Worker availability changes hourly. Customer expectations continue to rise.
Therefore, you must measure:
-
Order volume
-
Fulfillment rate
-
Average earnings per gig
-
Customer satisfaction
-
Worker retention
-
Platform commission
-
Operational costs
If you fail to track these numbers, you lose control over growth.
Additionally, gig platforms deal with thousands of micro-transactions. As a result, small inefficiencies can create large financial gaps.
A KPI Scorecard helps you:
-
Detect issues early
-
Compare performance month by month
-
Improve worker engagement
-
Increase profitability
-
Strengthen customer experience
In short, it turns raw data into actionable insights.
Click to Purchases Gig Economy KPI Scorecard in Excel
What Are the Key Features of the Gig Economy KPI Scorecard in Excel?
This ready-to-use template includes 4 powerful worksheets:
-
Scorecard Sheet
-
KPI Trend Sheet
-
Input Data Sheet
-
KPI Definition Sheet
Now let us understand each sheet in detail.
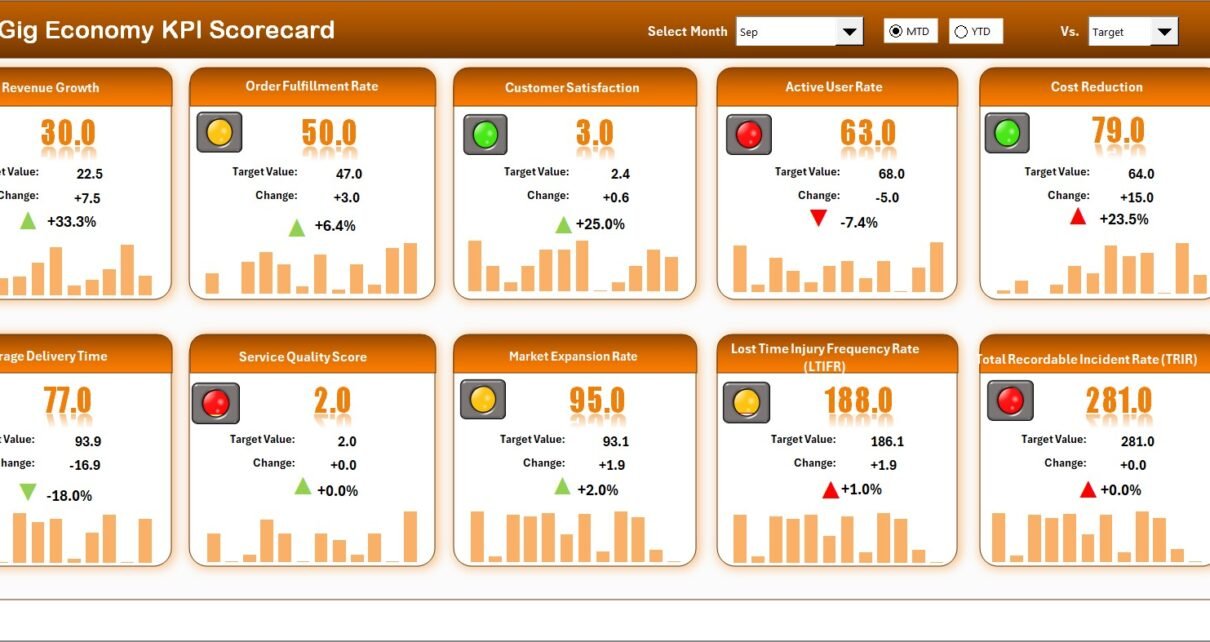
1. Scorecard Sheet – The Main Performance Interface
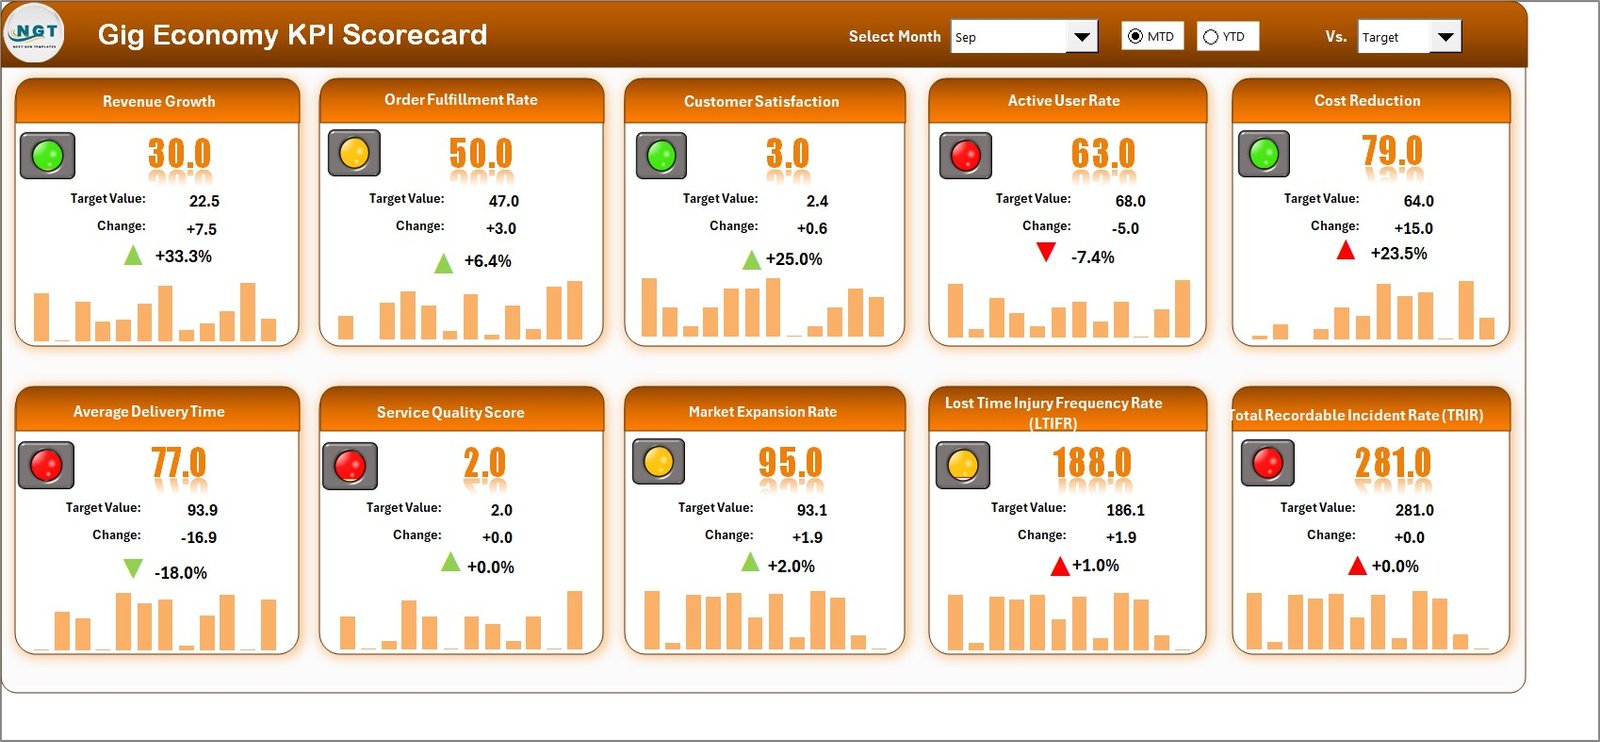
The Scorecard Sheet acts as the central dashboard. Here, you can view all KPI performance in one place.
Key Features of the Scorecard Sheet
✔ Dropdown Menus for Selection
You can select:
-
Month
-
MTD (Month-to-Date)
-
YTD (Year-to-Date)
As soon as you change the selection, the entire scorecard updates automatically.
✔ Actual vs Target Comparison
You can compare:
-
Actual values
-
Target values
-
Previous Year values
This comparison helps you identify performance gaps instantly.
✔ Visual Indicators
The template uses:
-
Color-coded signals
-
Conditional formatting
-
Up and down arrows
Therefore, you can quickly identify whether performance improves or declines.
✔ Complete KPI Overview
The scorecard displays:
-
KPI Name
-
KPI Group
-
Unit
-
MTD Performance
-
YTD Performance
-
Target Comparison
As a result, you gain full visibility without navigating multiple sheets.
Click to Purchases Gig Economy KPI Scorecard in Excel
2. KPI Trend Sheet – Deep Performance Analysis
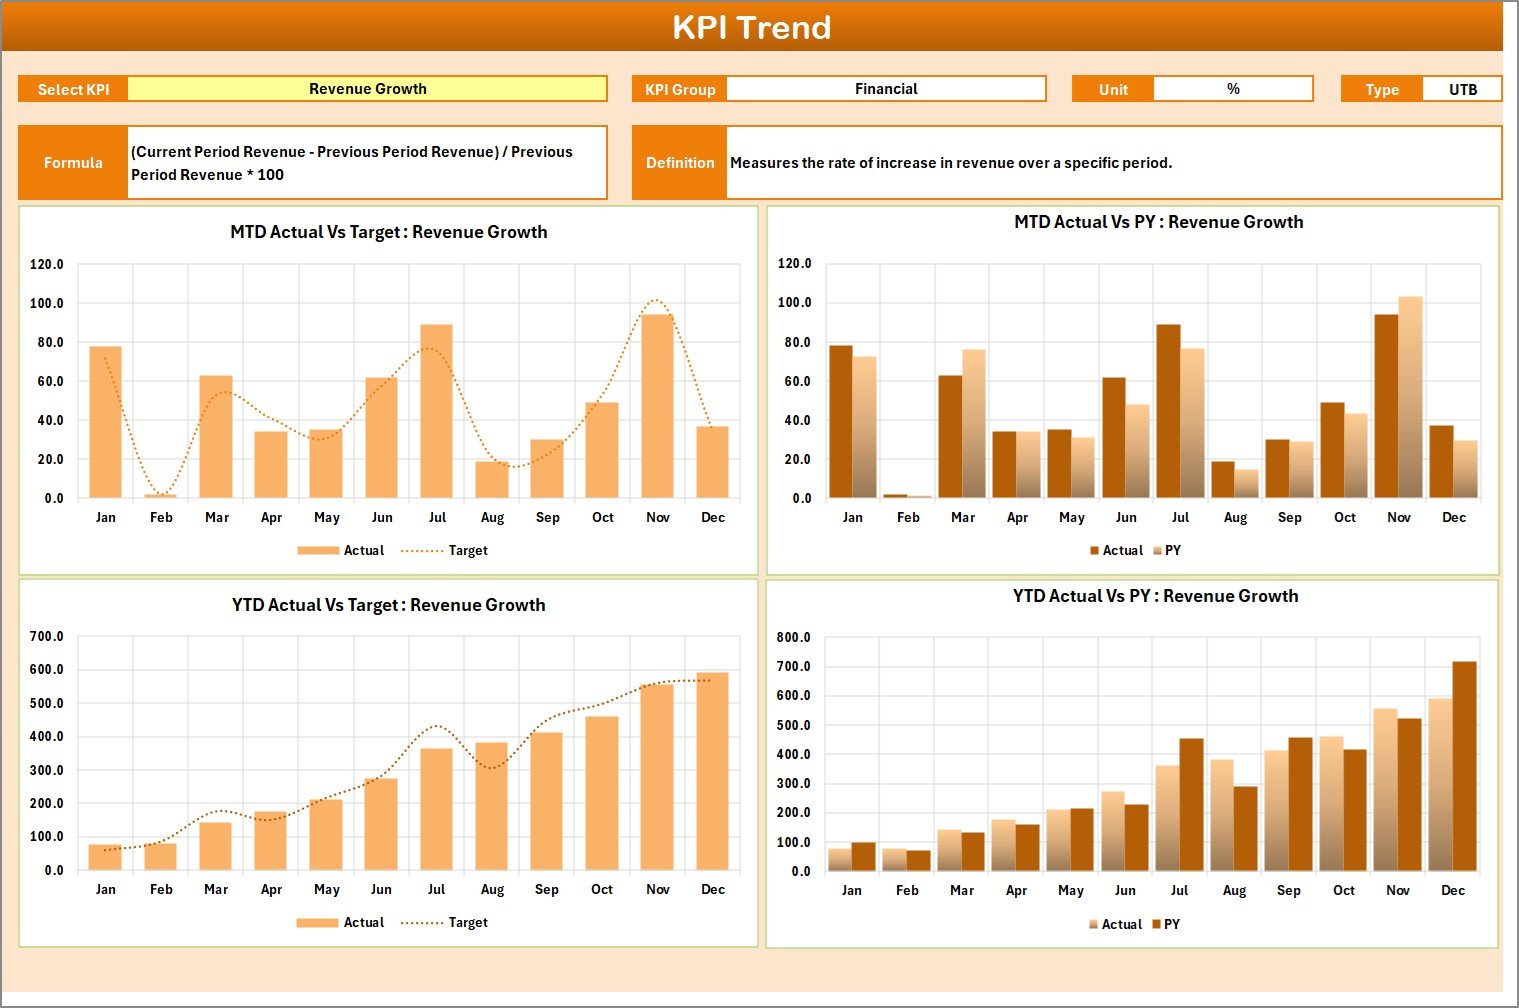
While the Scorecard Sheet shows summary results, the KPI Trend Sheet provides detailed insights.
How Does the KPI Trend Sheet Work?
You can select the KPI Name from the dropdown menu available in cell C3.
Once you select a KPI, the sheet displays:
-
KPI Group
-
Unit of KPI
-
Type of KPI (Lower the Better or Upper the Better)
-
Formula of the KPI
-
Definition of the KPI
Additionally, the sheet shows:
-
MTD Trend Chart
-
YTD Trend Chart
-
Actual vs Target vs Previous Year comparison
Therefore, you can analyze growth patterns over time.
For example, if Customer Satisfaction drops for three consecutive months, you can immediately take corrective action.
Click to Purchases Gig Economy KPI Scorecard in Excel
3. Input Data Sheet – Where You Enter Data
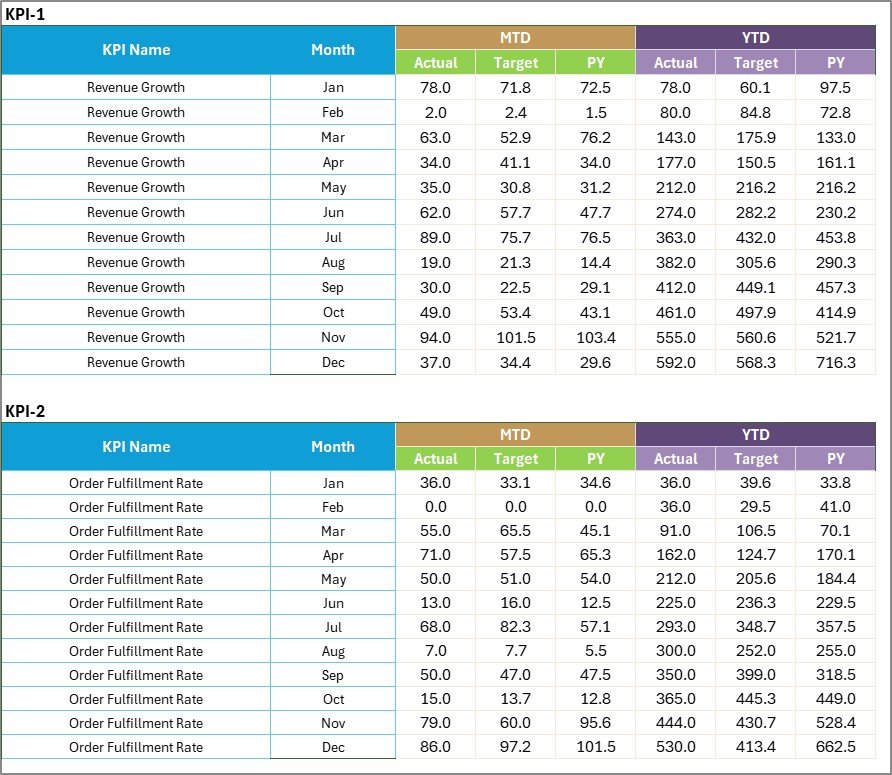
The Input Data Sheet acts as the backbone of the scorecard.
What Can You Do Here?
-
Enter Actual values
-
Enter Target values
-
Record monthly performance
-
Update new results
Since the sheet uses structured tables, you can update data easily.
Moreover, once you enter new data, the scorecard updates automatically. Therefore, you always see current performance without manual recalculation.
Click to Purchases Gig Economy KPI Scorecard in Excel
4. KPI Definition Sheet – Standardize Your Metrics
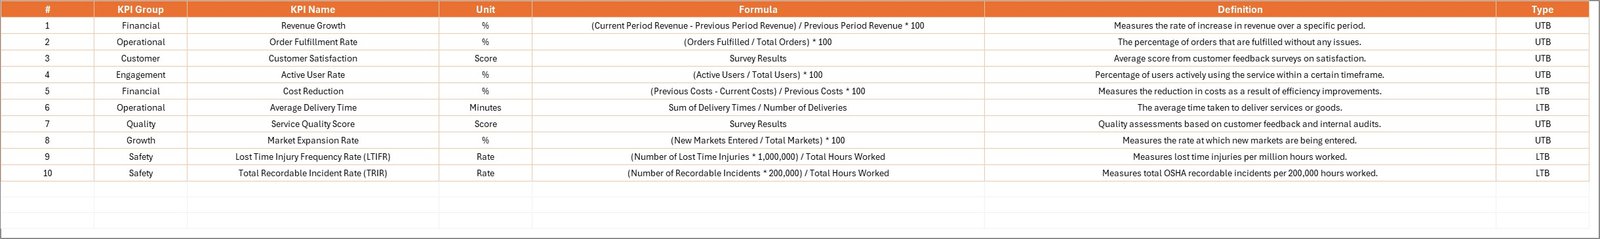
Many businesses fail because they do not define KPIs clearly.
The KPI Definition Sheet solves this issue.
What Information Do You Enter?
-
KPI Name
-
KPI Group
-
Unit
-
Formula
-
KPI Definition
By defining each KPI clearly, you ensure consistency across departments.
For example:
-
Revenue Growth = (Current Revenue – Previous Revenue) / Previous Revenue
-
Order Fulfillment Rate = (Completed Orders / Total Orders) × 100
When everyone understands the formula, confusion disappears.
What Are the Most Important KPIs for Gig Economy Platforms?
The gig economy includes delivery services, ride-sharing, freelance platforms, and digital marketplaces. Therefore, you must track KPIs across different categories.
Financial KPIs
-
Revenue Growth %
-
Platform Commission %
-
Gross Profit Margin
-
Cost per Transaction
-
Customer Acquisition Cost
Operational KPIs
-
Order Fulfillment Rate
-
Average Delivery Time
-
Active Gig Workers
-
Job Acceptance Rate
-
Cancellation Rate
Customer KPIs
-
Customer Satisfaction Score
-
Repeat Customer Rate
-
Net Promoter Score (NPS)
-
Complaint Rate
Workforce KPIs
-
Worker Retention Rate
-
Average Earnings per Gig
-
Gig Completion Rate
-
Response Time
By tracking these KPIs, you can balance growth, quality, and profitability.
Click to Purchases Gig Economy KPI Scorecard in Excel
Advantages of Gig Economy KPI Scorecard in Excel
A Gig Economy KPI Scorecard offers several benefits. Let us explore them in detail.
1. Centralized Performance Monitoring
You can track all KPIs in one structured file. Therefore, you avoid scattered reports.
2. Real-Time Decision Making
Once you update data, the dashboard reflects changes instantly. As a result, you can respond quickly.
3. Clear Visual Representation
Color indicators and trend charts make analysis simple. Even non-technical managers can understand the results easily.
4. Cost-Effective Solution
Unlike expensive software tools, Excel provides a budget-friendly option.
5. Customizable and Flexible
You can:
-
Add new KPIs
-
Modify formulas
-
Adjust targets
-
Update categories
Therefore, the template adapts to your business growth.
6. Improved Accountability
When you track performance regularly, teams focus on targets. Consequently, productivity improves.
Best Practices for the Gig Economy KPI Scorecard
If you want maximum benefit, follow these best practices.
1. Define KPIs Clearly
Before you track performance, define each KPI properly. Write simple formulas and explanations.
2. Update Data Regularly
Update the Input Data Sheet monthly or weekly. Otherwise, your dashboard loses relevance.
3. Set Realistic Targets
Set achievable targets based on historical performance. Unrealistic goals reduce motivation.
4. Review Trends, Not Just Numbers
Do not focus only on current performance. Instead, analyze trends over time.
5. Involve Key Stakeholders
Share the scorecard with:
-
Operations team
-
Finance team
-
Customer support team
-
Leadership
Collaboration improves decision-making.
6. Automate Where Possible
Use formulas, pivot tables, and conditional formatting. Automation reduces errors.
How Can You Customize the Gig Economy KPI Scorecard?
You can personalize the scorecard based on your business model.
For example:
-
Delivery platforms can add On-Time Delivery Rate
-
Ride-sharing apps can track Driver Utilization Rate
-
Freelance marketplaces can monitor Project Completion Time
Therefore, the scorecard becomes highly adaptable.
Click to Purchases Gig Economy KPI Scorecard in Excel
How Does This Scorecard Improve Business Growth?
When you monitor KPIs regularly:
-
You detect weak areas early
-
You optimize operational costs
-
You increase customer satisfaction
-
You retain gig workers
-
You improve profit margins
Consequently, your business grows steadily.
Conclusion
The gig economy moves fast. Competition increases daily. Therefore, businesses must track performance systematically.
A Gig Economy KPI Scorecard in Excel provides:
-
Structured KPI monitoring
-
MTD and YTD comparison
-
Trend analysis
-
Clear performance indicators
-
Flexible customization
Instead of relying on scattered spreadsheets, you can use one powerful and organized system.
If you want to manage gig operations efficiently, improve profitability, and strengthen customer experience, this scorecard offers a practical solution.
Frequently Asked Questions with Answers
1. What is a Gig Economy KPI Scorecard?
It is an Excel-based performance tracking tool designed to monitor financial, operational, customer, and workforce KPIs in gig businesses.
2. Can small gig startups use this scorecard?
Yes. Startups can use this template easily. It works well for small and large businesses.
3. Does the scorecard support MTD and YTD analysis?
Yes. The template allows you to analyze Month-to-Date and Year-to-Date performance.
4. Can I add new KPIs to the template?
Yes. You can add, edit, or remove KPIs based on your business needs.
5. Do I need advanced Excel skills to use it?
No. Basic Excel knowledge is enough to operate the template effectively.
Click to Purchases Gig Economy KPI Scorecard in Excel
Visit our YouTube channel to learn step-by-step video tutorials