The luxury handbag industry moves fast. Trends change quickly. Customer taste shifts with seasons. Moreover, global fashion weeks, celebrity endorsements, and festive campaigns directly impact sales.
Therefore, luxury handbag brands must track performance carefully.
However, many premium fashion brands still rely on scattered Excel sheets. As a result, they miss performance gaps. They struggle to compare targets with actual sales. They fail to track growth against last year.
So, how can you monitor revenue, profit margin, inventory turnover, sales growth, and target achievement in one smart system?You need a Luxury Handbags KPI Dashboard in Power BI.
In this detailed guide, you will learn:
- What a Luxury Handbags KPI Dashboard in Power BI is
- Why luxury fashion brands need it
- Complete explanation of all 3 dashboard pages
- Excel data structure required
- Advantages of Luxury Handbags KPI Dashboard in Power BI
- Best Practices for the Luxury Handbags KPI Dashboard in Power BI
- Frequently Asked Questions with Answers
Click to buy Luxury Handbags KPI Dashboard in Power BI
What Is a Luxury Handbags KPI Dashboard in Power BI?
A Luxury Handbags KPI Dashboard in Power BI is a ready-to-use performance tracking solution designed specifically for premium handbag brands, fashion retailers, and luxury distributors.
It helps you:
- Track Monthly (MTD) performance
- Track Year-to-Date (YTD) performance
- Compare Actual vs Target
- Compare Current Year vs Previous Year
- Identify underperforming KPIs instantly
- Analyze trend movement for each KPI
Most importantly, it turns raw Excel data into powerful visual insights.
Instead of checking 10 different sheets, you see everything on one interactive dashboard.
Why Do Luxury Handbag Brands Need a KPI Dashboard?
Luxury brands operate differently from regular retailers. They deal with:
- High product value
- Limited editions
- Seasonal collections
- Global distribution
- Premium customer expectations
Therefore, even a small performance drop can impact brand image and profitability.
A Power BI KPI Dashboard helps brands:
- Monitor sales growth in real time
- Identify declining margins quickly
- Compare store or region performance
- Track target achievement instantly
- Improve strategic decisions
Moreover, decision-makers can review KPIs in seconds instead of hours.
Key Features of Luxury Handbags KPI Dashboard in Power BI
This dashboard contains 3 interactive pages inside the Power BI Desktop file:
- Summary Page
- KPI Trend Page
- KPI Definition Page (Drill Through)
Now let’s understand each page in detail.
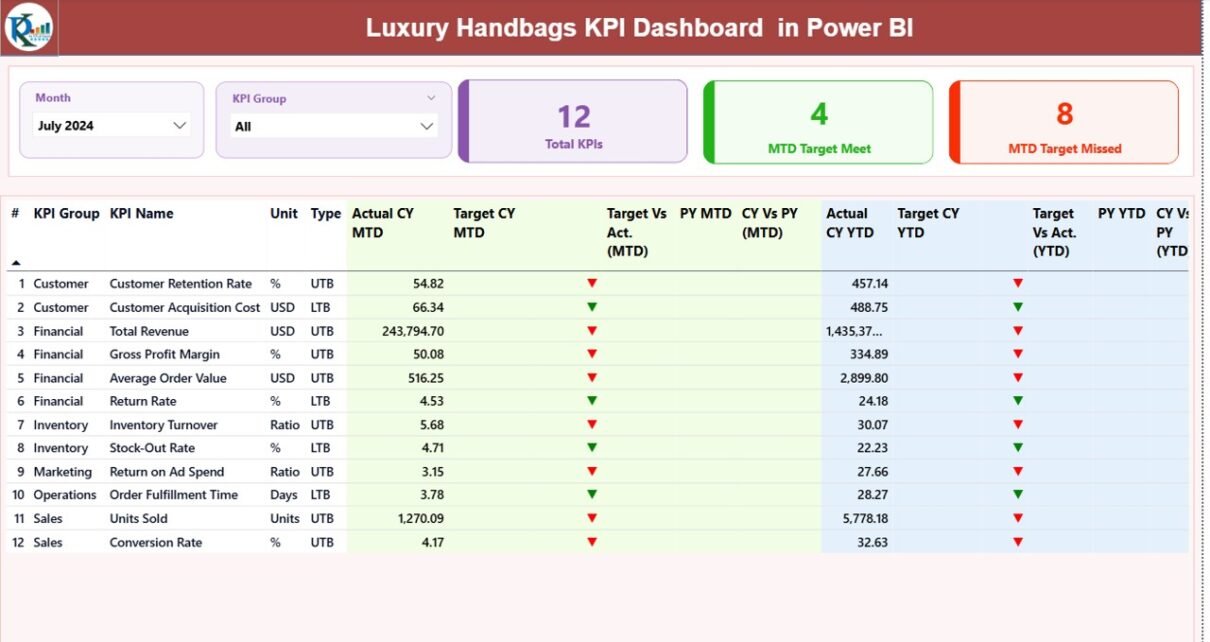
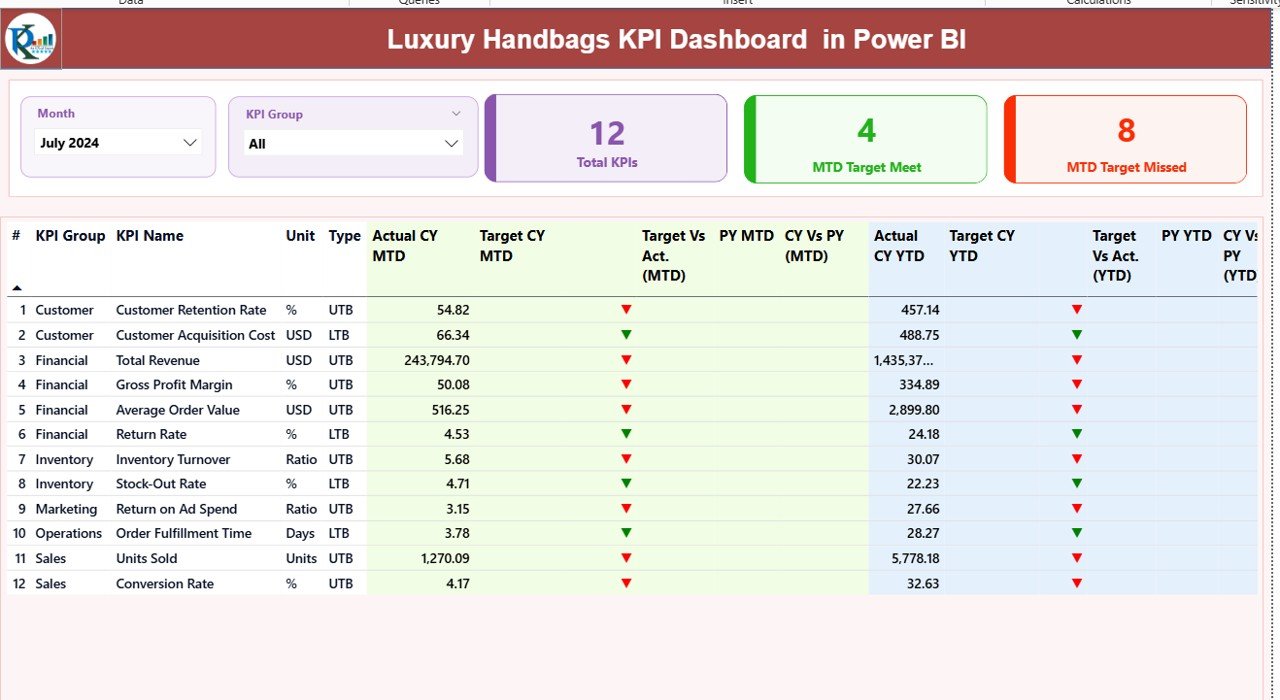
Summary Page – The Main Control Center
The Summary Page acts as the heart of the dashboard.
Here, you see slicers and KPI overview at the top.
What Do You See at the Top?
- Month Slicer
- KPI Group Slicer
These slicers allow you to filter data instantly. For example, you can select “March 2024” and “Sales KPIs” to see focused insights.
KPI Cards Displayed
On the top section, you see three important cards:
- Total KPIs Count
- MTD Target Meet Count
- MTD Target Missed Count
These cards instantly tell you how your business performs this month.
Detailed KPI Table Explained
Below the cards, you see a structured KPI table with the following columns:
KPI Number
Sequence number of KPI.
KPI Group
Category of KPI such as:
- Sales
- Profitability
- Inventory
- Marketing
- Customer
KPI Name
Specific KPI name such as:
- Revenue Growth %
- Gross Margin %
- Inventory Turnover
- Average Selling Price
Unit
Unit of measurement like:
- %
- USD
- Units
- Days
Type
- UTB (Upper the Better)
- LTB (Lower the Better)
This classification helps the dashboard apply correct logic.
MTD Section Explained
Actual CY MTD
Current Year Month-to-Date actual value.
Target CY MTD
Current Year Month-to-Date target value.
MTD Icon
- ▲ Green Arrow = Target Achieved
- ▼ Red Arrow = Target Missed
Therefore, you understand performance instantly.
Target Vs Act. (MTD)
Formula:
Actual MTD / Target MTD
It shows percentage performance.
PY MTD
Previous Year MTD value.
CY Vs PY (MTD)
Formula:
Current Year MTD / Previous Year MTD
It shows growth comparison.
YTD Section Explained
Actual CY YTD
Current Year cumulative performance.
Target CY YTD
Target for the year till current month.
YTD Icon
Shows performance against target with visual indicator.
Target Vs Act. (YTD)
Formula:
Actual YTD / Target YTD
PY YTD
Previous Year YTD value.
CY Vs PY (YTD)
Formula:
Current YTD / Previous YTD
Thus, you see yearly progress clearly.
Click to buy Luxury Handbags KPI Dashboard in Power BI
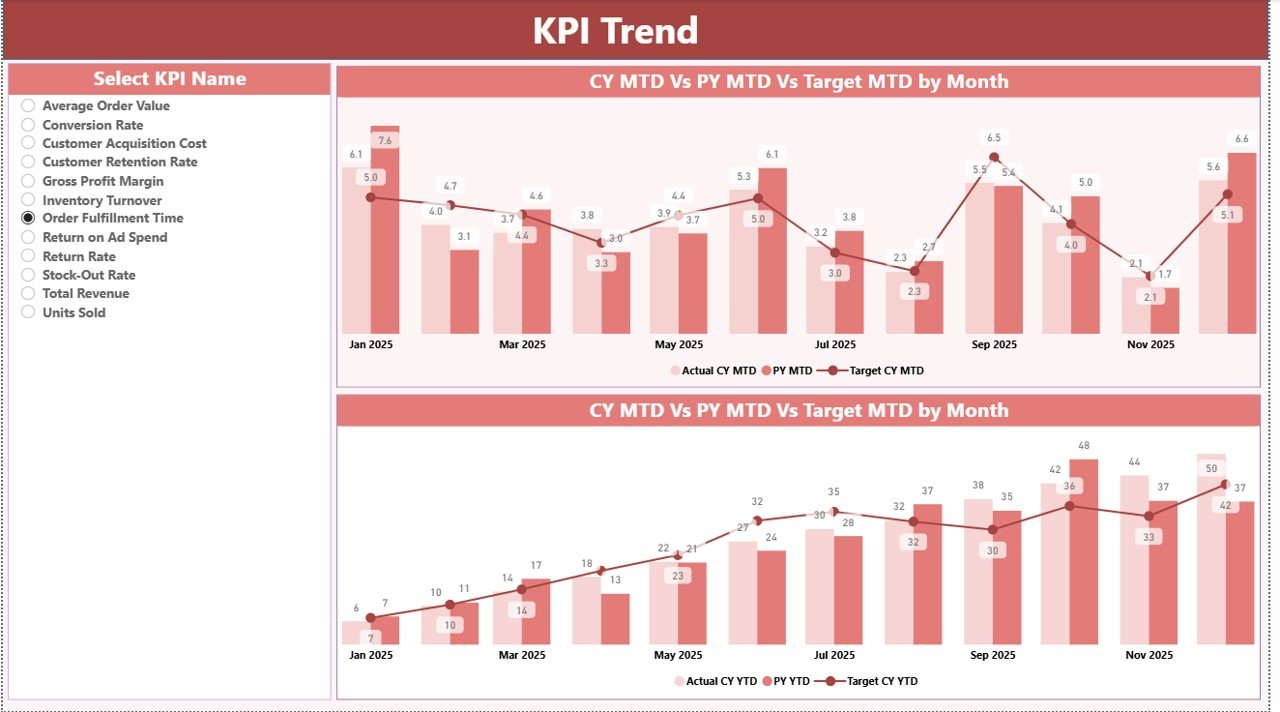
KPI Trend Page – Deep Performance Analysis
The KPI Trend Page helps you analyze one KPI in detail.
On the left side, you see:
- KPI Name Slicer
Once you select a KPI, the dashboard shows two combo charts:
Chart 1 – MTD Trend
Displays:
- Current Year Actual
- Previous Year Actual
- Target
Chart 2 – YTD Trend
Displays:
- Current Year Actual
- Previous Year Actual
- Target
Therefore, you analyze growth patterns easily.
Click to buy Luxury Handbags KPI Dashboard in Power BI
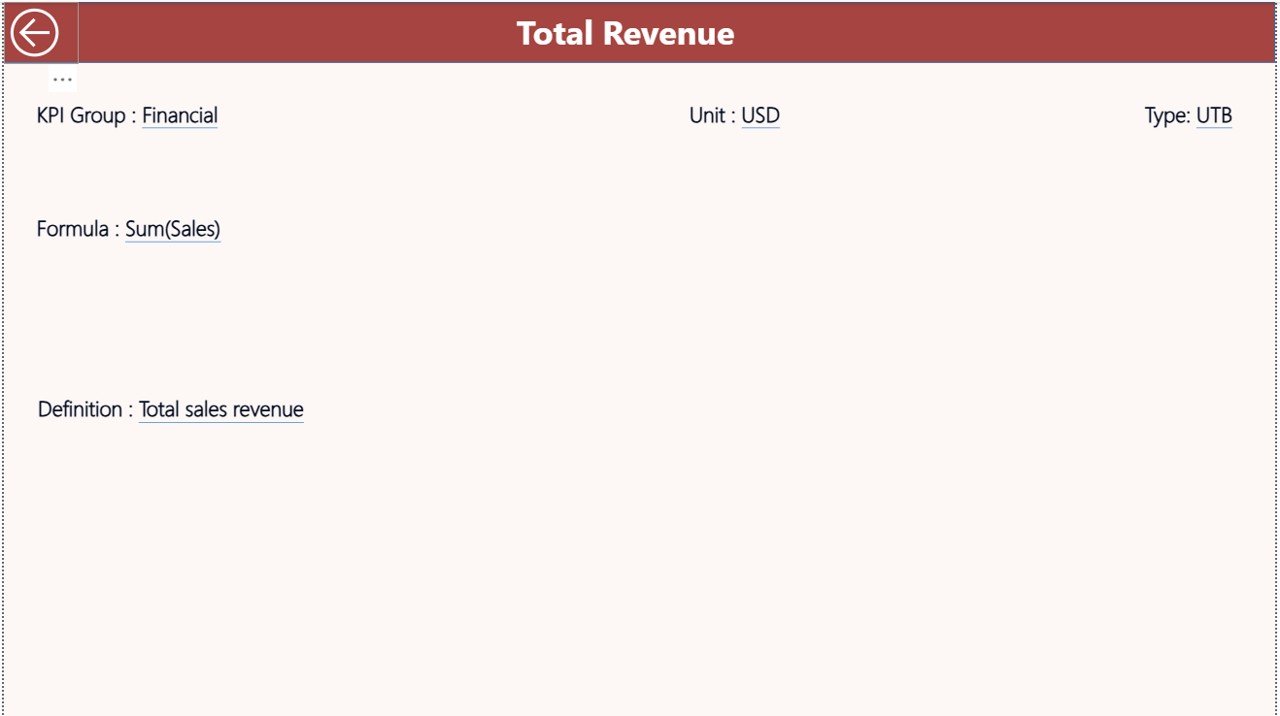
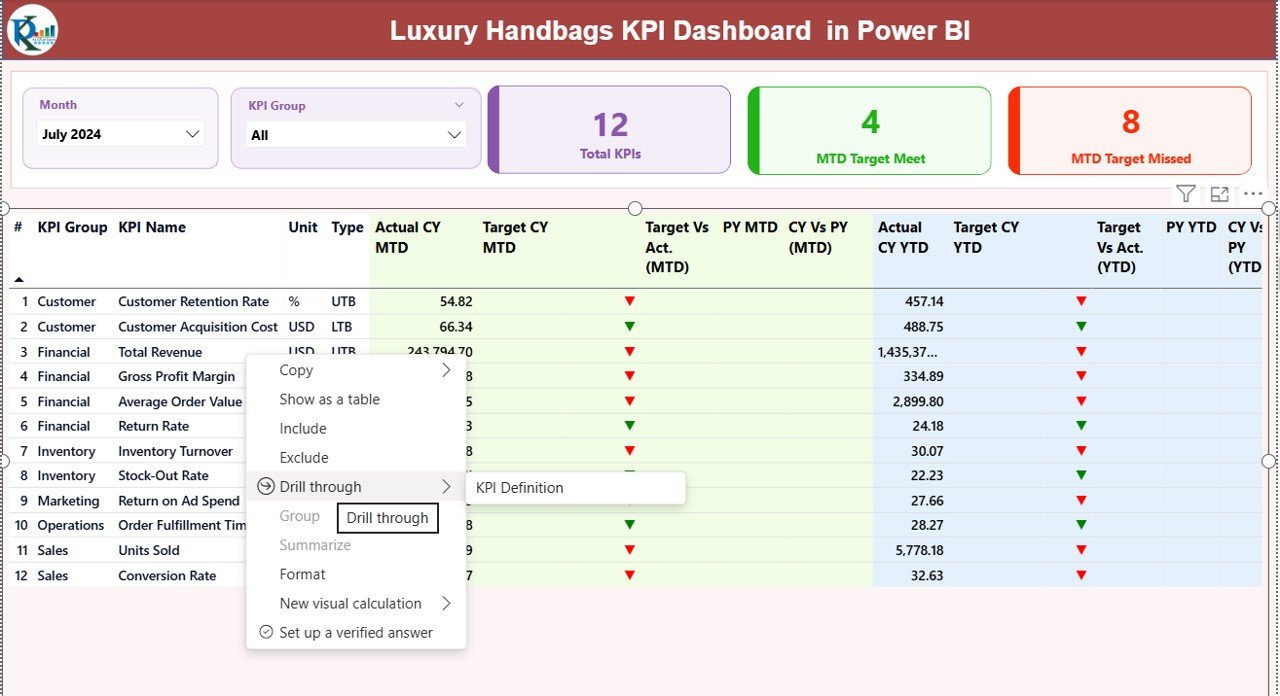
KPI Definition Page – Drill Through Details
This page remains hidden.
However, you can drill through from the Summary Page.
Here, you see:
- KPI Formula
- KPI Definition
- KPI Type
- KPI Group
This feature ensures clarity. Managers understand how each KPI calculates.
To return, simply click the back button on the top left corner.
Click to buy Luxury Handbags KPI Dashboard in Power BI
Excel Data Structure for Luxury Handbags KPI Dashboard
The dashboard uses an Excel file as data source.
You must fill three worksheets.
Input_Actual Sheet
Fill:
- KPI Name
- Month (First Date of Month)
- MTD Value
- YTD Value
Example:
01-Jan-2024
Revenue Growth %
MTD: 12%
YTD: 8%
Click to buy Luxury Handbags KPI Dashboard in Power BI
Input_Target Sheet
Fill:
- KPI Name
- Month
- MTD Target
- YTD Target
KPI Definition Sheet
Fill:
- KPI Number
- KPI Group
- KPI Name
- Unit
- Formula
- Definition
- Type (LTB or UTB)
Once you fill these sheets, Power BI automatically updates visuals.
Important KPIs for Luxury Handbag Business
Here are some essential KPIs:
Sales KPIs
- Revenue Growth %
- Average Selling Price
- Units Sold
- Online Sales Ratio
Profitability KPIs
- Gross Margin %
- Net Profit Margin %
- Cost Per Unit
- Discount %
Inventory KPIs
- Inventory Turnover
- Stock Aging Days
- Dead Stock %
Customer KPIs
- Repeat Purchase Rate
- Customer Lifetime Value
- Return Rate %
Marketing KPIs
- Campaign ROI
- Cost Per Acquisition
These KPIs help you control performance effectively.
Advantages of Luxury Handbags KPI Dashboard in Power BI
Now let’s understand why this dashboard adds huge value.
Real-Time Performance Monitoring
You see updated numbers instantly.
Clear Target Tracking
Green and red indicators simplify decision-making.
Year-over-Year Comparison
You compare growth easily.
Data-Driven Decisions
You stop guessing and start analyzing.
Improved Profit Control
You identify cost issues quickly.
Better Inventory Planning
You prevent overstock and stock-outs.
Executive-Level Reporting
You present clean visuals to stakeholders.
Therefore, this dashboard improves control and confidence.
Best Practices for the Luxury Handbags KPI Dashboard in Power BI
To get maximum benefit, follow these best practices.
Update Excel Data Regularly
Update MTD numbers every month.
Maintain Accurate KPI Definitions
Define formula clearly to avoid confusion.
Use Clean Data
Avoid duplicates and blank values.
Review Underperforming KPIs Weekly
Do not wait till year end.
Align KPIs with Business Goals
Choose KPIs that support strategy.
Monitor Seasonal Trends
Luxury sales fluctuate during festivals and fashion events.
Keep KPI Groups Organized
Separate Sales, Profit, Inventory, and Marketing.
When you follow these practices, you maximize dashboard effectiveness.
How Does This Dashboard Improve Business Strategy?
Luxury brands need precision.
This dashboard helps management:
- Increase profitability
- Improve margin control
- Optimize inventory
- Enhance customer loyalty
- Track marketing success
Moreover, it reduces reporting time by more than 60%.
Therefore, leaders focus on strategy instead of data collection.
Who Can Use This Luxury Handbags KPI Dashboard?
- Luxury fashion brands
- Premium handbag retailers
- E-commerce fashion stores
- Boutique chains
- Fashion distributors
- International luxury brands
Even small premium brands can use it.
Conclusion
The luxury handbag industry demands precision, speed, and clarity.
However, manual reporting slows growth.
Therefore, the Luxury Handbags KPI Dashboard in Power BI becomes a powerful solution.
It tracks MTD and YTD performance.
It compares target vs actual.
It analyzes year-over-year growth.
It shows visual performance indicators.
It simplifies executive reporting.
Most importantly, it transforms raw Excel data into meaningful insights.
If you want to control performance, improve profitability, and drive growth, this dashboard offers the perfect solution.
Frequently Asked Questions with Answers
- What makes this KPI dashboard suitable for luxury handbag brands?
It focuses on high-value products, margin tracking, and performance comparison, which luxury brands require.
- Can I customize KPIs?
Yes. You can add, remove, or modify KPIs in the Excel file.
- Do I need advanced Power BI skills to use it?
No. You only need basic knowledge to refresh data.
- How often should I update data?
Update monthly for MTD and YTD accuracy.
- What does UTB and LTB mean?
UTB means Upper the Better.
LTB means Lower the Better.
- Can I compare with previous year?
Yes. The dashboard automatically shows CY vs PY comparison.
- Is this dashboard suitable for multi-store businesses?
Yes. You can expand data to include store-level KPIs.
Click to buy Luxury Handbags KPI Dashboard in Power BI
Visit our YouTube channel to learn step-by-step video tutorials
Watch the step-by-step video tutorial: