Water shapes life. However, organizations often struggle to track water consumption, rainfall, reservoir levels, and treatment costs in one place. As a result, leaders miss trends. Moreover, departments fail to control costs. Therefore, businesses need a structured and visual system that turns raw data into clear insights.
That is exactly why we created the Water Resource Management Dashboard in Excel.
This ready-to-use Excel dashboard helps you monitor water resources, compare actual vs target values, analyze departments, evaluate regions, and track monthly performance. In addition, it allows decision-makers to act faster and smarter.
In this detailed guide, you will learn:
Click to Purchases Water Resource Management Dashboard in Excel
-
What a Water Resource Management Dashboard in Excel is
-
Why organizations need it
-
Explanation of all 5 dashboard pages
-
Key performance indicators (KPIs) included
-
Advantages of the Water Resource Management Dashboard in Excel
-
Best Practices for the Water Resource Management Dashboard in Excel
-
Frequently Asked Questions with Answers
Let us explore everything step by step.
What Is a Water Resource Management Dashboard in Excel?
A Water Resource Management Dashboard in Excel is a ready-to-use performance tracking system built inside Microsoft Excel. It helps organizations monitor water consumption, rainfall, treatment costs, reservoir levels, and performance against targets.
Instead of using scattered spreadsheets, this dashboard consolidates all data into one interactive system. Furthermore, it uses slicers, charts, KPI cards, and dynamic visuals to make data easy to understand.
As a result, you can:
-
Track water performance in real time
-
Compare actual vs target values
-
Monitor cost trends
-
Analyze region-wise and department-wise data
-
Review monthly and yearly comparisons
Because Excel remains widely accessible, this dashboard works perfectly for government departments, manufacturing plants, municipalities, utilities, and environmental agencies.
Why Do Organizations Need a Water Resource Management Dashboard?
Water management requires constant monitoring. However, manual tracking often creates delays and confusion. Therefore, organizations need automation and visualization.
Here are the main reasons:
1. Water Scarcity Challenges
Water resources continue to decline in many regions. Consequently, monitoring reservoir levels becomes critical.
2. Rising Treatment Costs
Treatment costs increase every year. Therefore, organizations must control expenses efficiently.
3. Regulatory Compliance
Governments enforce strict water usage regulations. Hence, tracking performance against standards becomes necessary.
4. Target-Based Monitoring
Departments often set usage or conservation targets. However, without dashboards, comparing actual vs target becomes difficult.
5. Data-Driven Decision Making
Leadership teams require clear reports. Moreover, they need insights, not raw numbers.
The Water Resource Management Dashboard in Excel solves these problems in a structured and practical way.
Key Features of the Water Resource Management Dashboard in Excel
This dashboard includes advanced yet easy-to-use features. In addition, it keeps the layout clean and user-friendly.
✅ Page Navigator
Located on the left side, the page navigator allows quick movement across analytical pages. Therefore, users can switch between Overview, Region, Department, Water Source, and Month analysis easily.
✅ Right-Side Slicers
Each analytical page includes slicers on the right side. As a result, users can filter data instantly by region, department, water source, or month.
✅ 5 Structured Dashboard Pages
The Excel file includes five detailed analytical pages.
Let us explore each page in detail.
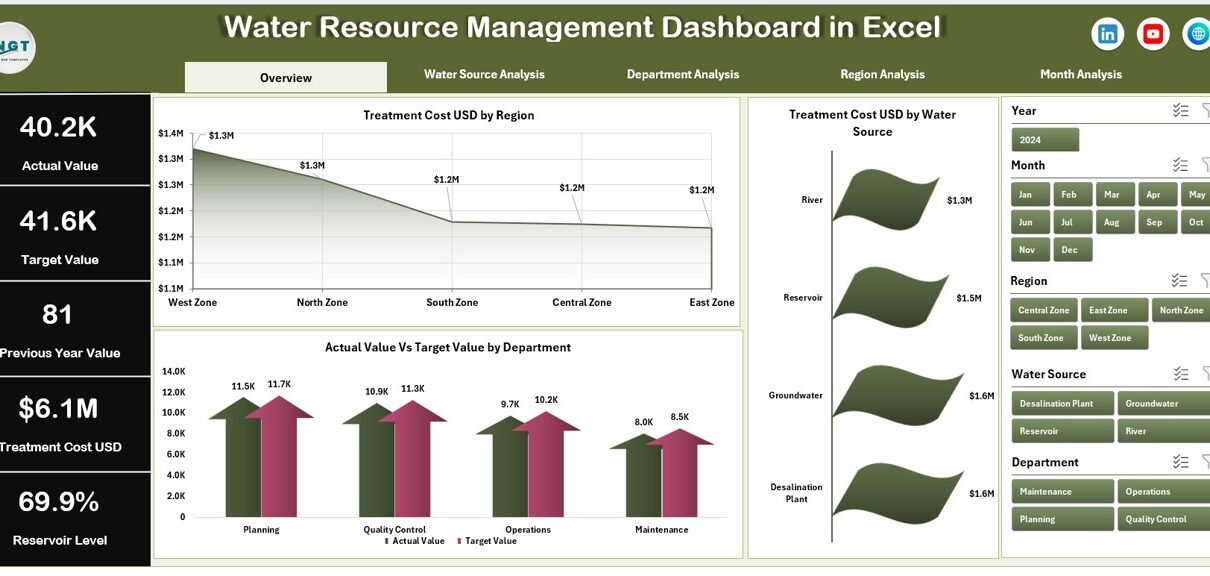
1️⃣ Overview Page – What Does It Show?
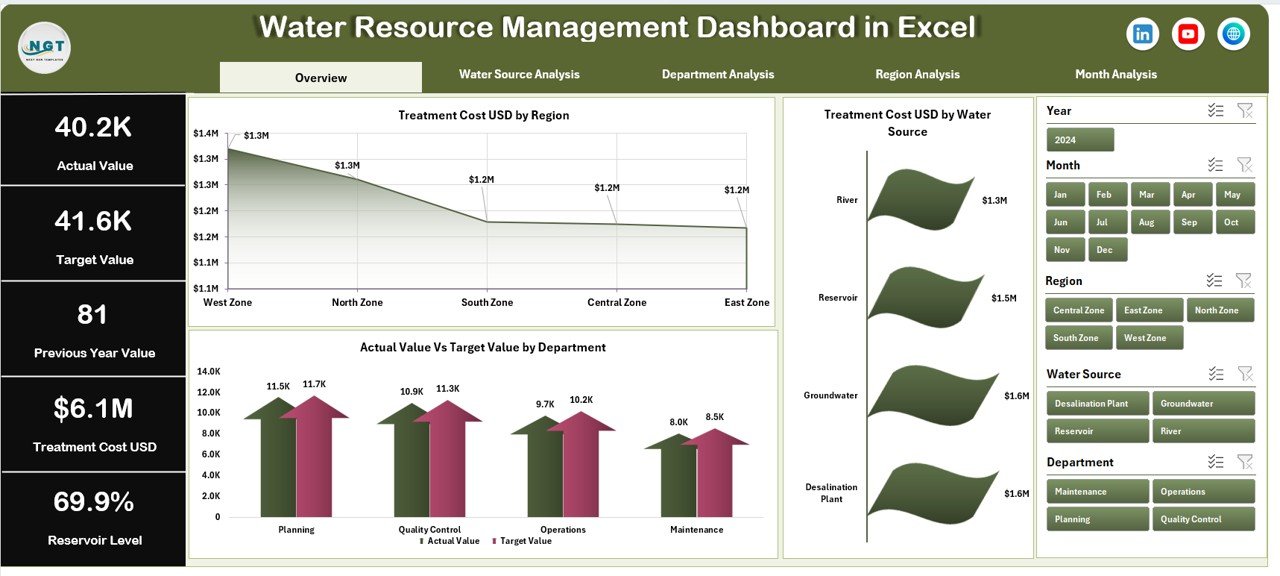
The Overview page works as the main summary page. It gives decision-makers a quick snapshot of overall water performance.
KPI Cards Included:
-
Total Treatment Cost (USD)
-
Average Reservoir Level (%)
-
Total Rainfall (mm)
-
Actual vs Target Performance (%)
These KPI cards help users understand performance instantly.
Charts Included:
-
Treatment Cost USD by Region
-
Treatment Cost USD by Water Source
-
Actual Value vs Target Value by Department
Because the Overview page combines financial and operational insights, it supports high-level strategic decisions.
For example, if one region shows rising treatment costs, management can investigate immediately.
2️⃣ Water Source Analysis – How Does Each Source Perform?
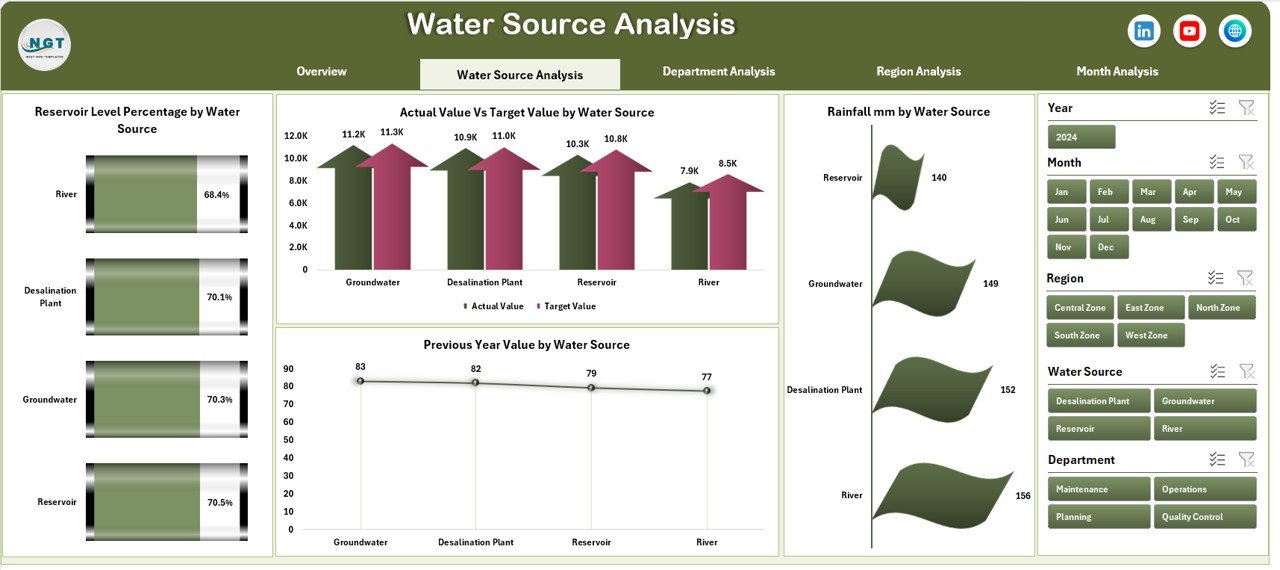
Water sources may include reservoirs, groundwater, rivers, rainwater harvesting, or recycled water.
This page answers critical questions:
-
Which water source maintains healthy reservoir levels?
-
Which source exceeds targets?
-
How does rainfall impact each source?
-
How did last year’s performance compare?
Charts Included:
-
Reservoir Level Percentage by Water Source
-
Actual Value vs Target Value by Water Source
-
Rainfall (mm) by Water Source
-
Previous Year Value by Water Source
Because this page focuses on source-level insights, it helps environmental teams optimize supply strategies.
Click to Purchases Water Resource Management Dashboard in Excel
3️⃣ Department Analysis – Which Department Uses Water Efficiently?
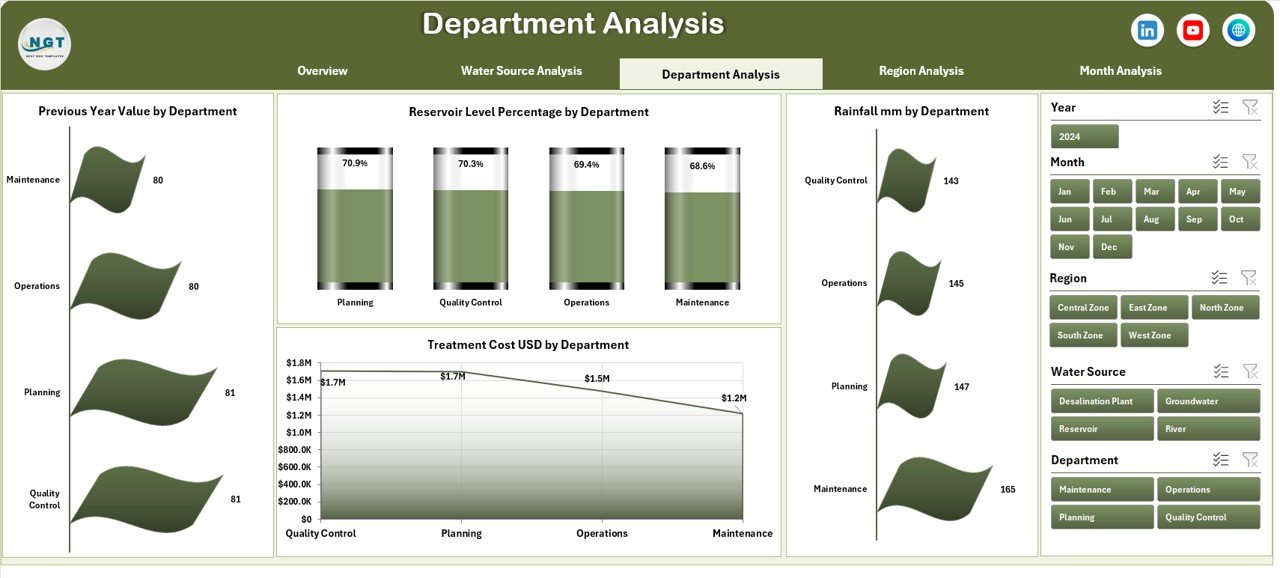
Departments often consume water differently. Therefore, comparing performance becomes important.
This page allows managers to identify:
-
High consumption departments
-
Target achievement gaps
-
Rainfall dependency patterns
-
Historical trends
Charts Included:
-
Reservoir Level Percentage by Department
-
Actual Value vs Target Value by Department
-
Rainfall (mm) by Department
-
Previous Year Value by Department
As a result, organizations can promote accountability. Moreover, they can reward departments that meet sustainability goals.
4️⃣ Region Analysis – How Does Each Region Perform?
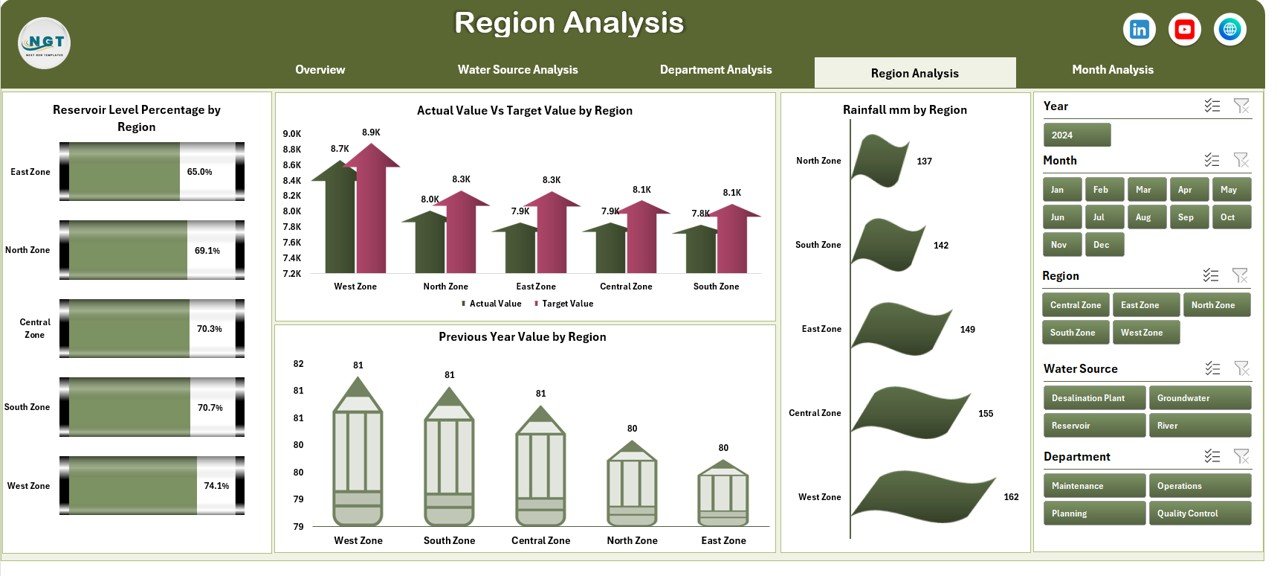
Geographic analysis plays a key role in water management. Some regions may face drought, while others receive heavy rainfall.
Charts Included:
-
Reservoir Level Percentage by Region
-
Actual Value vs Target Value by Region
-
Rainfall (mm) by Region
-
Previous Year Value by Region
Because this page compares regions side by side, leaders can allocate budgets and resources more effectively.
5️⃣ Month Analysis – What Are the Monthly Trends?
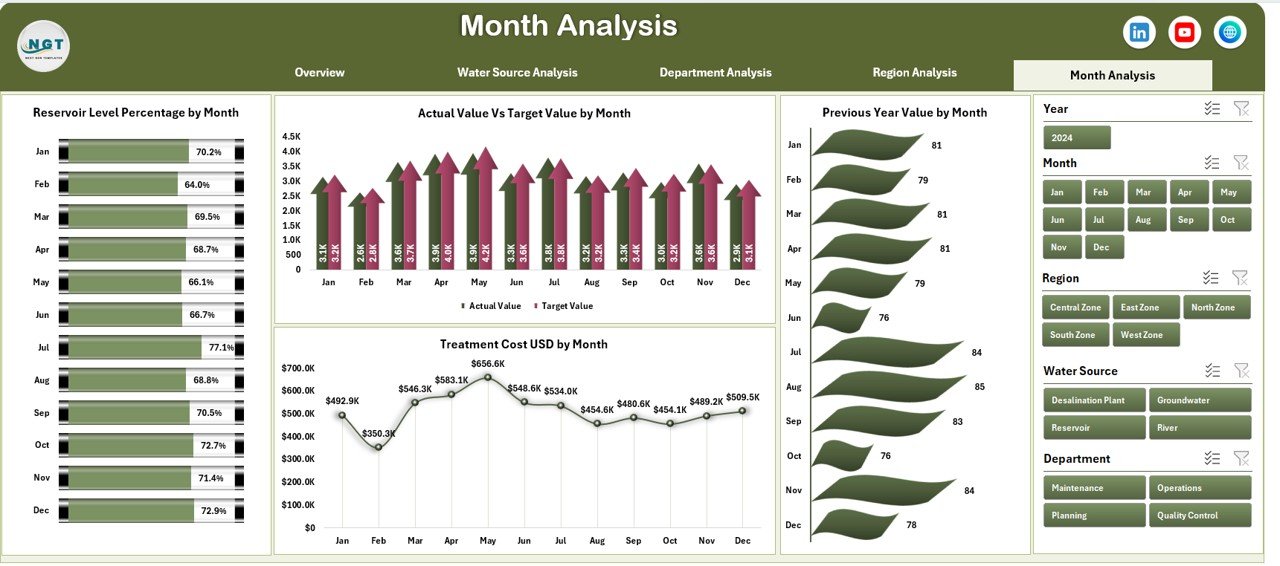
Seasonality directly impacts water performance. Therefore, month-wise tracking becomes essential.
This page includes:
-
Reservoir Level Percentage by Month
-
Actual Value vs Target Value by Month
-
Rainfall (mm) by Month
-
Previous Year Value by Month
With monthly analysis, organizations can:
-
Detect seasonal shortages
-
Plan water storage
-
Forecast next quarter needs
What KPIs Are Included in the Water Resource Management Dashboard?
The dashboard focuses on meaningful and measurable KPIs:
-
Reservoir Level (%)
-
Treatment Cost (USD)
-
Rainfall (mm)
-
Actual Consumption
-
Target Consumption
-
Previous Year Value
-
Variance %
-
Cost per Unit of Water
Each KPI supports strategic and operational decisions.
Advantages of Water Resource Management Dashboard in Excel
Using this dashboard offers multiple advantages. Let us explore them clearly.
1️⃣ Centralized Data Control
You can manage all water-related data in one Excel file. Therefore, you avoid confusion.
2️⃣ Better Cost Management
You can track treatment costs by region and source. As a result, you reduce unnecessary spending.
3️⃣ Improved Target Tracking
The Actual vs Target comparison highlights gaps instantly. Hence, departments stay accountable.
4️⃣ Faster Decision Making
Visual charts communicate insights quickly. Therefore, leaders act without delay.
5️⃣ Trend Analysis Made Easy
Month-wise and previous year comparisons show trends clearly. Consequently, planning improves.
6️⃣ Easy Customization
Since the dashboard runs in Excel, you can modify KPIs, charts, and formats easily.
7️⃣ No Complex Software Required
You do not need expensive tools. Excel handles everything effectively.
Best Practices for the Water Resource Management Dashboard in Excel
Click to Purchases Water Resource Management Dashboard in Excel
To get maximum value, follow these best practices:
✅ Update Data Regularly
Enter accurate monthly data consistently. Otherwise, reports may mislead.
✅ Set Realistic Targets
Define achievable water consumption and reservoir targets.
✅ Review Dashboard Monthly
Conduct monthly review meetings using dashboard insights.
✅ Compare with Previous Year
Always analyze trends against historical data.
✅ Train Your Team
Ensure your team understands how to use slicers and filters properly.
✅ Protect Data Integrity
Use Excel protection features to prevent accidental changes.
How Does the Support Sheet and Data Sheet Work?
Support Sheet
The Support Sheet stores backend calculations, lookup values, and reference tables. Therefore, it keeps the dashboard clean and organized.
Data Sheet
The Data Sheet captures raw monthly data, including:
-
Region
-
Department
-
Water Source
-
Month
-
Reservoir Level %
-
Rainfall mm
-
Treatment Cost USD
-
Target Value
-
Previous Year Value
Because the dashboard pulls data directly from this sheet, you only need to update one place.
How Can This Dashboard Help Different Organizations?
Municipal Corporations
Track city-level reservoir and rainfall data.
Manufacturing Plants
Monitor department-wise water usage and cost control.
Agriculture Authorities
Analyze rainfall patterns and regional supply.
Environmental Agencies
Track conservation performance and compliance.
Conclusion
Water management requires precision, planning, and performance tracking. However, manual spreadsheets slow down decision-making. Therefore, organizations need structured dashboards.
The Water Resource Management Dashboard in Excel provides clarity, control, and insight in one powerful system. It combines financial data, operational metrics, and trend analysis across five structured pages.
Because it runs in Excel, it remains accessible, customizable, and cost-effective.
If you want better water governance, smarter cost control, and stronger sustainability monitoring, this dashboard provides the perfect solution.
Frequently Asked Questions (FAQs)
1. Who can use the Water Resource Management Dashboard in Excel?
Municipal bodies, factories, environmental agencies, and water utilities can use it effectively.
2. Do I need advanced Excel skills to use this dashboard?
No. You only need basic Excel knowledge to update data and use slicers.
3. Can I customize KPIs in the dashboard?
Yes. You can modify KPIs, formulas, and charts based on your needs.
4. Does the dashboard support monthly and yearly comparison?
Yes. It includes month-wise analysis and previous year comparisons.
5. Can I add more regions or departments?
Yes. You can expand the data sheet and refresh the pivot tables.
6. Does the dashboard help reduce water costs?
Yes. It highlights high treatment cost regions and departments so you can take corrective action.
Visit our YouTube channel to learn step-by-step video tutorials