Humanitarian work demands clarity. Teams must track shelter support, food distribution, healthcare coverage, education access, and employment programs. However, when teams use scattered spreadsheets, they lose visibility. As a result, leaders struggle to measure impact. Moreover, decision-makers miss early warning signs.
Therefore, organizations need a structured system. A Refugee Support KPI Dashboard in Power BI gives complete visibility. It turns Excel data into clear visuals. It highlights target gaps instantly. Most importantly, it helps organizations improve outcomes for refugees.
In this detailed guide, you will learn:
Click to Purchases Refugee Support KPI Dashboard in Power BI
-
What a Refugee Support KPI Dashboard in Power BI is
-
Why refugee programs need KPI tracking
-
A complete explanation of all 3 dashboard pages
-
How Excel data connects to Power BI
-
Advantages of Refugee Support KPI Dashboard in Power BI
-
Best Practices for the Refugee Support KPI Dashboard in Power BI
-
Frequently Asked Questions with Answers
Let’s explore everything step by step.
What Is a Refugee Support KPI Dashboard in Power BI?
A Refugee Support KPI Dashboard in Power BI is a ready-to-use performance tracking solution. It captures humanitarian program data in Excel. Then, it converts that data into powerful interactive visuals inside Power BI.
Instead of reviewing raw numbers, program managers can:
-
Monitor MTD (Month-to-Date) performance
-
Compare YTD (Year-to-Date) results
-
Track target achievement instantly
-
Analyze previous year comparisons
-
Drill through to KPI definitions
As a result, organizations improve transparency. Moreover, they strengthen accountability. Furthermore, they make faster and smarter decisions.
Why Do Refugee Support Programs Need KPI Tracking?
Refugee support programs operate in complex environments. Funding comes from multiple donors. Field teams work across regions. Meanwhile, needs change quickly.
Therefore, organizations must answer important questions:
-
Are we meeting shelter targets this month?
-
Did healthcare coverage improve compared to last year?
-
Which KPI groups need urgent attention?
-
Are we achieving YTD program goals?
Without a structured dashboard, leaders rely on manual reports. However, manual reports consume time. Moreover, they increase errors.
On the other hand, a Power BI dashboard gives:
-
Real-time insights
-
Visual performance indicators
-
Clear target comparison
-
Historical trend analysis
Consequently, leadership gains full control over performance measurement.
What Are the Key Features of Refugee Support KPI Dashboard in Power BI?
This dashboard contains 3 structured pages in Power BI Desktop. Each page serves a specific purpose.
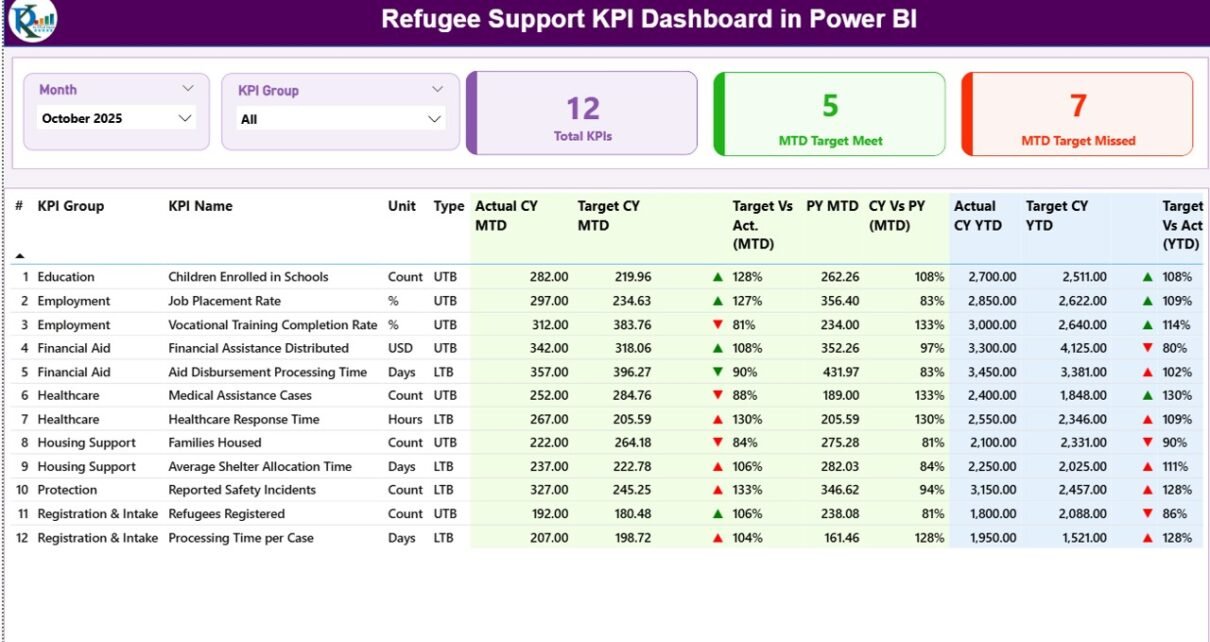
1️⃣ Summary Page – How Does It Provide Complete KPI Visibility?
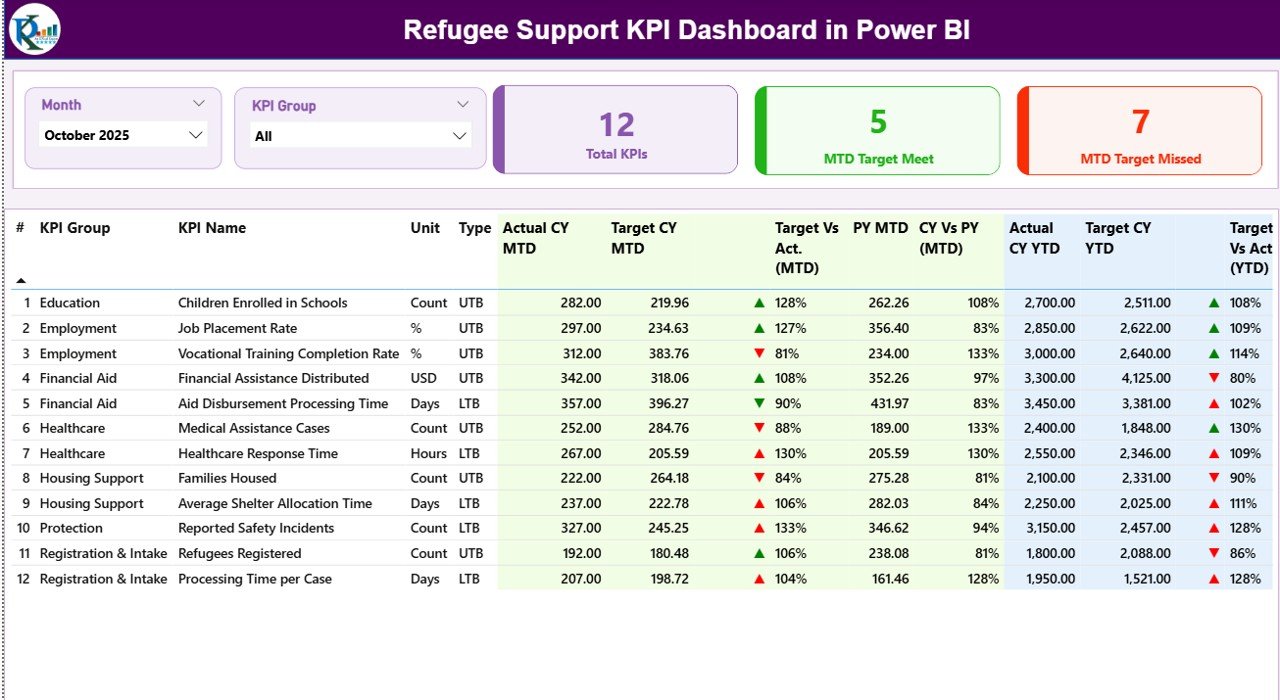
The Summary Page acts as the main control center. It gives a snapshot of performance across all KPIs.
Top Section: Smart Slicers
At the top, you will find:
-
Month slicer
-
KPI Group slicer
These slicers allow dynamic filtering. Therefore, you can analyze specific months or KPI categories instantly.
KPI Cards Section
Below the slicers, you will see 3 KPI cards:
-
Total KPIs Count
-
MTD Target Meet Count
-
MTD Target Missed Count
These cards provide instant performance status. As a result, leaders quickly understand overall progress.
Detailed KPI Table Section
The dashboard then displays a detailed table with the following fields:
KPI Number
Shows the sequence number of each KPI.
KPI Group
Defines the category such as:
-
Shelter Support
-
Healthcare Access
-
Education Enrollment
-
Food Distribution
-
Livelihood Programs
KPI Name
Displays the KPI title.
Unit
Indicates measurement unit:
-
Number
-
Percentage
-
Ratio
-
Days
-
Tons
Type (LTB or UTB)
-
UTB (Upper the Better) → Higher value indicates good performance.
-
LTB (Lower the Better) → Lower value indicates better performance.
This classification ensures accurate performance evaluation.
MTD Metrics Section
The dashboard calculates and displays:
-
Actual CY MTD
-
Target CY MTD
-
MTD Icon (▲ or ▼)
-
Target Vs Act. (MTD %)
-
PY MTD
-
CY Vs PY (MTD %)
MTD Icon Logic
-
▲ Green → Target achieved
-
▼ Red → Target missed
This visual indicator removes confusion. Therefore, managers instantly identify problem areas.
YTD Metrics Section
Similarly, the dashboard includes:
-
Actual CY YTD
-
Target CY YTD
-
YTD Icon
-
Target Vs Act. (YTD %)
-
PY YTD
-
CY Vs PY (YTD %)
Consequently, teams monitor long-term progress.
Click to Purchases Refugee Support KPI Dashboard in Power BI
2️⃣ KPI Trend Page – How Does It Help Analyze Performance Over Time?
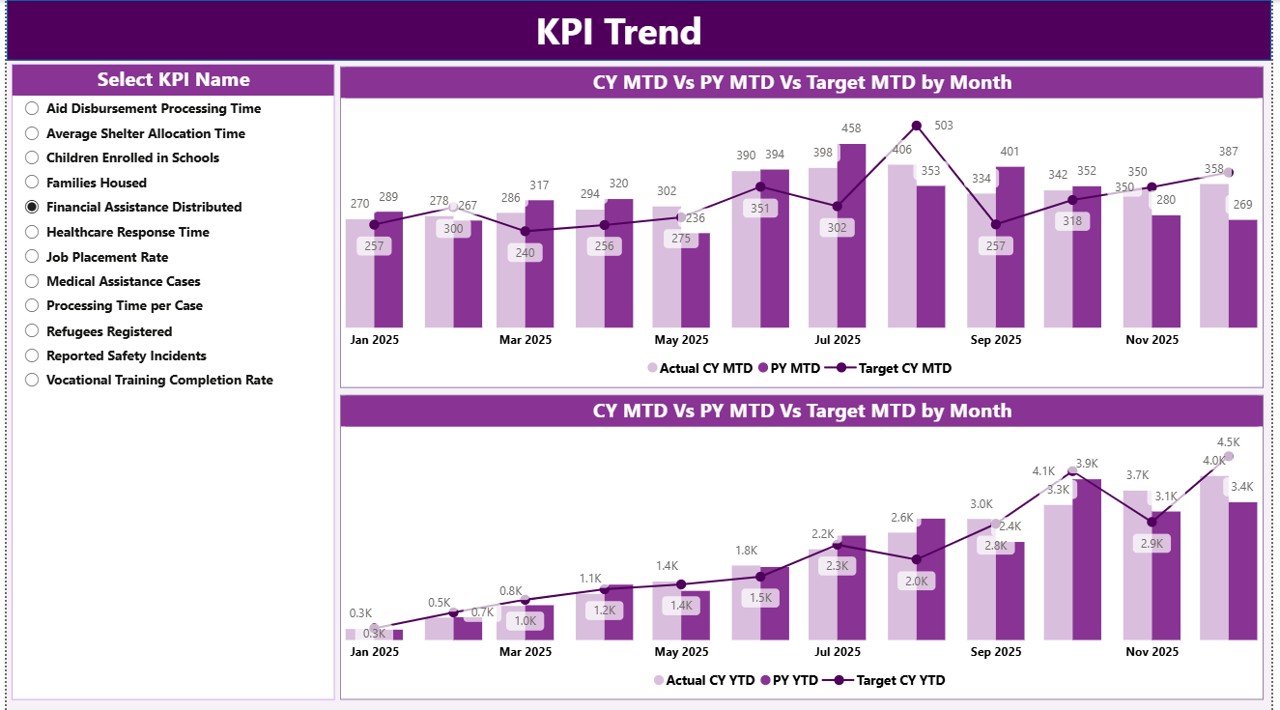
While the summary page gives snapshot insights, the KPI Trend Page shows movement over time.
Key Features:
-
2 Combo Charts
-
MTD Trend Chart
-
YTD Trend Chart
-
Each chart displays:
-
Current Year Actual
-
Previous Year Actual
-
Target Values
Additionally, a KPI Name slicer allows selection of a specific KPI.
Therefore, program managers can:
-
Identify seasonal trends
-
Compare year-over-year impact
-
Detect declining performance early
-
Monitor growth patterns
As a result, organizations respond quickly to changes.
3️⃣ KPI Definition Page – Why Is It Important?
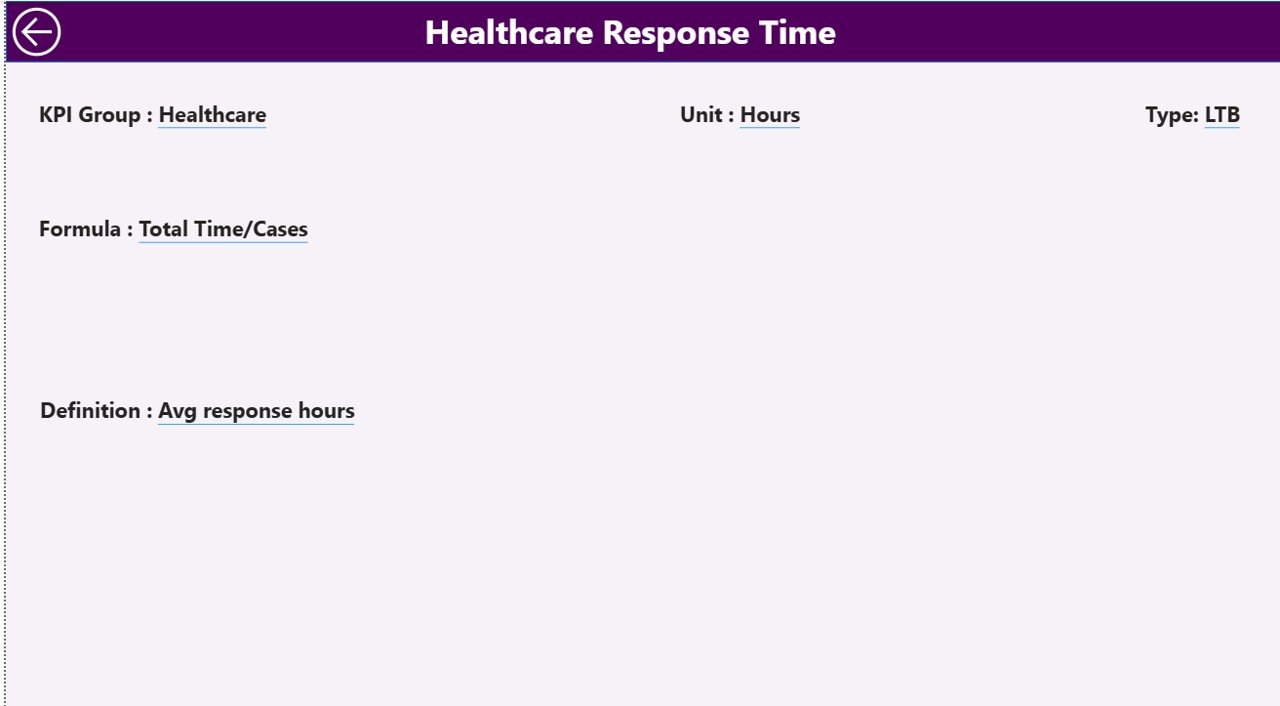
The KPI Definition page works as a drill-through page. The dashboard keeps it hidden for cleaner navigation.
From the summary page, users can drill through to view:
-
KPI Formula
-
KPI Definition
-
Measurement logic
This feature improves transparency. Moreover, it ensures everyone understands how KPIs are calculated.
A back button allows quick return to the summary page.
How Does the Excel Data Structure Work?
The dashboard connects to an Excel file. Therefore, users must update three worksheets.
1️⃣ Input_Actual Sheet
In this sheet, users fill:
-
KPI Name
-
Month (First date of month)
-
MTD numbers
-
YTD numbers
2️⃣ Input_Target Sheet
In this sheet, users enter:
-
KPI Name
-
Month (First date of month)
-
MTD target
-
YTD target
Therefore, the dashboard compares actual vs target.
3️⃣ KPI Definition Sheet
Click to Purchases Refugee Support KPI Dashboard in Power BI
This sheet includes:
-
KPI Number
-
KPI Group
-
KPI Name
-
Unit
-
Formula
-
Definition
-
Type (LTB or UTB)
This sheet controls KPI logic.
As long as users maintain consistency, the dashboard updates automatically.
How Does the Dashboard Calculate Performance?
The dashboard uses simple formulas:
Target Vs Act. (MTD)
Actual MTD ÷ Target MTD
CY Vs PY (MTD)
Current Year MTD ÷ Previous Year MTD
Target Vs Act. (YTD)
Actual YTD ÷ Target YTD
CY Vs PY (YTD)
Current Year YTD ÷ Previous Year YTD
These formulas ensure consistent measurement.
Advantages of Refugee Support KPI Dashboard in Power BI
Now let’s explore the major advantages.
1️⃣ Improves Transparency
The dashboard clearly shows:
-
Target achievement
-
Missed KPIs
-
Year comparison
Therefore, stakeholders gain trust.
2️⃣ Saves Reporting Time
Instead of building monthly reports manually, teams update Excel. Then, Power BI refreshes visuals automatically.
Consequently, organizations save hours every month.
3️⃣ Strengthens Decision-Making
Leaders instantly see performance gaps. Therefore, they allocate resources faster.
4️⃣ Encourages Accountability
Visual red and green indicators create ownership. Moreover, teams focus on improvement.
5️⃣ Supports Donor Reporting
Donors demand measurable impact. This dashboard provides structured data presentation.
6️⃣ Enables Year-over-Year Analysis
Comparing CY vs PY helps measure growth.
7️⃣ Scales Easily
Organizations can add more KPIs without changing structure.
Best Practices for the Refugee Support KPI Dashboard in Power BI
To maximize results, follow these best practices.
1️⃣ Maintain Clean Excel Data
-
Always use first date of month
-
Avoid blank KPI names
-
Keep units consistent
2️⃣ Review KPI Definitions Regularly
Ensure that formulas align with program goals.
3️⃣ Classify KPI Type Correctly
Choose UTB or LTB carefully. Otherwise, indicators show wrong status.
4️⃣ Monitor Monthly Trends
Do not focus only on MTD. Instead, review YTD regularly.
5️⃣ Train Program Managers
Ensure field teams understand KPI meaning.
6️⃣ Validate Data Before Refresh
Cross-check actual numbers before uploading.
7️⃣ Keep KPI Groups Organized
Group KPIs logically such as:
-
Health
-
Shelter
-
Food Security
-
Education
-
Livelihood
How Can Organizations Customize This Dashboard?
Organizations can:
-
Add regional filters
-
Include demographic breakdown
-
Add funding utilization KPIs
-
Integrate beneficiary feedback metrics
Therefore, the dashboard adapts to any refugee program structure.
How Does This Dashboard Improve Humanitarian Impact?
Click to Purchases Refugee Support KPI Dashboard in Power BI
Data drives action. When teams track KPIs properly:
-
They detect food shortages early
-
They expand healthcare coverage faster
-
They reduce service delays
-
They increase beneficiary satisfaction
Therefore, this dashboard does not only measure numbers. It improves lives.
Conclusion
Refugee support programs require precision, clarity, and accountability. However, manual reporting limits efficiency. Therefore, organizations need structured analytics.
The Refugee Support KPI Dashboard in Power BI transforms Excel data into powerful insights. It tracks MTD and YTD performance. It compares current and previous year values. Moreover, it highlights target gaps instantly.
As a result, organizations improve transparency. Furthermore, they strengthen decision-making. Most importantly, they deliver better support to refugees.
If you manage humanitarian programs, you should implement this dashboard today.
Frequently Asked Questions with Answers
1️⃣ What is the main purpose of the Refugee Support KPI Dashboard in Power BI?
It helps organizations track humanitarian KPIs, compare targets, and analyze performance trends.
2️⃣ Can I add more KPIs to this dashboard?
Yes. You can add new KPIs in the KPI Definition sheet and update actual and target data.
3️⃣ Does this dashboard require advanced Power BI skills?
No. You only need basic Excel knowledge to update data.
4️⃣ How often should I update the dashboard?
You should update it monthly for accurate MTD and YTD tracking.
5️⃣ Can this dashboard support multiple regions?
Yes. You can add region columns in Excel and update Power BI visuals.
6️⃣ What does UTB and LTB mean?
UTB means Upper the Better. LTB means Lower the Better.
7️⃣ Why does the dashboard compare Current Year and Previous Year?
Year comparison helps measure growth and impact improvement.
Visit our YouTube channel to learn step-by-step video tutorials