In today’s digital world, media buying moves fast. Campaigns launch quickly. Budgets shift daily. Platforms update algorithms often. Therefore, marketing teams must track performance in real time. Otherwise, costs increase, and results drop.So, how can you monitor media buying performance clearly and confidently?You need a Media Buying KPI Scorecard in Excel.This ready-to-use Excel template helps you track key performance indicators, compare actual vs target results, and monitor MTD and YTD performance — all in one structured dashboard. Instead of jumping between reports, you can view 10 KPIs in a single, powerful interface.
In this detailed guide, you will learn:
- What a Media Buying KPI Scorecard in Excel is
- Why media teams need it
- A complete explanation of all 4 worksheets
- Key KPIs you can track
- Advantages of Media Buying KPI Scorecard in Excel
- Best Practices for the Media Buying KPI Scorecard
- Frequently Asked Questions with Answers
Click to buy Media Buying KPI Scorecard in Excel
What Is a Media Buying KPI Scorecard in Excel?
A Media Buying KPI Scorecard in Excel is a structured performance tracking tool. It helps marketing teams measure campaign results against predefined targets.
Instead of reviewing scattered ad platform dashboards, you can consolidate all important KPIs in one Excel file. As a result, you gain clarity. Moreover, you improve decision-making.
This scorecard allows you to:
- Track MTD and YTD performance
- Compare actual vs target results
- Monitor trends over time
- Analyze performance gaps
- View KPI definitions and formulas
Therefore, you move from guesswork to data-driven action.
Why Do Media Buying Teams Need a KPI Scorecard?
Media buying involves multiple platforms like Google Ads, Meta Ads, LinkedIn Ads, and programmatic channels. However, each platform reports data differently. Consequently, reporting becomes complex.
Without a centralized scorecard:
- Teams miss performance trends
- Budgets overspend
- Low-performing campaigns continue
- Targets remain unclear
On the other hand, when you use a Media Buying KPI Scorecard in Excel:
- You standardize performance tracking
- You improve accountability
- You increase ROI visibility
- You align campaigns with business goals
Therefore, this tool becomes essential for agencies, in-house marketing teams, and performance marketers.
Key Features of Media Buying KPI Scorecard in Excel
This ready-to-use template includes 4 powerful worksheets. Each sheet serves a clear purpose.
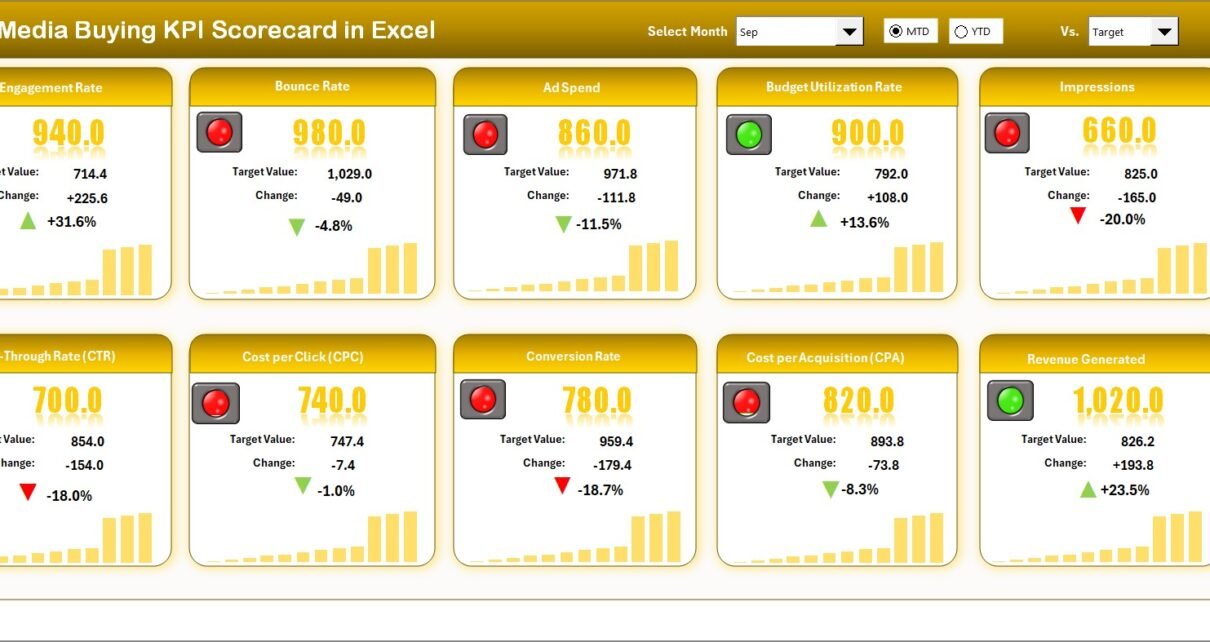
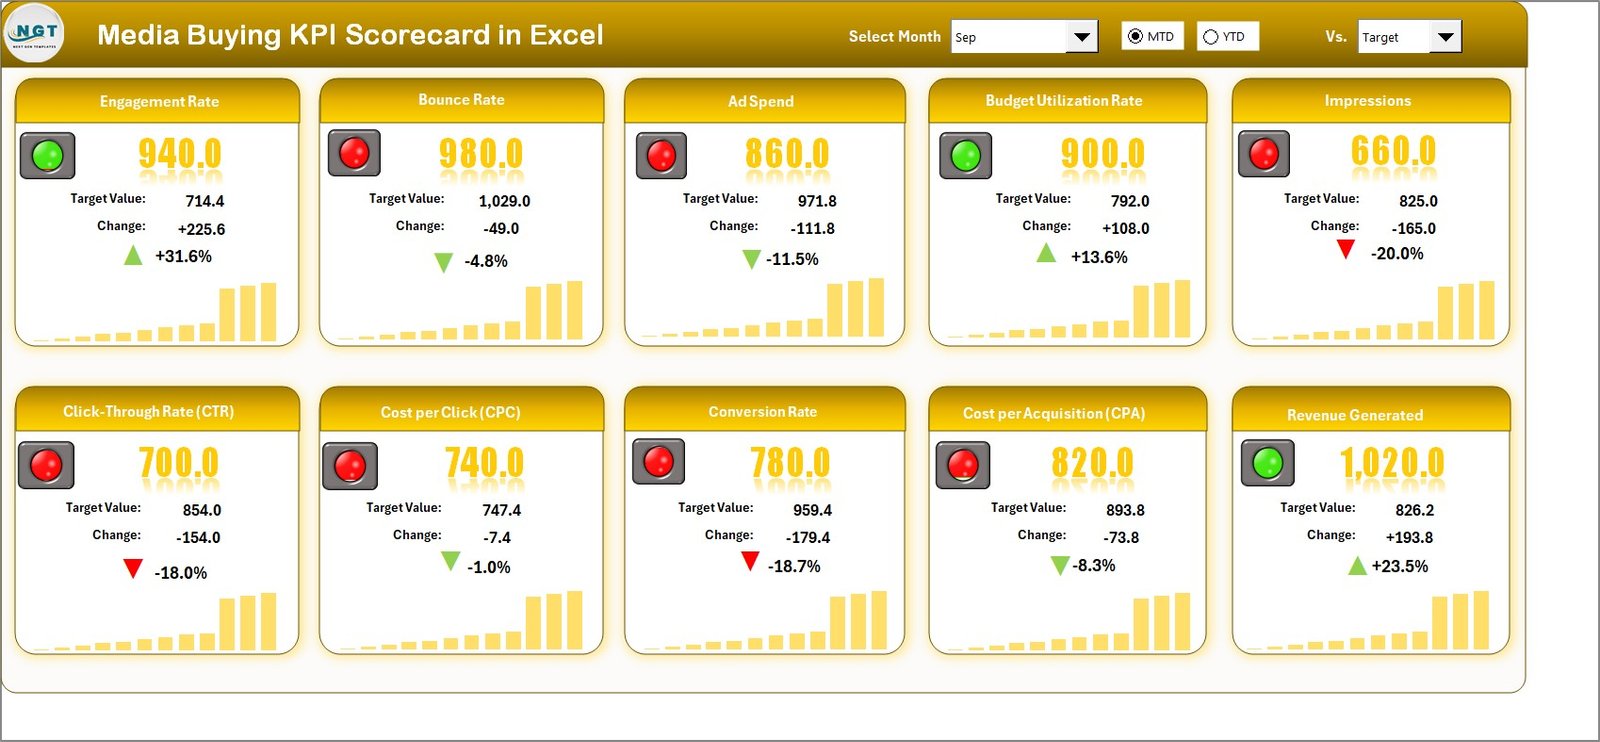
Scorecard Sheet – The Main Performance Dashboard
The Scorecard Sheet acts as the central command center.
What can you do here?
Dropdown Menus for Flexible Analysis
You can select:
- Month
- MTD (Month-to-Date)
- YTD (Year-to-Date)
Therefore, you instantly switch between time periods.
Actual vs Target Comparison
The sheet displays:
- Actual value
- Target value
- Variance
- Performance percentage
As a result, you quickly identify overperformance or underperformance.
Visual Indicators
The template uses:
- Color-coded signals
- Conditional formatting
- Performance arrows
Therefore, you understand KPI status in seconds.
10 KPIs in One View
You can monitor 10 media buying KPIs simultaneously. This layout saves time and improves clarity.
Click to buy Media Buying KPI Scorecard in Excel
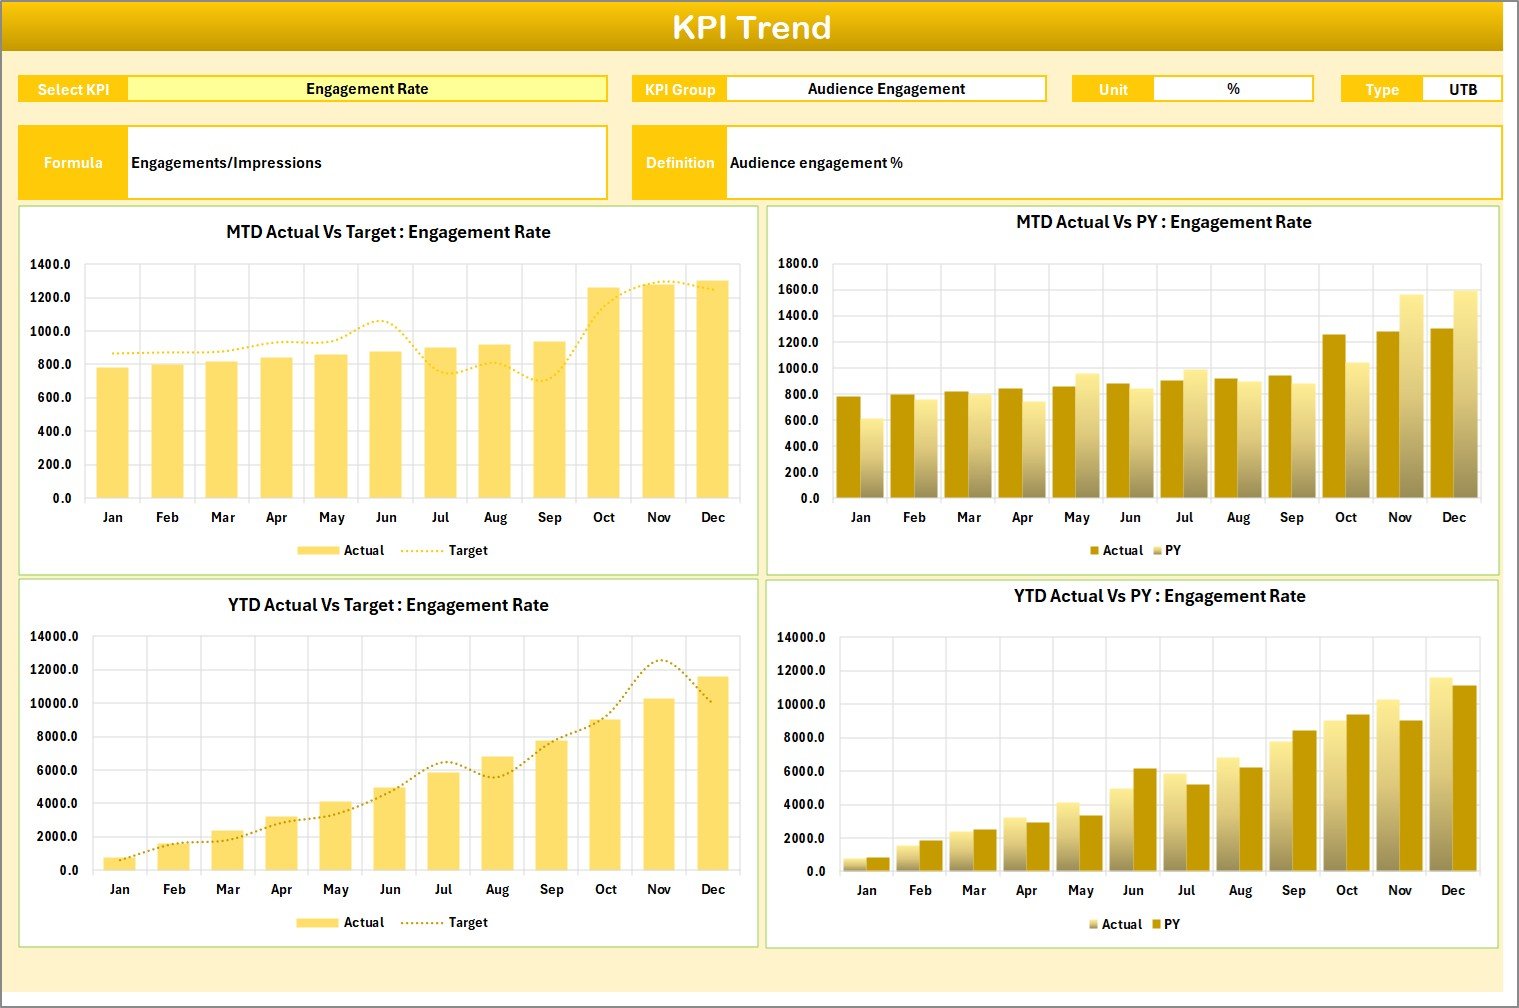
KPI Trend Sheet – Deep Performance Analysis
The KPI Trend Sheet provides detailed insights.
In cell C3, you can select a KPI name from a dropdown list. Then, the sheet dynamically displays:
- KPI Group
- Unit of KPI
- KPI Type (Lower the Better or Upper the Better)
- KPI Formula
- KPI Definition
Moreover, it shows:
- MTD Trend Chart
- YTD Trend Chart
- Actual vs Target vs Previous Year (PY)
Therefore, you can analyze performance trends visually and strategically.
Click to buy Media Buying KPI Scorecard in Excel
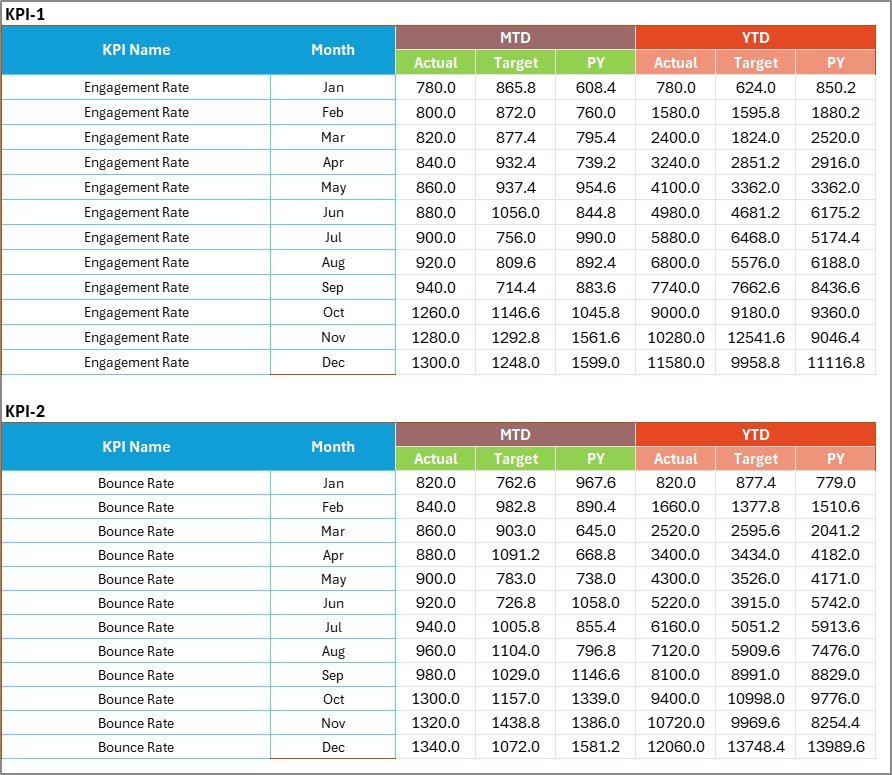
Input Data Sheet – Data Entry Hub
The Input Data Sheet allows you to enter:
- Actual values
- Target values
- Monthly data
- Previous year data
You can update results easily as campaigns progress. Therefore, the scorecard always reflects current performance.
Click to buy Media Buying KPI Scorecard in Excel
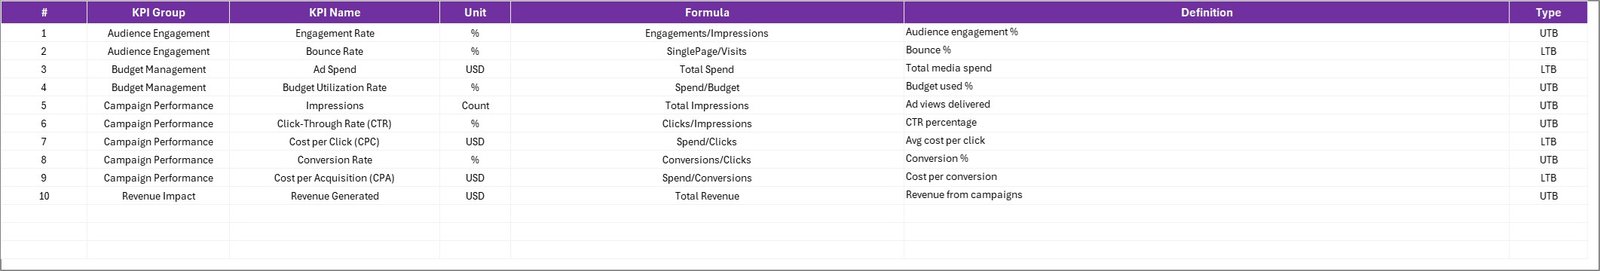
KPI Definition Sheet – KPI Documentation Center
This sheet helps you maintain clarity.
Here, you enter:
- KPI Name
- KPI Group
- Unit
- Formula
- KPI Definition
As a result, all stakeholders understand what each KPI means. Moreover, you avoid confusion across teams.
Click to buy Media Buying KPI Scorecard in Excel
What KPIs Can You Track in a Media Buying KPI Scorecard?
You can track various performance indicators. For example:
- Click-Through Rate (CTR)
- Cost Per Click (CPC)
- Cost Per Acquisition (CPA)
- Return on Ad Spend (ROAS)
- Conversion Rate
- Impressions
- Reach
- Engagement Rate
- Cost Per Lead (CPL)
- Revenue Generated
You can categorize them into KPI Groups such as:
- Traffic KPIs
- Cost KPIs
- Conversion KPIs
- Revenue KPIs
Therefore, you gain structured insight into campaign performance.
How Does MTD and YTD Tracking Improve Decisions?
MTD tracking shows short-term progress. On the other hand, YTD tracking shows long-term performance.
For example:
- If MTD ROAS drops, you adjust bids immediately.
- If YTD CPA improves, you scale campaigns confidently.
Therefore, combining both views strengthens strategic planning.
Advantages of Media Buying KPI Scorecard in Excel
Using this scorecard offers multiple benefits.
Centralized Reporting
You bring all KPIs into one structured file.
Clear Performance Visibility
You see actual vs target instantly.
Faster Decision-Making
You identify performance gaps quickly.
Budget Optimization
You allocate budget based on real results.
Trend Monitoring
You analyze performance patterns over time.
Improved Accountability
You assign KPI ownership clearly.
Easy Customization
You modify KPIs based on campaign goals.
Cost-Effective Solution
You use Excel instead of expensive BI tools.
How Can You Use This Scorecard in Real Campaign Scenarios?
Let’s say your ROAS target equals 4.0.
- If actual ROAS equals 3.2, the visual indicator highlights underperformance.
- Therefore, you adjust audience targeting or creative strategy.
Similarly:
- If CTR improves but conversions drop, you analyze landing page quality.
- If CPA increases, you pause expensive ad sets.
Thus, this scorecard supports proactive management.
Who Should Use a Media Buying KPI Scorecard in Excel?
This tool suits:
- Digital marketing agencies
- Performance marketing managers
- Media buyers
- Marketing analysts
- E-commerce teams
- Startup growth teams
Therefore, anyone managing paid campaigns benefits from this template.
Best Practices for the Media Buying KPI Scorecard
To maximize results, follow these best practices. Define Clear Targets
Set realistic and measurable KPI targets.
Update Data Regularly
Enter data weekly or monthly to maintain accuracy.
Review Trends Consistently
Analyze MTD and YTD trends before making decisions.
Align KPIs with Business Goals
Track revenue-driven KPIs, not vanity metrics.
Use Conditional Formatting Wisely
Keep visuals clear and meaningful.
Document KPI Definitions
Ensure everyone understands calculations.
Monitor Variance Closely
Act quickly when performance drops.
How to Set Up Media Buying KPI Targets Effectively?
You can follow these steps:
- Analyze historical campaign data.
- Benchmark against industry standards.
- Define stretch but achievable goals.
- Align targets with budget limits.
- Review targets quarterly.
Therefore, you create realistic performance expectations.
How Does Excel Make KPI Tracking Powerful Yet Simple?
Excel offers flexibility. You can:
- Use formulas
- Apply conditional formatting
- Create dynamic dropdowns
- Build trend charts
- Use pivot tables
Moreover, Excel works without complex setup. Therefore, marketing teams can implement it quickly.
How to Customize the Media Buying KPI Scorecard?
You can customize it by:
- Adding new KPIs
- Changing KPI groups
- Adjusting performance thresholds
- Updating time periods
- Modifying visual indicators
Thus, the template adapts to your business model.
Conclusion:
Media buying requires precision. Every click costs money. Every conversion impacts revenue. Therefore, you must track performance consistently.
The Media Buying KPI Scorecard in Excel provides:
- Clear performance visibility
- Structured KPI monitoring
- MTD and YTD comparison
- Trend analysis
- Data-driven insights
Instead of relying on fragmented reports, you can manage campaigns confidently and strategically.
If you want better control over ad spend, improved ROI tracking, and smarter media decisions, this Excel scorecard becomes your essential performance tool.
Frequently Asked Questions with Answers
- What is a Media Buying KPI Scorecard in Excel?
It is an Excel-based performance tracking template that monitors media buying KPIs, compares actual vs target, and displays MTD and YTD results.
- How many worksheets does this template include?
It includes 4 worksheets:
- Scorecard Sheet
- KPI Trend Sheet
- Input Data Sheet
- KPI Definition Sheet
- Can I customize the KPIs?
Yes. You can add, remove, or modify KPIs based on your campaign needs.
- What type of KPIs can I track?
You can track CTR, CPC, CPA, ROAS, Conversion Rate, Impressions, Revenue, CPL, and more.
- Does this scorecard support MTD and YTD tracking?
Yes. You can select MTD or YTD using dropdown menus.
- Who should use this scorecard?
Media buyers, agencies, marketing managers, analysts, and growth teams can use it.
- Why should I use Excel instead of other tools?
Excel offers flexibility, customization, and cost-effectiveness without complex setup.
Visit our YouTube channel to learn step-by-step video tutorials
Watch the step-by-step video tutorial:
Click to buy Media Buying KPI Scorecard in Excel