he paper and pulp industry runs on efficiency, cost control, and production accuracy. However, many mills still depend on scattered spreadsheets and manual reports. As a result, managers struggle to monitor raw material costs, energy usage, running machine percentage, and profitability in one place.
So, how can you track production performance, monitor costs, and improve profits using a single structured system?
The answer is simple.
You need a Paper and Pulp Dashboard in Excel.
Click to Purchases Paper and Pulp Dashboard in Excel
This ready-to-use Excel dashboard converts raw operational data into powerful visual insights. Moreover, it helps plant managers, production heads, and finance teams track costs, revenue, machine performance, and profitability instantly. Instead of reviewing multiple files, you can filter and analyze everything from one interactive workbook.
In this detailed guide, you will learn:
-
What a Paper and Pulp Dashboard in Excel is
-
Why paper manufacturers need it
-
Complete explanation of all 5 dashboard pages
-
Key KPIs and metrics you can track
-
Advantages of Paper and Pulp Dashboard in Excel
-
Best Practices for the Paper and Pulp Dashboard in Excel
-
Frequently Asked Questions with Answers
Let us explore everything step by step.
What Is a Paper and Pulp Dashboard in Excel?
A Paper and Pulp Dashboard in Excel is an interactive reporting tool designed to help paper mills monitor production, cost, and profitability in real time.
It transforms structured production and financial data into:
-
KPI cards
-
Dynamic charts
-
Slicer-based filters
-
Monthly trend analysis
Instead of checking raw data manually, you can select filters from the right-side slicers and instantly view updated charts. Therefore, you save time and make faster decisions.
Moreover, since the dashboard runs in Excel, you do not need expensive software or complex systems. You simply update the data sheet, and the dashboard updates automatically.
Why Do Paper Mills Need a Dashboard in Excel?
Paper production involves:
-
Multiple mills
-
Various product types
-
Different raw material categories
-
Energy consumption by shift
-
Region-based cost variations
However, without structured reporting, decision-makers miss cost overruns and profit gaps. Consequently, inefficiencies grow over time.
A Paper and Pulp Dashboard solves this problem because:
-
It centralizes all operational data
-
It shows cost and revenue comparisons clearly
-
It highlights profit trends instantly
-
It improves transparency across mills
Therefore, leaders can control expenses, increase efficiency, and improve overall profitability.
Key Features of Paper and Pulp Dashboard in Excel
This dashboard includes 5 analytical pages inside a single Excel desktop file. In addition, it provides a smooth navigation system.
📌 Page Navigator
The Page Navigator sits on the left side of the dashboard. It allows quick movement between analytical pages.
As a result:
-
Users save time
-
Navigation becomes simple
-
The reporting flow feels structured
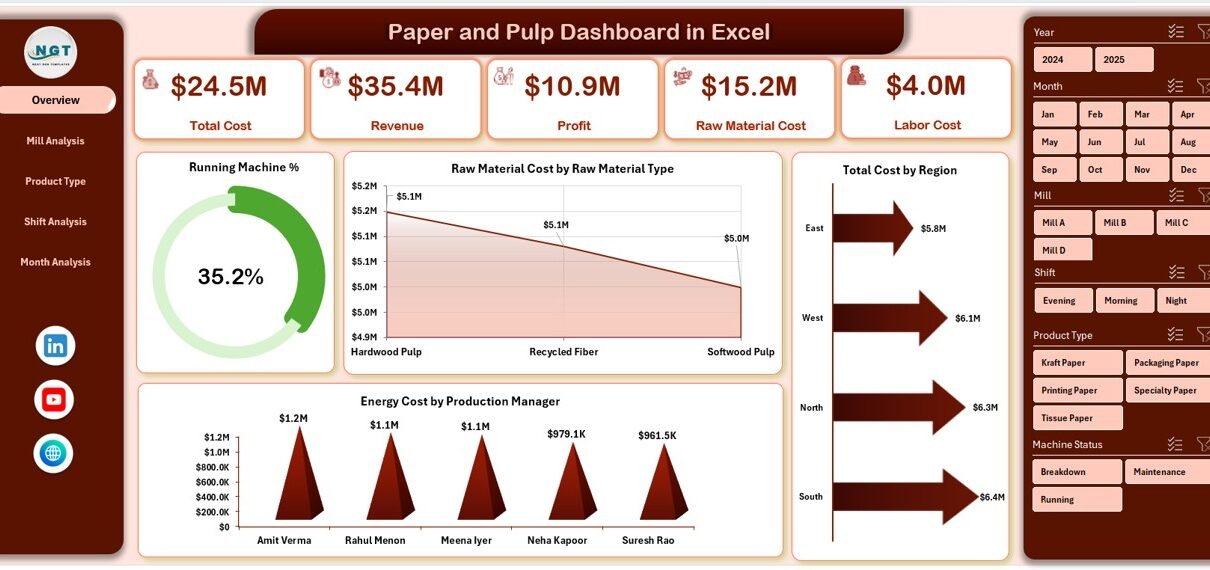
1️⃣ Overview Page – What Does It Show?

The Overview page acts as the central performance control panel.
🔹 Filters (Right-Side Slicers)
You can filter data by:
-
Mill
-
Product Type
-
Shift
-
Region
-
Month
Therefore, the entire dashboard updates instantly when you apply filters.
Click to Purchases Paper and Pulp Dashboard in Excel
🔹 KPI Cards
The dashboard displays 4 KPI cards at the top. These cards provide a quick performance summary.
🔹 Charts on Overview Page
The page includes four powerful charts:
-
Running Machine %
-
Raw Material Cost by Raw Material Type
-
Total Cost by Region
-
Energy Cost by Production Manager
Let us understand them one by one.
📊 Running Machine %
This chart shows machine utilization percentage.
-
Higher percentage indicates better production efficiency.
-
Lower percentage highlights downtime or maintenance issues.
Therefore, plant managers can quickly identify operational gaps.
📊 Raw Material Cost by Raw Material Type
Raw materials form a major cost component in pulp manufacturing.
This chart helps you:
-
Compare wood pulp, recycled fiber, chemicals, etc.
-
Identify the most expensive raw material.
-
Control cost variation.
As a result, procurement teams can optimize supplier selection.
📊 Total Cost by Region
If your mills operate across regions, cost differences often occur due to:
-
Labor rates
-
Energy prices
-
Transportation expenses
This chart helps you compare regional performance and identify cost-heavy locations.
📊 Energy Cost by Production Manager
Energy consumption affects profit margins significantly.
This visual shows:
-
Energy cost under each production manager
-
Performance differences between managers
Therefore, management can review energy efficiency practices.
2️⃣ Mill Analysis – How Does Each Mill Perform?
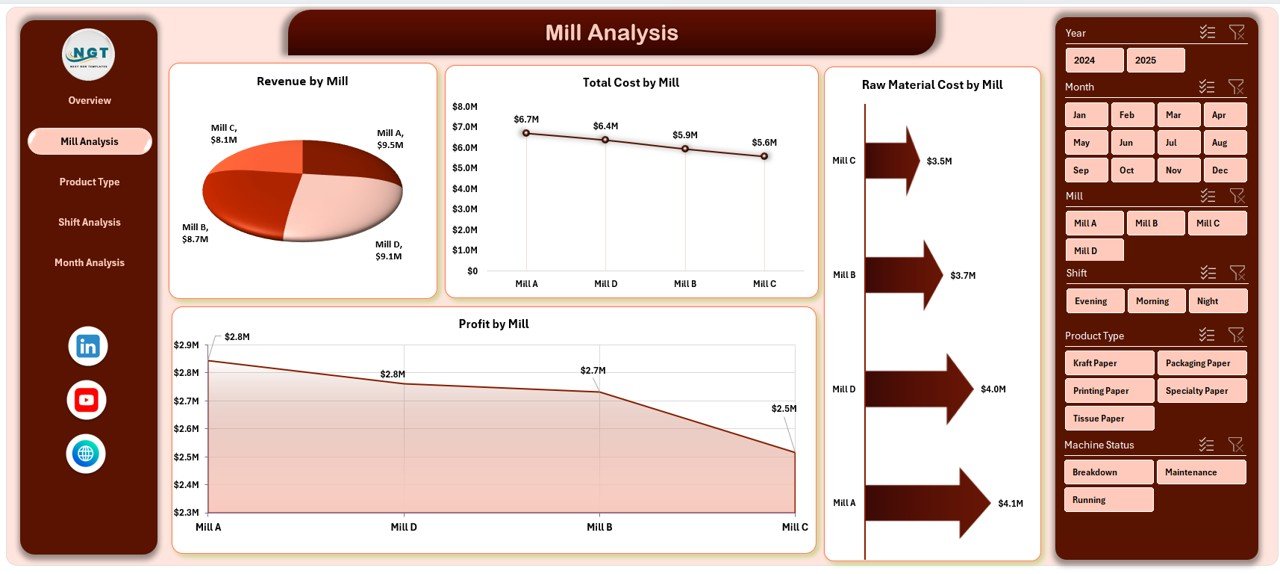
The Mill Analysis page focuses on mill-level financial performance.
It includes 4 major charts:
-
Raw Material Cost by Mill
-
Total Cost by Mill
-
Revenue by Mill
-
Profit by Mill
Why Is Mill Analysis Important?
Each mill operates under different conditions. Therefore, comparing mills helps you:
-
Identify top-performing mills
-
Detect loss-making units
-
Optimize operational strategy
For example:
If Mill A generates high revenue but low profit, then cost control requires attention.
On the other hand, if Mill B shows high profit margin, management can replicate its strategy across other mills.
3️⃣ Product Type Analysis – Which Product Generates More Profit?
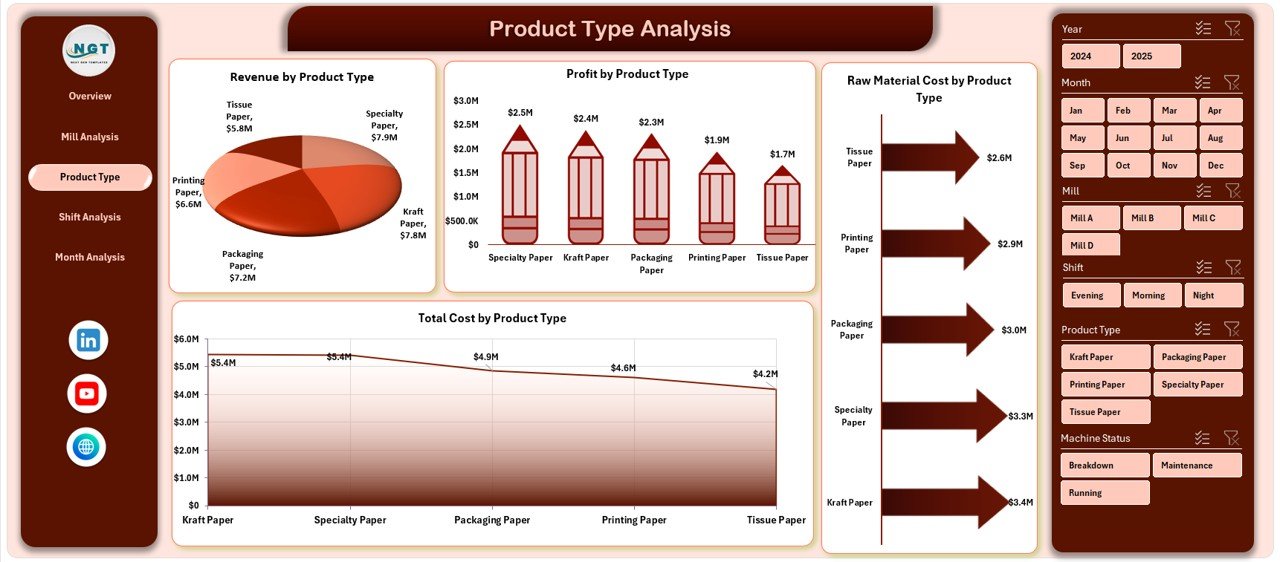
Paper companies produce different product types such as:
-
Printing paper
-
Packaging board
-
Tissue paper
-
Specialty paper
This page provides:
-
Raw Material Cost by Product Type
-
Total Cost by Product Type
-
Revenue by Product Type
-
Profit by Product Type
Why Product Analysis Matters?
Not all products generate equal profit.
For example:
-
Packaging paper may show high revenue.
-
Specialty paper may deliver higher margins.
Therefore, you can:
-
Focus on high-profit products
-
Adjust production planning
-
Improve product mix strategy
-
Click to Purchases Paper and Pulp Dashboard in Excel
4️⃣ Shift Analysis – Does Shift Timing Affect Profitability?
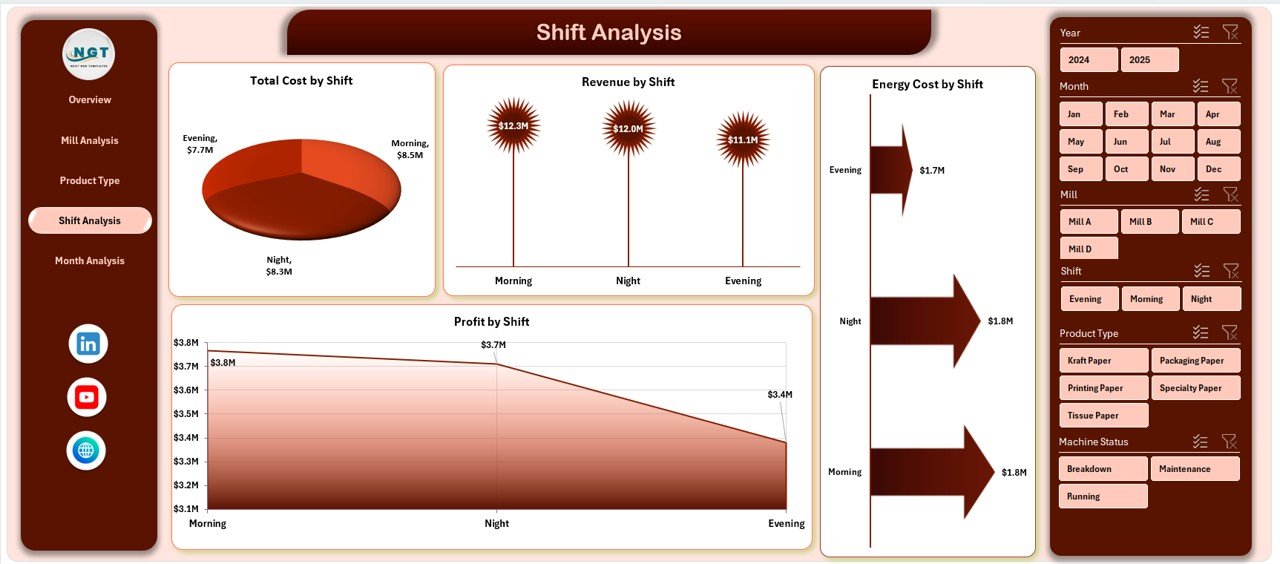
Production runs in multiple shifts such as:
-
Morning Shift
-
Evening Shift
-
Night Shift
This page analyzes:
-
Energy Cost by Shift
-
Total Cost by Shift
-
Revenue by Shift
-
Profit by Shift
Why Shift Analysis Helps?
Sometimes:
-
Night shifts consume more energy.
-
Morning shifts generate better productivity.
Therefore, management can:
-
Adjust shift allocation
-
Improve workforce efficiency
-
Reduce energy waste
5️⃣ Month Analysis – How Does Performance Change Over Time?
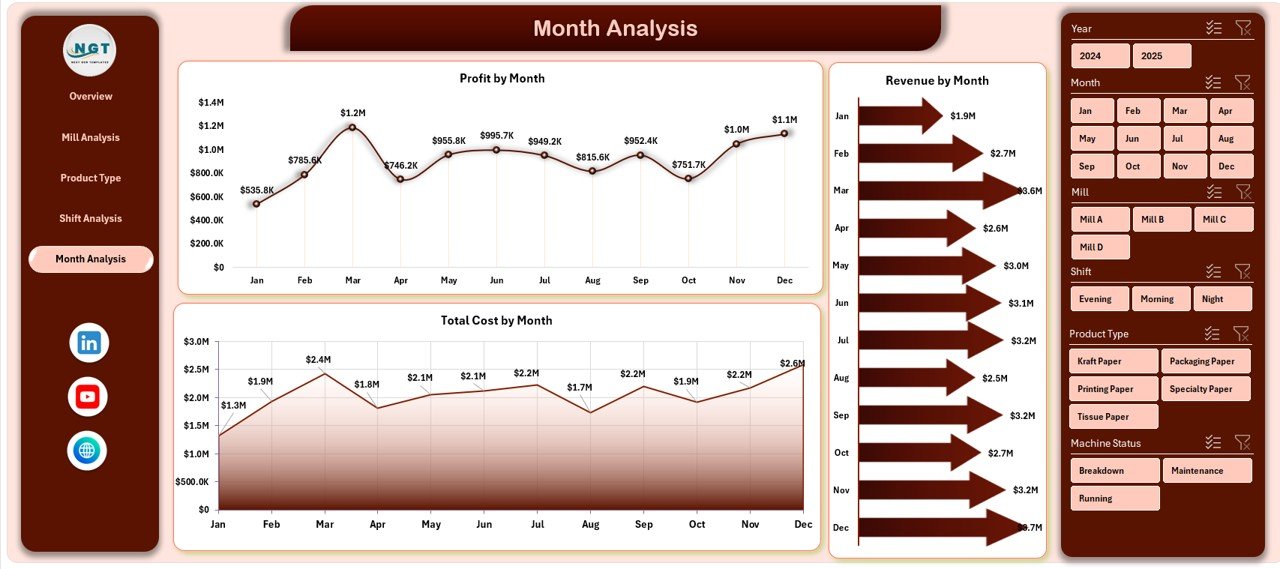
This page shows:
-
Total Cost by Month
-
Revenue by Month
-
Profit by Month
Monthly analysis helps you:
-
Detect seasonal patterns
-
Identify rising cost trends
-
Forecast future profitability
For instance:
If profit declines continuously for three months, management can act immediately.
Data Sheet – Where Does the Dashboard Pull Data From?
The Data Sheet stores:
-
Mill-wise revenue
-
Raw material cost
-
Energy cost
-
Shift-wise production
-
Monthly financial data
You simply update the data rows. After that, the dashboard updates automatically.
Support Sheet – How Does It Help?
The Support Sheet manages:
-
Lookup values
-
Slicer data
-
Calculation support
-
Structured tables
It keeps backend formulas organized. Therefore, the dashboard runs smoothly.
Key Metrics You Can Track in Paper and Pulp Dashboard
Click to Purchases Paper and Pulp Dashboard in Excel
You can monitor:
-
Running Machine %
-
Raw Material Cost
-
Energy Cost
-
Total Cost
-
Revenue
-
Profit
-
Profit Margin
-
Regional Cost Comparison
-
Monthly Trends
These metrics help you take faster and smarter decisions.
Advantages of Paper and Pulp Dashboard in Excel
1️⃣ Improves Cost Control
You can instantly identify cost-heavy areas. Therefore, you reduce waste and improve margins.
2️⃣ Enhances Operational Efficiency
Machine utilization tracking helps reduce downtime.
3️⃣ Increases Profit Visibility
Profit charts show which mills and products generate higher returns.
4️⃣ Simplifies Decision Making
Visual reports make analysis easy and fast.
5️⃣ No Expensive Software Required
You use Excel, which most organizations already have.
6️⃣ Real-Time Data Updates
When you update the data sheet, charts update automatically.
7️⃣ Better Resource Allocation
You can shift resources toward high-performing units.
Best Practices for the Paper and Pulp Dashboard in Excel
To maximize dashboard effectiveness, follow these best practices:
✅ Keep Data Clean
Always:
-
Remove duplicate entries
-
Maintain consistent units
-
Validate cost values
✅ Update Data Regularly
Update monthly or weekly data consistently. Otherwise, insights lose accuracy.
✅ Use Structured Tables
Convert raw data into Excel Tables. This improves dynamic reporting.
✅ Monitor Trends Frequently
Do not check the dashboard only during meetings. Instead, review it weekly.
✅ Train Team Members
Ensure production and finance teams understand how to use slicers and filters.
✅ Review High-Cost Areas
Focus on:
-
High energy usage
-
Raw material price fluctuations
-
Low machine utilization
How Does This Dashboard Improve Profitability?
Click to Purchases Paper and Pulp Dashboard in Excel
This dashboard improves profitability because it:
-
Reduces unnecessary cost
-
Identifies inefficient mills
-
Highlights profitable products
-
Tracks seasonal revenue trends
-
Encourages data-driven decisions
Therefore, companies improve financial performance systematically.
Who Can Benefit from This Dashboard?
This dashboard benefits:
-
Plant Managers
-
Production Heads
-
Finance Managers
-
Operations Directors
-
Procurement Teams
-
Regional Managers
In short, anyone involved in paper manufacturing performance management can use it.
Conclusion
The paper and pulp industry demands accuracy, efficiency, and cost control. However, manual spreadsheets limit visibility and slow down decisions.
The Paper and Pulp Dashboard in Excel provides a structured and interactive solution. It combines machine performance, cost tracking, revenue analysis, and profitability monitoring into one powerful reporting system.
Moreover, it simplifies complex data into clear visuals. Therefore, management can act quickly, control costs, and increase profits.
If you want better control over production and financial performance, this dashboard offers a practical and effective solution.
Frequently Asked Questions with Answers
1. What is a Paper and Pulp Dashboard in Excel?
It is an interactive Excel-based reporting tool that tracks production, cost, revenue, and profit for paper mills.
2. Can I customize the dashboard?
Yes. You can modify charts, add new KPIs, and adjust filters based on your requirements.
3. Do I need advanced Excel skills to use it?
No. You only need basic Excel knowledge to update the data sheet and use slicers.
4. How often should I update the data?
You should update the data monthly. However, weekly updates improve monitoring accuracy.
5. Does this dashboard support multiple mills?
Yes. It allows analysis by mill, region, product type, shift, and month.
6. Can this dashboard help reduce energy costs?
Yes. It highlights energy cost by production manager and shift. Therefore, you can identify inefficient areas.
7. Is this dashboard suitable for small paper mills?
Yes. Both small and large manufacturers can use it effectively.
Visit our YouTube channel to learn step-by-step video tutorials