Equipment failures cost money. Unexpected breakdowns delay production. Moreover, emergency repairs increase expenses and reduce efficiency. Therefore, every organization needs a smart way to manage maintenance activities.
However, many companies still rely on scattered spreadsheets and manual tracking systems. As a result, maintenance managers struggle to monitor scheduled tasks, overdue jobs, technician performance, and maintenance costs.So, how can organizations track preventive maintenance effectively in one centralized system?You need a Preventive Maintenance Dashboard in Power BI.This ready-to-use Power BI solution transforms raw maintenance data into interactive visual insights. Instead of guessing maintenance status, you can filter, analyze, and monitor everything in real time.
In this complete guide, you will learn:
- What a Preventive Maintenance Dashboard in Power BI is
- Why businesses need it
- A detailed explanation of all 5 dashboard pages
- Key KPIs you can track
- Advantages of Preventive Maintenance Dashboard in Power BI
- Best Practices for the Preventive Maintenance Dashboard
- Frequently Asked Questions with Answers
Click to buy Preventive Maintenance Dashboard in Power BI
What Is a Preventive Maintenance Dashboard in Power BI?
A Preventive Maintenance Dashboard in Power BI is a dynamic reporting system that tracks maintenance schedules, completion rates, overdue tasks, equipment performance, technician efficiency, and maintenance costs.
Instead of reviewing multiple Excel sheets, you can monitor:
- Total maintenance tasks
- Scheduled maintenance percentage
- Overdue maintenance percentage
- Completed maintenance percentage
- Maintenance cost in USD
- Equipment performance
- Technician productivity
Moreover, Power BI allows you to use slicers and filters. Therefore, you can analyze data by equipment, maintenance type, frequency, technician, or time period instantly.
As a result, maintenance managers gain full visibility and make faster decisions.
Why Do Organizations Need a Preventive Maintenance Dashboard?
Maintenance directly impacts production, safety, and operational efficiency. However, poor tracking leads to missed schedules and rising costs.
Here is why organizations need this dashboard:
Reduce Equipment Downtime
When you track scheduled maintenance properly, you reduce unexpected breakdowns. Consequently, production remains stable.
Control Maintenance Costs
You can monitor maintenance cost in USD in real time. Therefore, you avoid budget overruns.
Improve Technician Performance
You can measure completed maintenance percentage by technician. As a result, you identify high performers and improvement areas.
Monitor Overdue Maintenance
Overdue tasks increase operational risk. However, this dashboard highlights overdue percentages clearly. Therefore, you can take immediate action.
Make Data-Driven Decisions
Instead of assumptions, you use visual insights. Consequently, planning becomes more accurate.
Detailed Explanation of All 5 Dashboard Pages
This Preventive Maintenance Dashboard in Power BI includes 5 interactive pages. Each page focuses on a different analysis area.
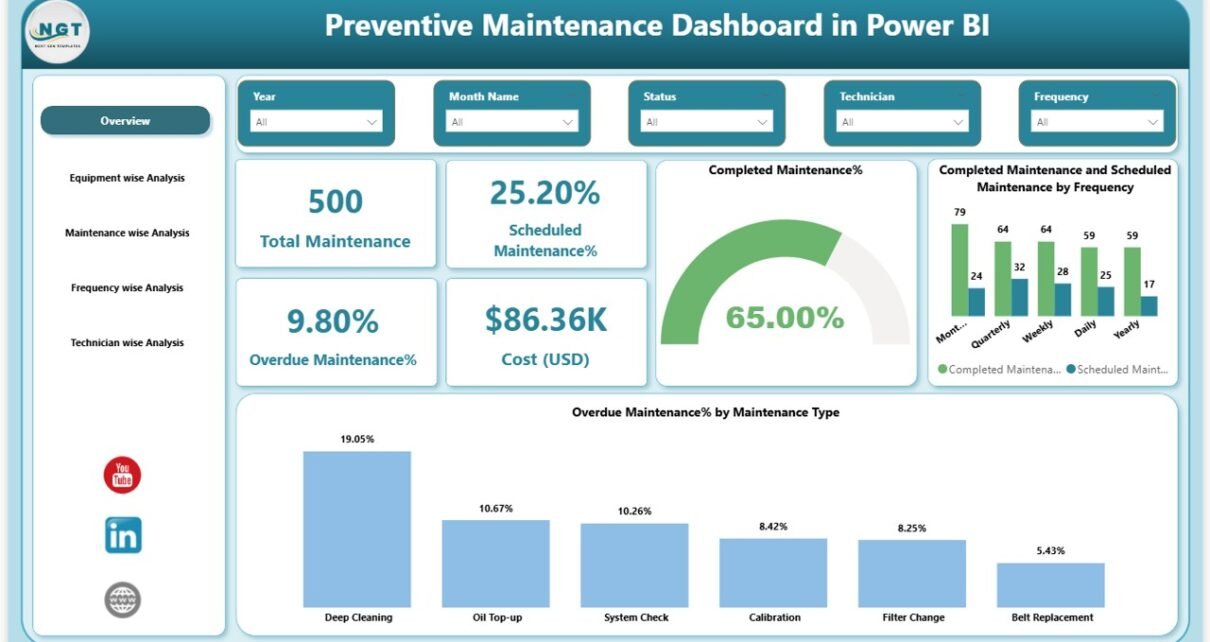
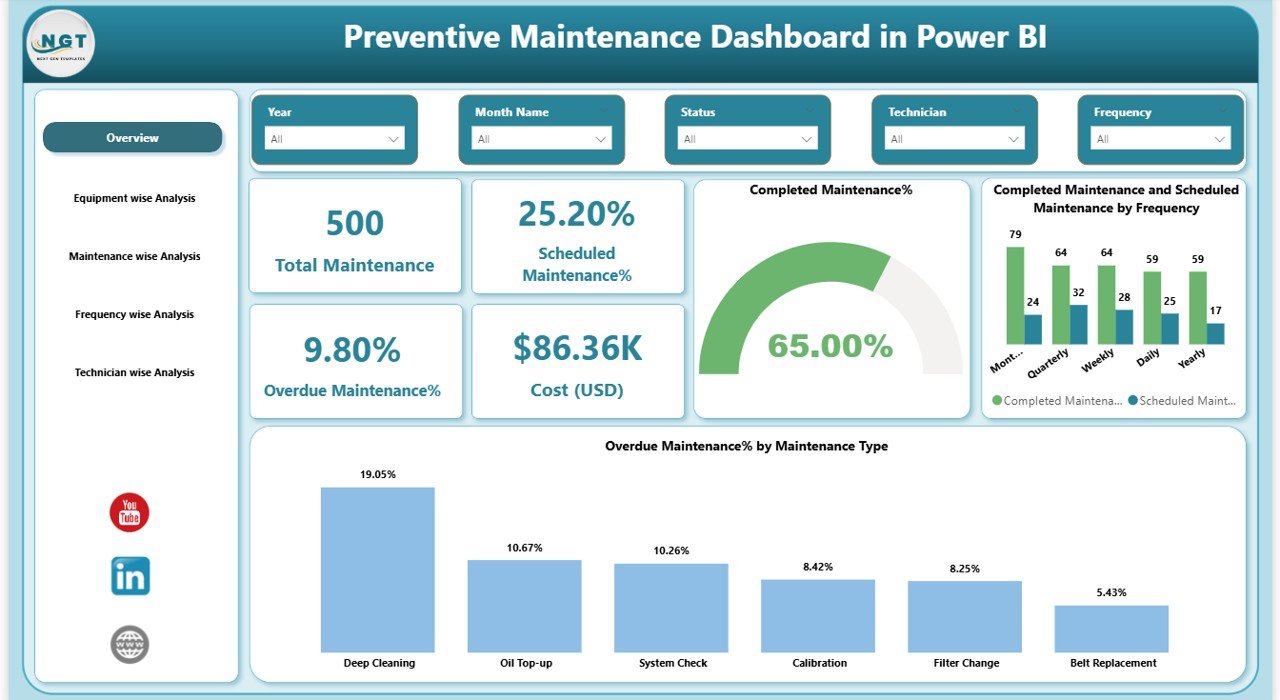
Overview Page – The Central Control Panel
The Overview Page acts as the command center. It provides a high-level summary of maintenance performance.
KPI Cards on Overview Page:
- Total Maintenance
- Scheduled Maintenance %
- Overdue Maintenance %
- Cost (USD)
- Completed Maintenance %
These cards instantly show maintenance health.
Charts on Overview Page:
- Completed Maintenance and Scheduled Maintenance by Frequency
- Overdue Maintenance % by Maintenance Type
- Completed maintenance %,
Moreover, slicers allow filtering by:
- Date
- Maintenance Type
- Equipment
- Technician
Therefore, managers can quickly evaluate overall performance.
Click to buy Preventive Maintenance Dashboard in Power BI
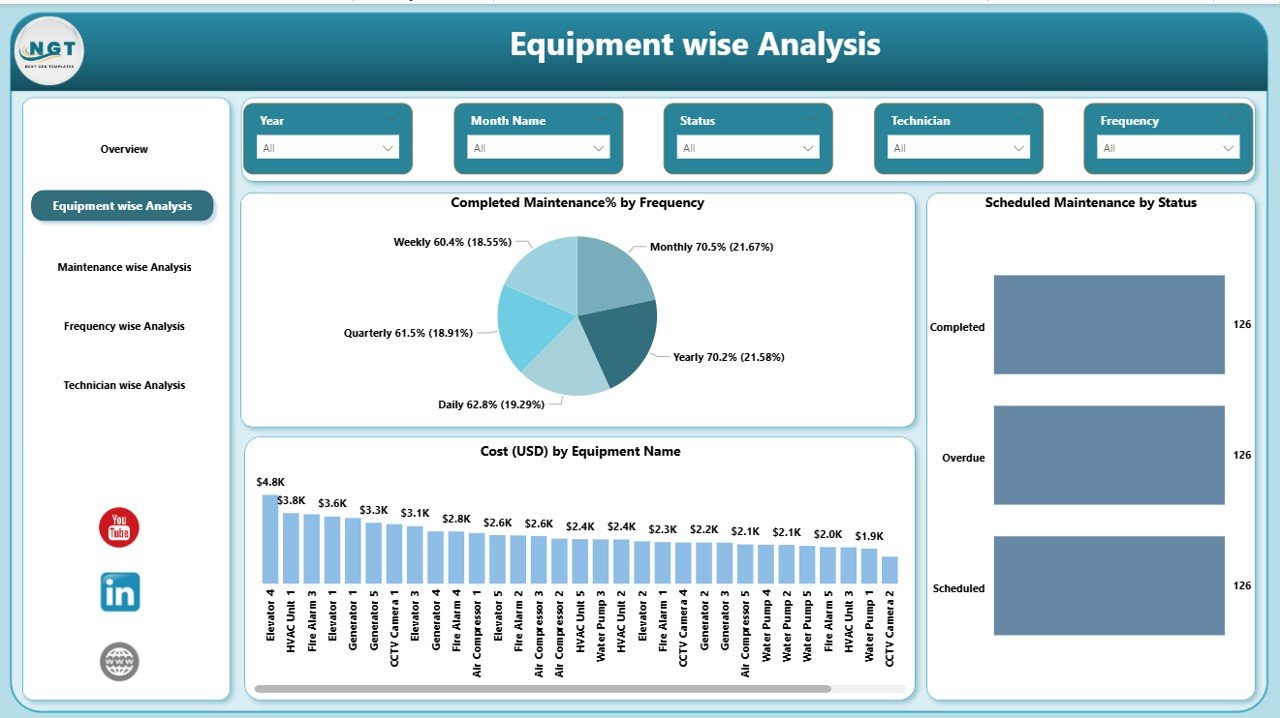
Equipment Wise Analysis – How Is Each Equipment Performing?
Equipment performance directly impacts operational efficiency. Therefore, this page focuses on equipment-level insights.
Charts Available:
- Completed Maintenance % by Frequency
- Scheduled Maintenance by Status
- Cost (USD) by Equipment Name
With this analysis, you can:
- Identify equipment with high maintenance cost
- Monitor completion rate per equipment
- Detect equipment with frequent overdue tasks
As a result, you prioritize critical assets.
Click to buy Preventive Maintenance Dashboard in Power BI
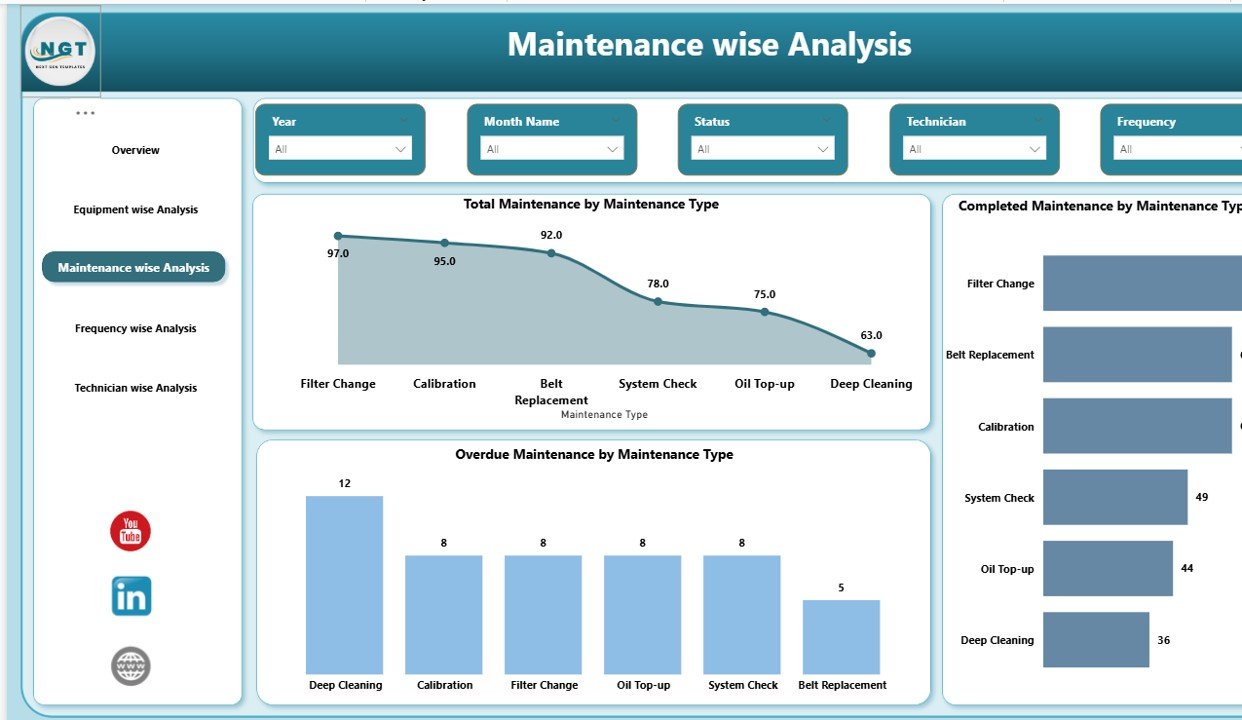
Maintenance Wise Analysis – Which Maintenance Types Need Attention?
Different maintenance types require different strategies. Therefore, this page analyzes performance by maintenance type.
Charts Included:
- Total Maintenance by Maintenance Type
- Completed Maintenance by Maintenance Type
- Overdue Maintenance by Maintenance Type
For example, you may have:
- Electrical Maintenance
- Mechanical Maintenance
- Inspection Maintenance
- Calibration Maintenance
With this analysis, you can:
- Identify maintenance types with high overdue rate
- Allocate resources accordingly
- Improve preventive strategies
Consequently, maintenance planning becomes more effective.
Click to buy Preventive Maintenance Dashboard in Power BI
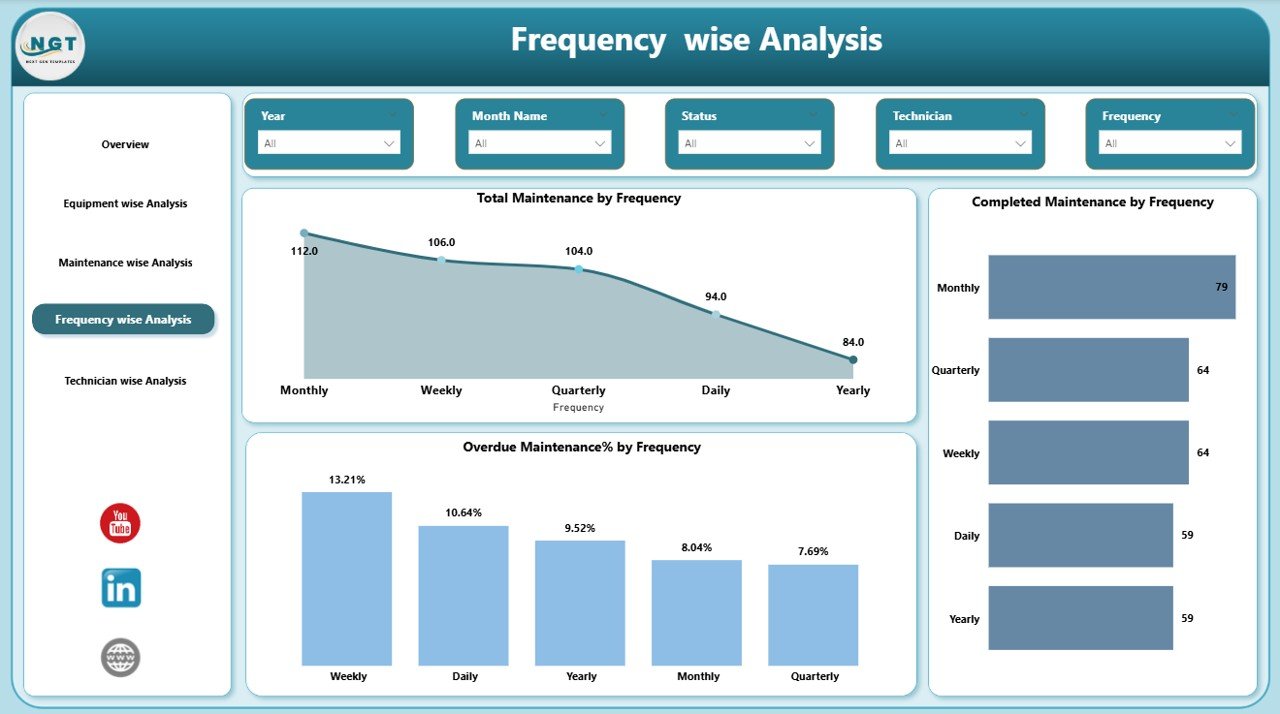
Frequency Wise Analysis – Are Maintenance Intervals Effective?
Maintenance frequency impacts both cost and efficiency. Therefore, this page analyzes data by frequency.
Charts Included:
- Total Maintenance by Frequency
- Completed Maintenance by Frequency
- Overdue Maintenance % by Frequency
Frequencies may include:
- Daily
- Weekly
- Monthly
- Quarterly
- Yearly
If monthly tasks show high overdue percentage, you can adjust scheduling. As a result, you optimize maintenance intervals.
Click to buy Preventive Maintenance Dashboard in Power BI
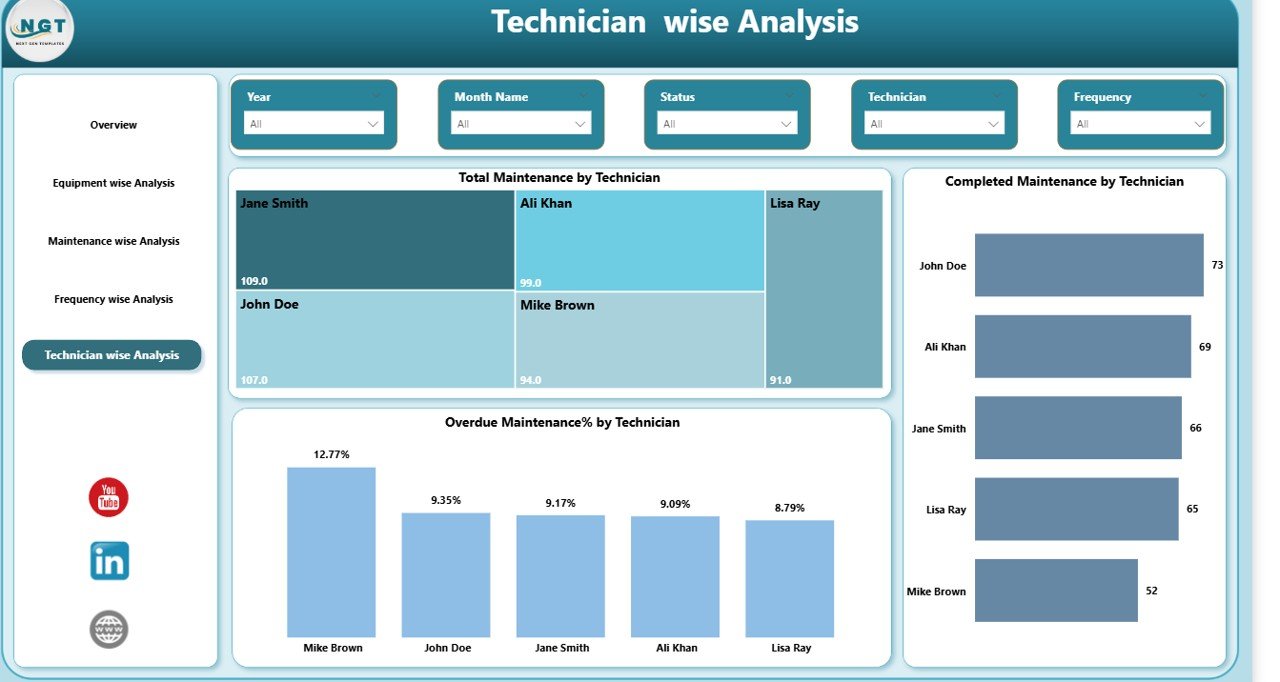
Technician Wise Analysis – How Productive Is Each Technician?
Technician performance directly affects completion rates. Therefore, this page focuses on technician analysis.
Charts Included:
- Total Maintenance by Technician
- Completed Maintenance by Technician
- Overdue Maintenance % by Technician
This analysis helps you:
- Measure technician productivity
- Identify workload imbalance
- Detect training needs
- Improve accountability
Consequently, team performance improves.
Click to buy Preventive Maintenance Dashboard in Power BI
Key KPIs Tracked in Preventive Maintenance Dashboard in Power BI
Here are essential KPIs included in the dashboard:
- Total Maintenance Tasks
- Scheduled Maintenance %
- Completed Maintenance %
- Overdue Maintenance %
- Maintenance Cost (USD)
- Maintenance by Frequency
- Maintenance by Equipment
- Maintenance by Technician
These KPIs provide complete visibility.
Advantages of Preventive Maintenance Dashboard in Power BI
Now let’s explore the major advantages.
Real-Time Monitoring
You track maintenance activities instantly. Therefore, you react quickly to issues.
Improved Equipment Reliability
Since you monitor schedules properly, equipment failures decrease.
Cost Control
You track cost in USD clearly. As a result, you control maintenance budget effectively.
Better Planning
You analyze trends by frequency and type. Consequently, you plan maintenance efficiently.
Increased Productivity
Technician-wise tracking improves accountability. Therefore, overall productivity increases.
Reduced Operational Risk
Overdue monitoring reduces compliance and safety risks.
Data-Driven Decisions
You rely on visual insights instead of assumptions.
How Does Power BI Improve Maintenance Reporting?
Power BI adds powerful features:
- Interactive slicers
- Drill-down capability
- Dynamic visuals
- Real-time data refresh
- User-friendly interface
Moreover, Power BI allows integration with Excel and ERP systems. Therefore, data updates remain accurate.
Best Practices for the Preventive Maintenance Dashboard
To maximize the value of this dashboard, follow these best practices.
Keep Data Updated Regularly
Update maintenance records daily or weekly. Therefore, insights remain accurate.
Define Clear Maintenance Types
Use consistent categories like Electrical, Mechanical, or Inspection. Consequently, reporting stays clean.
Monitor Overdue Tasks Weekly
Do not wait for monthly review. Instead, check overdue tasks weekly.
Review Technician Performance Monthly
Track productivity trends regularly. As a result, you maintain accountability.
Analyze Cost Trends Quarterly
Review cost trends by equipment and frequency. Therefore, you optimize budget allocation.
Use Slicers Smartly
Filter data by date, equipment, or technician for deeper analysis.
Focus on Preventive Instead of Reactive Maintenance
Encourage preventive culture. Consequently, emergency repairs decrease.
How to Implement Preventive Maintenance Dashboard in Power BI?
Implementation remains simple if you follow these steps:
- Collect maintenance data in Excel or ERP
- Structure columns properly (Equipment, Type, Frequency, Status, Cost, Technician, Date)
- Import data into Power BI
- Create relationships
- Build KPI measures
- Design visuals
- Add slicers
- Test dashboard
- Publish and share
Therefore, you can deploy this dashboard quickly.
Who Can Use This Dashboard?
This dashboard suits:
- Manufacturing companies
- Facility management teams
- Hospitals
- Hotels
- Construction companies
- Logistics companies
- Oil and gas companies
Basically, any organization that manages equipment can use it.
How Does This Dashboard Improve Business Performance?
When you track preventive maintenance effectively:
- Downtime reduces
- Equipment lifespan increases
- Maintenance cost decreases
- Productivity improves
- Safety improves
- Compliance improves
As a result, overall profitability increases.
Conclusion
Preventive maintenance plays a critical role in operational success. However, manual tracking leads to missed schedules and rising costs.
A Preventive Maintenance Dashboard in Power BI solves these challenges effectively. It centralizes maintenance data, provides real-time visibility, tracks technician performance, monitors overdue tasks, and controls maintenance cost in USD.
Moreover, with 5 powerful analytical pages—Overview, Equipment Wise Analysis, Maintenance Wise Analysis, Frequency Wise Analysis, and Technician Wise Analysis—you gain complete control over maintenance operations.
Therefore, if you want better efficiency, lower downtime, and smarter decision-making, you should implement this dashboard today.
Frequently Asked Questions with Answers
What is preventive maintenance?
Preventive maintenance refers to scheduled maintenance activities performed regularly to reduce equipment failure and extend asset life.
Why should I use Power BI for maintenance tracking?
Power BI provides interactive visuals, real-time insights, and powerful filtering options. Therefore, you can monitor maintenance performance effectively.
How often should I update the dashboard?
You should update data daily or weekly. However, high-volume industries may require daily updates.
Can small businesses use this dashboard?
Yes. Small businesses benefit greatly because they can track maintenance cost and reduce unexpected breakdowns.
Does this dashboard reduce maintenance cost?
Yes. Since it highlights overdue tasks and cost trends, you can optimize budget and reduce emergency repairs.
What data do I need to build this dashboard?
You need:
- Equipment Name
- Maintenance Type
- Frequency
- Scheduled Date
- Completion Date
- Status
- Technician Name
- Cost (USD)
How does technician analysis help?
Technician-wise tracking improves accountability and helps identify productivity gaps.
Can I customize the dashboard?
Yes. You can add more KPIs, filters, and visuals according to business needs.
Visit our YouTube channel to learn step-by-step video tutorials
Watch the step-by-step video tutorial:
Click to buy Preventive Maintenance Dashboard in Power BI