Online education has transformed the way people learn. EdTech platforms, virtual schools, online universities, and training providers deliver courses to learners across the globe. However, with growth comes complexity. Without proper performance tracking, education leaders struggle to measure learning outcomes, engagement, and operational efficiency.
Many online education providers still rely on scattered reports and manual spreadsheets. As a result, they face limited visibility, delayed insights, and difficulty aligning performance with strategic goals.
So, how can online education organizations track performance clearly and consistently?
The answer is simple.
Click to Purchases Online Education KPI Scorecard in Excel
You need an Online Education KPI Scorecard in Excel.
This ready-to-use KPI scorecard helps education teams monitor actual vs target performance, track MTD and YTD results, analyze trends, and document KPI definitions — all within one structured Excel template.
In this detailed guide, you will learn:
-
What an Online Education KPI Scorecard in Excel is
-
Why online education platforms need KPI scorecards
-
A complete explanation of all 4 worksheets
-
Advantages of Online Education KPI Scorecard in Excel
-
Best Practices for the Online Education KPI Scorecard in Excel
-
Frequently Asked Questions
Let us explore everything step by step.
Click to Purchases Online Education KPI Scorecard in Excel
What Is an Online Education KPI Scorecard in Excel?
An Online Education KPI Scorecard in Excel is a structured performance monitoring tool designed to evaluate key performance indicators for online learning platforms.
Instead of using multiple disconnected reports, this scorecard allows you to:
-
Select a specific month for analysis
-
Compare MTD and YTD performance
-
Track actual vs target values
-
Visualize KPI performance using color-coded indicators
-
Analyze performance trends over time
-
Maintain clear KPI documentation
Moreover, Excel updates calculations automatically when you enter new data. Therefore, leaders can make faster, data-driven decisions.
Why Do Online Education Platforms Need a KPI Scorecard?
Online education involves learners, instructors, technology, content, and operations. Without structured KPI tracking, organizations may:
-
Miss learner engagement issues
-
Fail to track course completion effectively
-
Struggle to measure instructor performance
-
Lose visibility on platform growth
-
Provide weak performance reporting to stakeholders
Therefore, a KPI scorecard becomes essential.
When online education providers track KPIs properly, they:
-
Improve learner outcomes
-
Enhance course quality
-
Increase retention rates
-
Optimize operational efficiency
-
Support strategic planning
Key Features of Online Education KPI Scorecard in Excel
This ready-to-use template includes 4 well-structured worksheets designed for complete KPI monitoring.
Click to Purchases Online Education KPI Scorecard in Excel
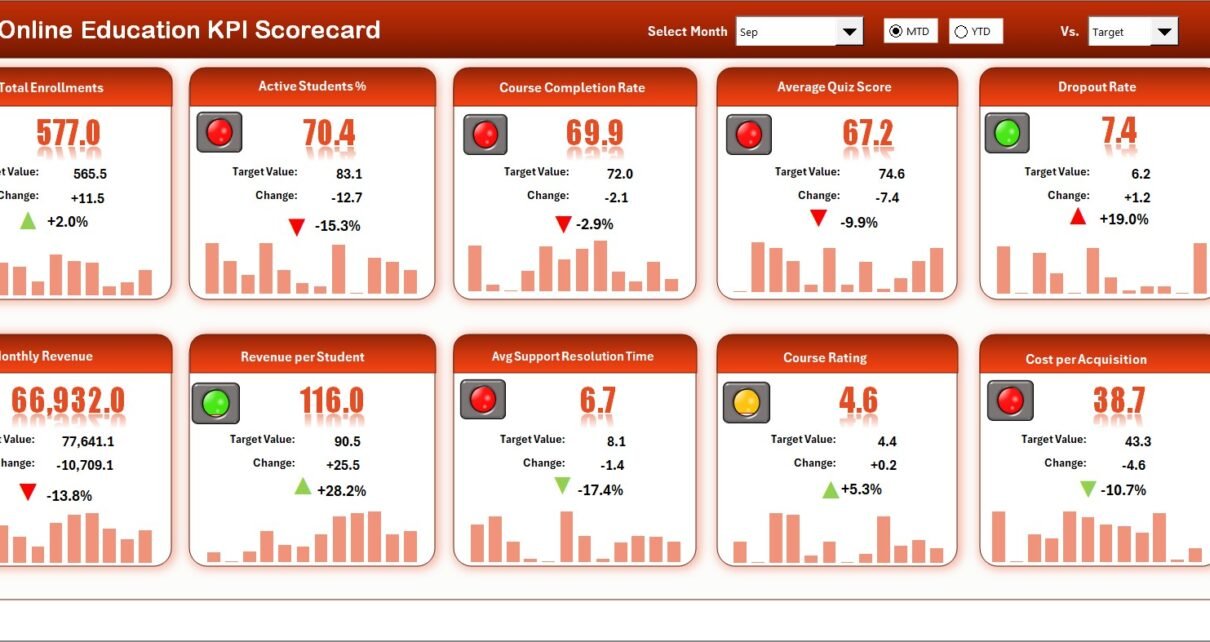
1️⃣ Scorecard Sheet – Main Performance Dashboard
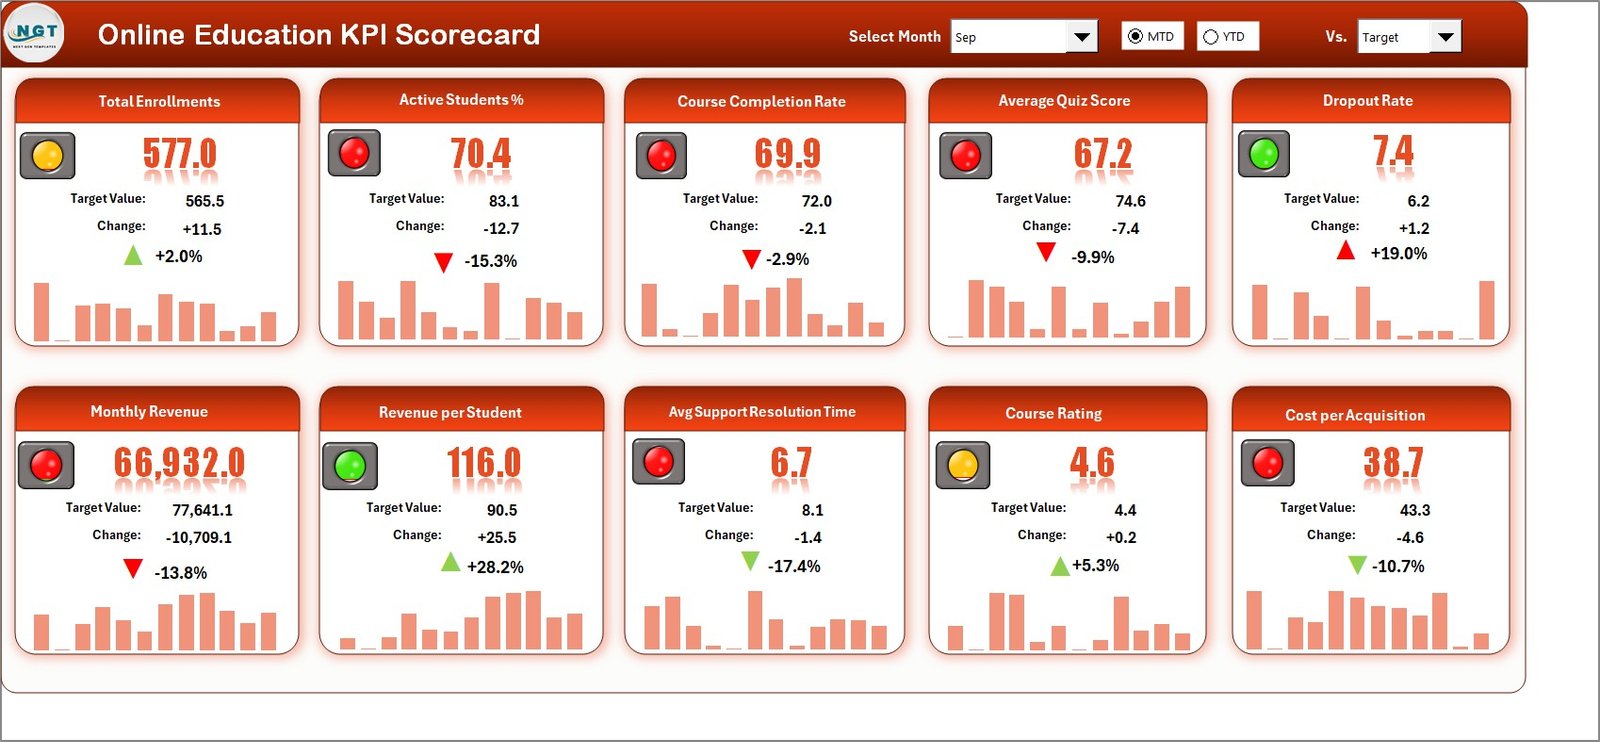
The Scorecard sheet acts as the primary interface where stakeholders view overall performance.
Key Capabilities of the Scorecard Sheet
✔ Dropdown Menus for Flexible Analysis
You can select:
-
Month
-
MTD (Month-to-Date)
-
YTD (Year-to-Date)
When you change the selection, the scorecard updates automatically.
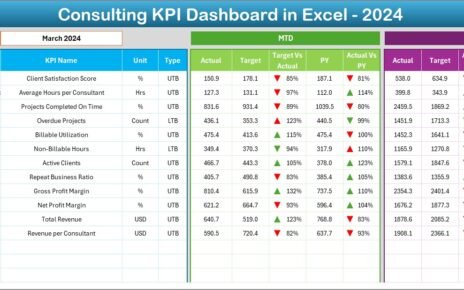
✔ Actual vs Target Comparison
The scorecard displays:
-
Actual MTD values
-
Target MTD values
-
Actual YTD values
-
Target YTD values
This comparison helps identify performance gaps instantly.
✔ Visual Performance Indicators
The scorecard uses:
-
Conditional formatting
-
Color-coded indicators
For example:
-
Green highlights KPIs meeting or exceeding targets
-
Red highlights KPIs below expectations
As a result, users can evaluate performance at a glance.
✔ Comprehensive KPI Overview
The Scorecard sheet shows:
-
KPI Name
-
KPI Group
-
Unit of Measurement
-
Actual vs Target comparisons
-
MTD and YTD performance
Thus, leadership gets complete visibility in one place.
Click to Purchases Online Education KPI Scorecard in Excel
2️⃣ KPI Trend Sheet – Performance Over Time
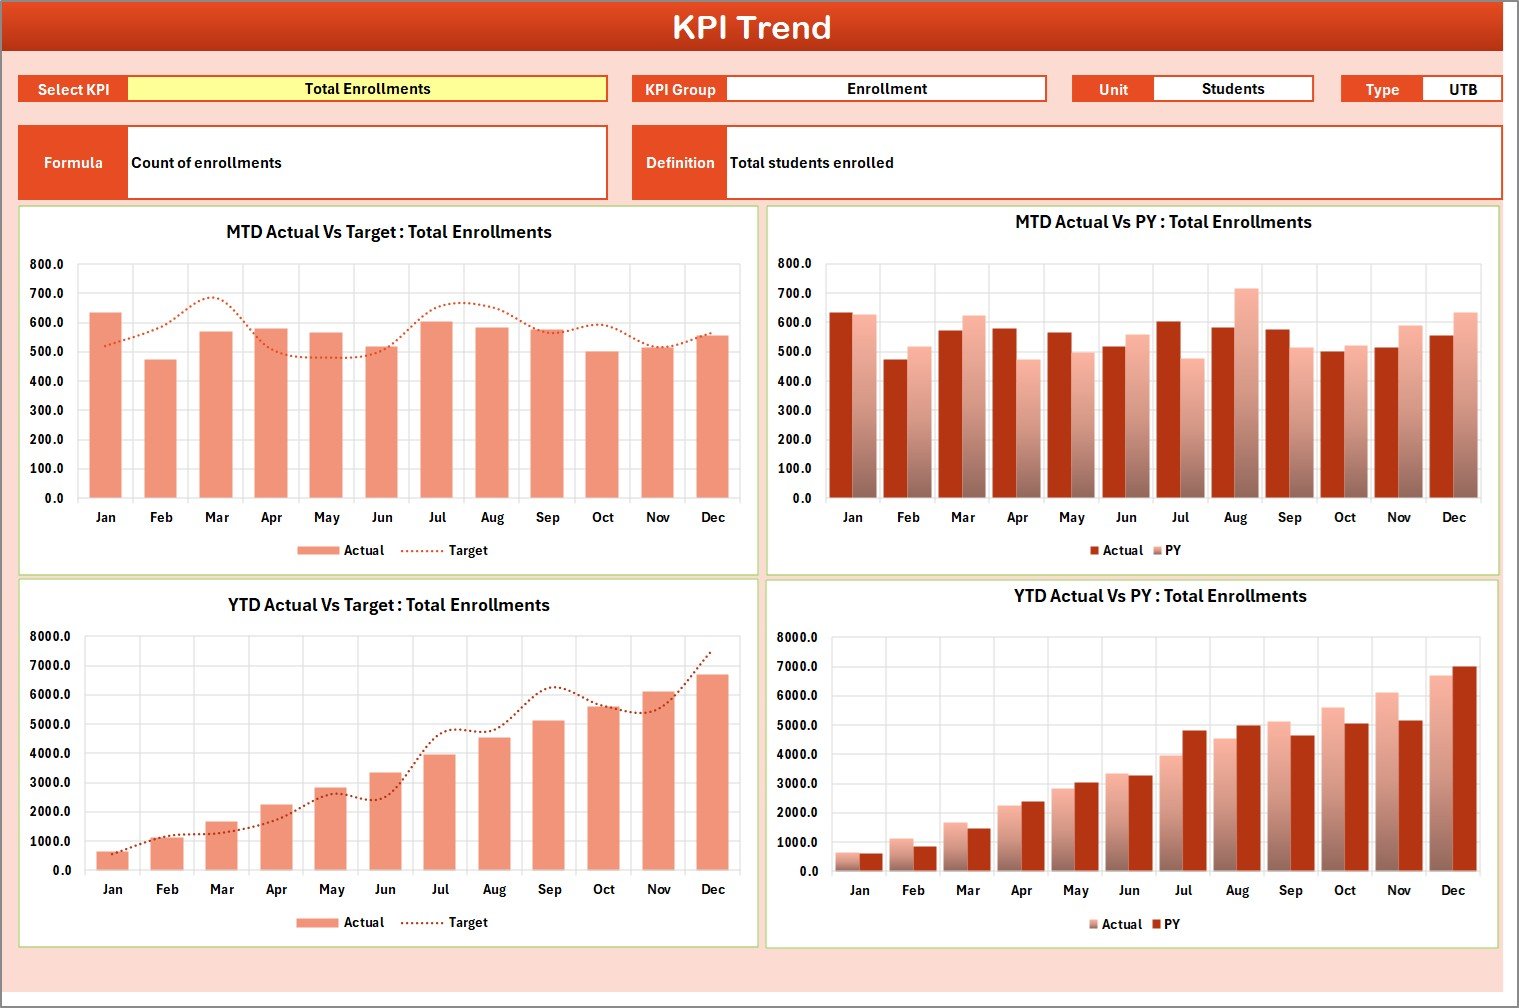
The KPI Trend sheet focuses on detailed analysis of individual KPIs.
On cell C3, you can select a KPI name from the dropdown.
Once selected, the sheet displays:
-
KPI Group
-
Unit of KPI
-
KPI Type (Lower the Better or Upper the Better)
-
KPI Formula
-
KPI Definition
Trend Charts Included
The sheet displays:
-
MTD Trend Chart (Actual vs Target vs Previous Year)
-
YTD Trend Chart (Actual vs Target vs Previous Year)
These charts help you:
-
Identify learner growth trends
-
Monitor engagement changes
-
Compare performance against previous year
-
Detect seasonal patterns
For example:
-
If course completion rate increases steadily, the trend line rises
-
If dropout rate increases and KPI type is Lower the Better, performance declines
Therefore, trend analysis supports proactive improvement.
3️⃣ Input Data Sheet – Central Data Entry Area
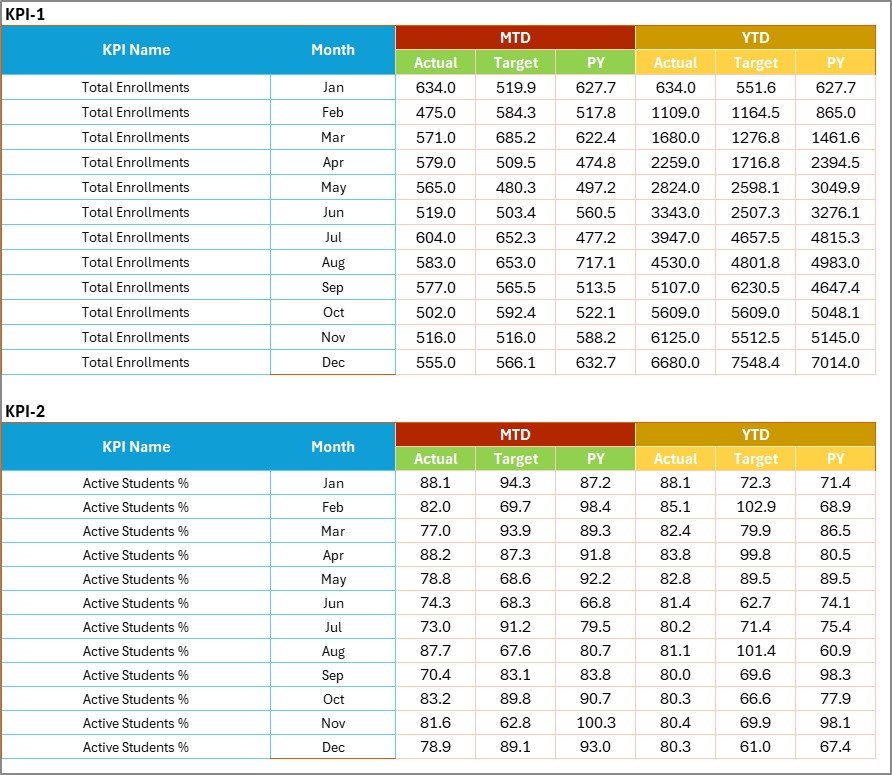
The Input Data sheet stores all KPI data.
Here, you record:
-
Actual KPI values
-
Target KPI values
-
Monthly performance data
Because this sheet drives the entire scorecard, accurate data entry is critical.
Moreover, you can easily update values as new results become available. This ensures the scorecard remains current and reliable.
Click to Purchases Online Education KPI Scorecard in Excel
4️⃣ KPI Definition Sheet – KPI Documentation and Governance
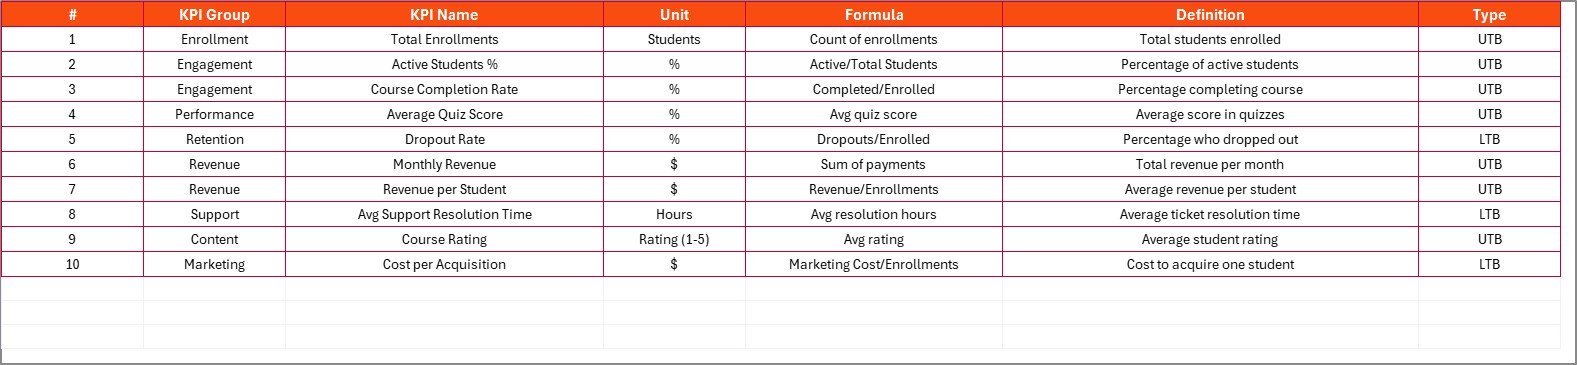
The KPI Definition sheet contains:
-
KPI Name
-
KPI Group
-
Unit
-
Formula
-
KPI Definition
This sheet ensures:
-
Clear understanding of each KPI
-
Consistent measurement logic
-
Better governance and transparency
As a result, all stakeholders interpret KPIs correctly.
What KPIs Can You Track in Online Education?
You can track a wide range of online education KPIs, such as:
-
Student Enrollment Count
-
Course Completion Rate
-
Student Engagement Rate
-
Active Learners
-
Dropout Rate
-
Average Course Rating
-
Instructor Performance Score
-
Platform Uptime Percentage
-
Revenue per Learner
Additionally, you can customize KPIs based on your platform’s objectives.
Click to Purchases Online Education KPI Scorecard in Excel
Advantages of Online Education KPI Scorecard in Excel
Let us explore why this scorecard adds real value.
1️⃣ Easy to Use
Excel provides a familiar interface for education teams.
2️⃣ Cost-Effective
You avoid investing in expensive analytics software.
3️⃣ Highly Customizable
You can easily add, edit, or remove KPIs.
4️⃣ Clear Performance Visibility
Color-coded visuals simplify decision-making.
5️⃣ MTD and YTD Tracking
You can analyze short-term and long-term performance.
6️⃣ Trend Analysis
Charts reveal patterns and performance changes over time.
7️⃣ Improved Stakeholder Reporting
Structured KPI reporting builds credibility with management and investors.
Best Practices for the Online Education KPI Scorecard in Excel
To get maximum value, follow these best practices:
✔ Define Clear and Relevant KPIs
Align KPIs with learning outcomes and business goals.
✔ Update Data Regularly
Monthly updates ensure accurate insights.
✔ Validate Data Before Review
Double-check actual and target values.
✔ Review Trends Quarterly
Trend analysis helps identify long-term opportunities and risks.
✔ Use KPI Types Correctly
Define whether a KPI is Lower the Better or Upper the Better.
✔ Share the Scorecard with Leadership
Regular reviews improve accountability and strategy alignment.
Common Mistakes to Avoid
Avoid these common errors:
-
Tracking too many KPIs
-
Setting unrealistic targets
-
Ignoring previous year trends
-
Skipping data validation
-
Failing to update data regularly
When you avoid these mistakes, your scorecard becomes far more effective.
How Does This KPI Scorecard Improve Online Education Outcomes?
This scorecard helps organizations:
-
Measure learning effectiveness
-
Identify underperforming courses
-
Improve learner engagement
-
Optimize instructor performance
-
Support data-driven decisions
Therefore, education leaders can focus on continuous improvement.
Click to Purchases Online Education KPI Scorecard in Excel
Conclusion: Why Should You Use Online Education KPI Scorecard in Excel?
Online education requires both innovation and accountability. Therefore, structured KPI tracking is essential.
The Online Education KPI Scorecard in Excel provides:
-
Actual vs Target comparison
-
MTD and YTD tracking
-
Visual performance indicators
-
Trend analysis
-
Clear KPI documentation
-
Easy data updates
Moreover, because it remains simple and flexible, teams can implement it quickly.
If you want measurable learning outcomes, improved performance visibility, and data-driven growth, this Excel KPI scorecard offers a practical and powerful solution.
Frequently Asked Questions with Answers
1️⃣ Can I customize KPIs in this scorecard?
Yes. You can modify KPIs in the KPI Definition sheet.
2️⃣ How does MTD and YTD selection work?
Use the dropdown menu on the Scorecard sheet to switch between MTD and YTD views.
3️⃣ What does Lower the Better mean?
Lower the Better means lower values indicate better performance, such as dropout rate.
4️⃣ Can I track previous year performance?
Yes. The KPI Trend sheet supports previous year comparisons.
5️⃣ Is this suitable for small online academies?
Yes. Small and large online education platforms can use it effectively.
6️⃣ Do I need advanced Excel skills?
No. Basic Excel knowledge is sufficient.
7️⃣ Can I use this scorecard for management reporting?
Yes. The structured layout supports professional reporting.
Click to Purchases Online Education KPI Scorecard in Excel
Visit our YouTube channel to learn step-by-step video tutorials