Waste management never slows down. Cities grow. Waste volume increases. Fuel costs rise. Labor expenses fluctuate. Meanwhile, municipalities and private contractors must maintain service quality every single day.
So, how do you track vehicles, collection teams, operating costs, maintenance expenses, and service ratings in one structured system?
The answer is simple.
You need a Waste Management Dashboard in Excel.
Click to Purchases Waste Management Dashboard in Excel
This ready-to-use Excel dashboard helps you monitor waste operations in real time. Instead of juggling multiple spreadsheets, you get a centralized performance tracking system. Moreover, you gain clarity, speed, and control over your waste management operations.
In this detailed guide, you will learn:
-
What a Waste Management Dashboard in Excel is
-
Why waste operations need structured tracking
-
Detailed explanation of all 5 dashboard pages
-
Advantages of Waste Management Dashboard in Excel
-
Best Practices for the Waste Management Dashboard in Excel
-
Frequently Asked Questions with Answers
Let’s explore everything step by step.
What Is a Waste Management Dashboard in Excel?
A Waste Management Dashboard in Excel is a structured and interactive reporting tool designed to track waste collection operations, vehicles, labor costs, service ratings, and maintenance expenses.
It transforms raw operational data into meaningful visual insights. Instead of reviewing hundreds of rows of data manually, you can instantly:
-
Monitor total vehicles in operation
-
Track operating and maintenance costs
-
Evaluate service ratings
-
Compare performance across zones, cities, and teams
-
Analyze monthly trends
Because Excel offers powerful Pivot Tables, Pivot Charts, slicers, and KPI cards, this dashboard delivers advanced analytics without complex software.
Why Do Waste Management Companies Need a Dashboard?
Waste management involves logistics, manpower, vehicles, fuel, and maintenance. Therefore, you must track many moving parts.
Without structured reporting:
-
Managers lose visibility into cost spikes
-
Vehicles operate inefficiently
-
Teams underperform without detection
-
Maintenance delays increase downtime
-
Service ratings drop
However, when you implement a Waste Management Dashboard in Excel:
-
You gain real-time visibility
-
You compare performance across regions
-
You detect inefficiencies early
-
You improve cost control
-
You enhance service quality
As a result, decision-making becomes faster and more accurate.
Complete Explanation of All 5 Pages
This Waste Management Dashboard in Excel contains 5 fully interactive analytical pages. Each page focuses on a specific dimension of operations.
Additionally, the Page Navigator on the left side allows smooth movement between pages. Meanwhile, slicers on the right side help filter data instantly.
Let us break down each page in detail.
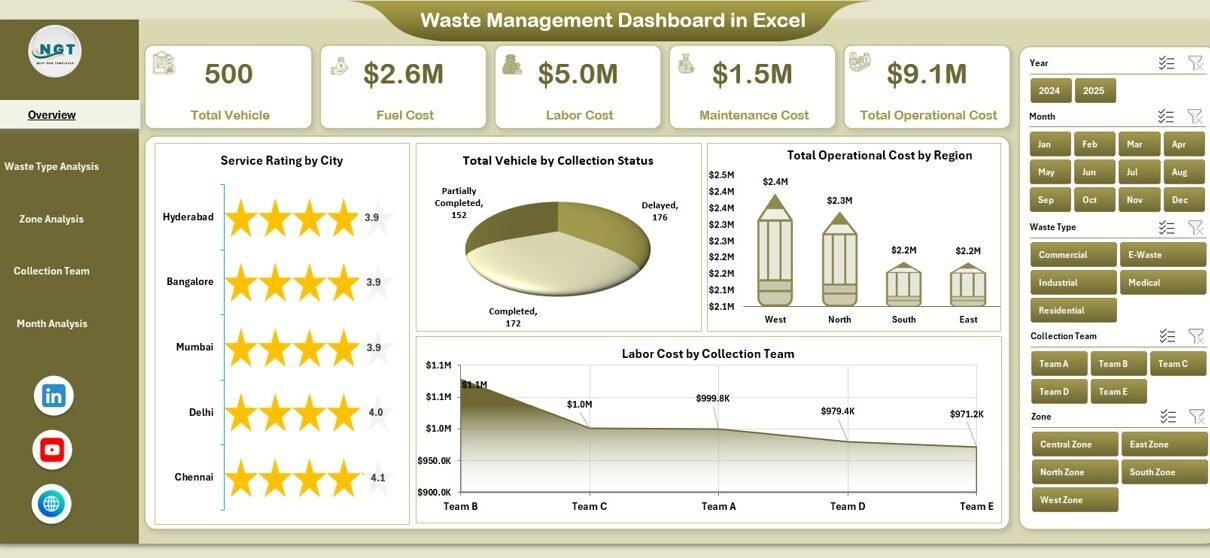
1️⃣ Overview Page – What Is Happening Across the Entire Operation?
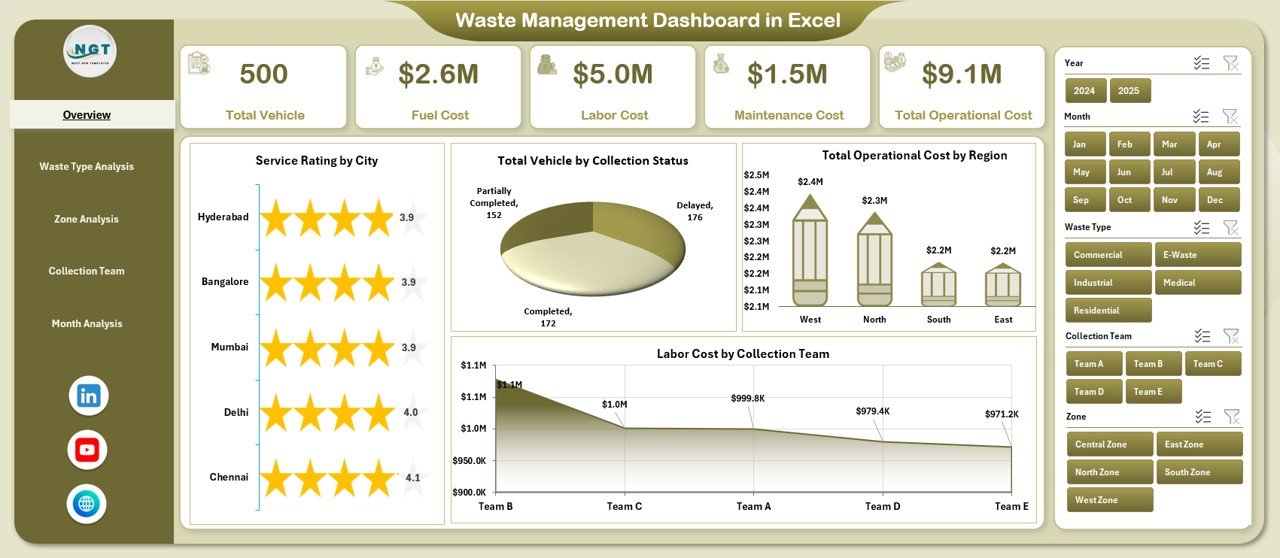
The Overview Page acts as the central control panel. It gives you a high-level summary of your waste management operations.
Key Components of the Overview Page
✔ 4 KPI Cards
-
Total Vehicles
-
Total Operating Cost
-
Total Maintenance Cost
-
Average Service Rating
These cards show instant performance metrics. Therefore, managers can assess overall health within seconds.
✔ 4 Interactive Charts
-
Service Rating by City
-
Total Vehicle by Collection Status
-
Total Operating Cost by Region
-
Labor Cost by Collection Team
What Can You Analyze Here?
-
Which city maintains the highest service rating?
-
Which region incurs the highest operating cost?
-
How many vehicles remain active vs under maintenance?
-
Which collection team consumes the highest labor cost?
Because this page provides a complete snapshot, executives can quickly identify problem areas.
Click to Purchases Waste Management Dashboard in Excel
2️⃣ Waste Type Analysis – Which Waste Category Drives Cost and Performance?
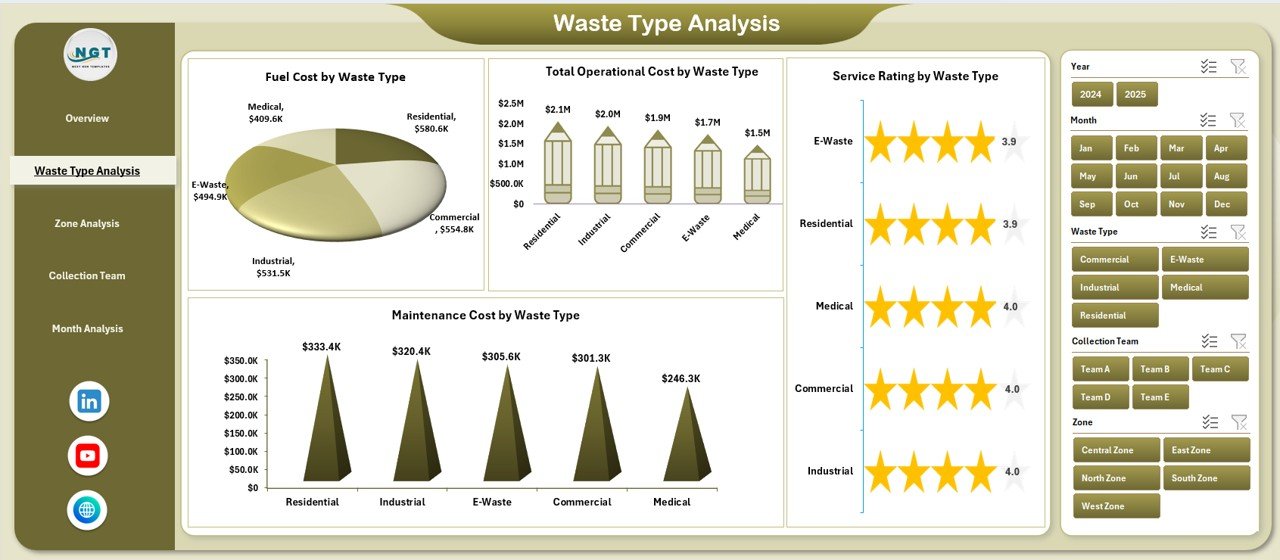
Waste differs in type. Municipal waste, industrial waste, recyclable materials, and hazardous waste require different handling procedures.
Therefore, this page focuses on performance by waste type.
Charts Available on Waste Type Analysis Page
-
Service Rating by Waste Type
-
Total Vehicle by Waste Type
-
Total Operating Cost by Waste Type
-
Maintenance Cost by Waste Type
Why Is This Important?
Different waste categories create different operational challenges. For example:
-
Hazardous waste may require special vehicles
-
Recyclable waste may generate additional revenue
-
Industrial waste may demand higher fuel consumption
By analyzing waste types separately, you can:
-
Allocate vehicles more efficiently
-
Control maintenance expenses
-
Improve service quality
-
Optimize operational budgets
3️⃣ Zone Analysis – Which Geographic Area Performs Better?
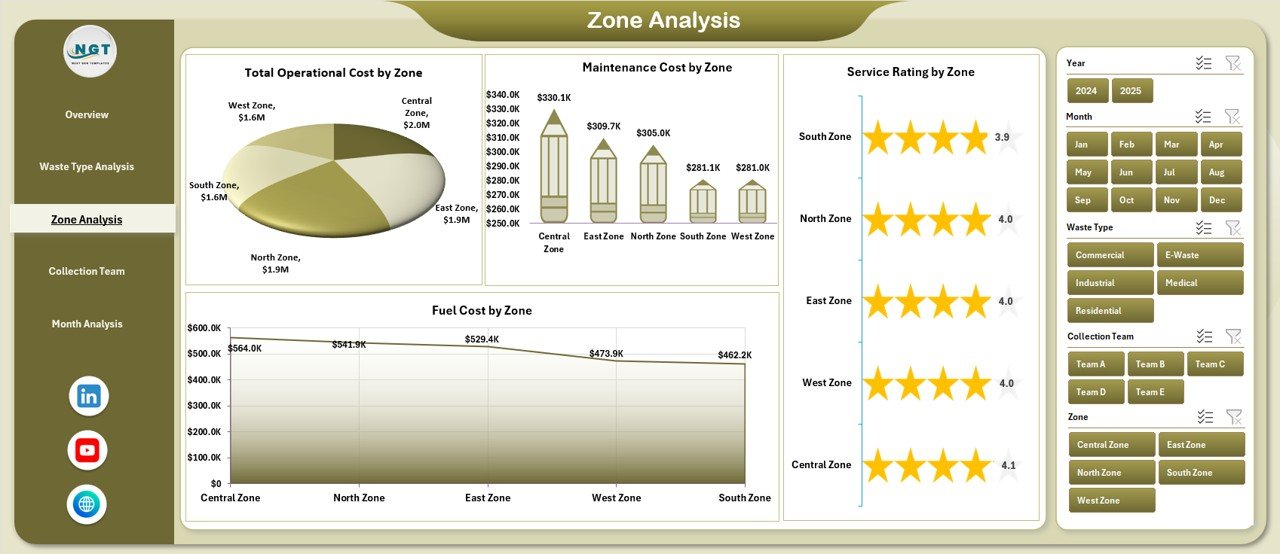
Large waste management operations divide service areas into zones. Each zone has its own operational cost, service quality, and vehicle allocation.
Charts Available on Zone Analysis Page
-
Service Rating by Zone
-
Total Vehicle by Zone
-
Total Operating Cost by Zone
-
Maintenance Cost by Zone
What Insights Can You Generate?
-
Which zone operates most efficiently?
-
Which zone consumes excessive maintenance cost?
-
Where does service quality require improvement?
-
How does vehicle distribution vary across zones?
Because geography influences fuel cost and workload, zone analysis becomes critical.
4️⃣ Collection Team Analysis – Which Team Delivers the Best Performance?
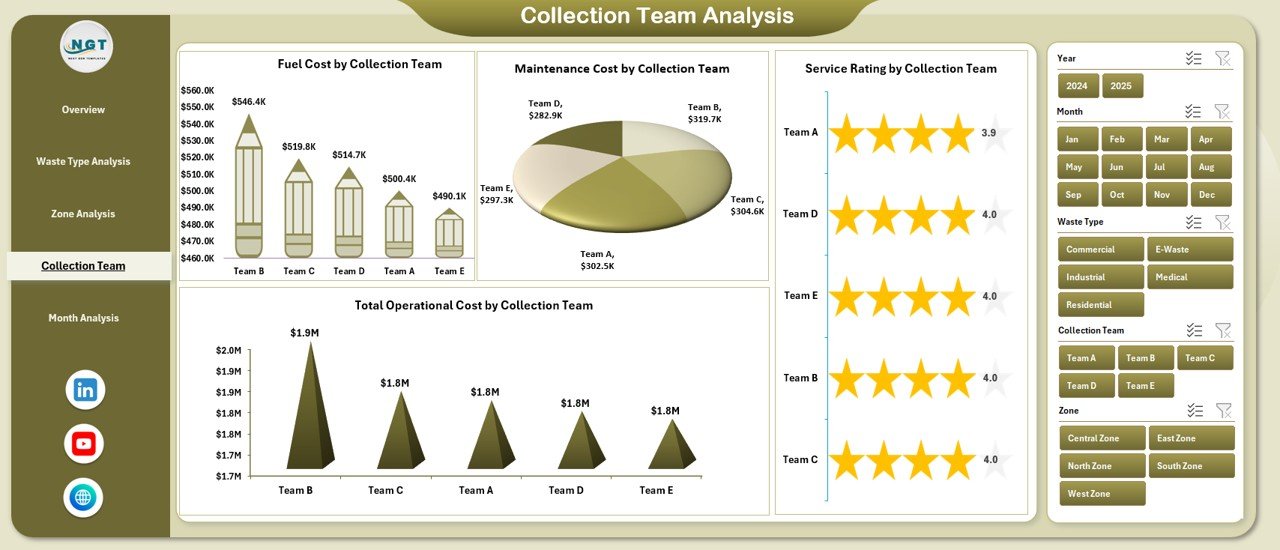
Every collection team plays a crucial role in daily operations. However, not all teams perform equally.
Therefore, this page evaluates team-level efficiency.
Charts on Collection Team Analysis Page
-
Service Rating by Collection Team
-
Total Vehicle by Collection Team
-
Total Operating Cost by Collection Team
-
Maintenance Cost by Collection Team
What Questions Does This Page Answer?
-
Which team achieves the highest service rating?
-
Which team operates with the lowest cost?
-
Do certain teams experience frequent vehicle breakdowns?
-
How does vehicle allocation differ between teams?
Because accountability improves performance, team analysis encourages better results.
5️⃣ Month Analysis – How Does Performance Change Over Time?
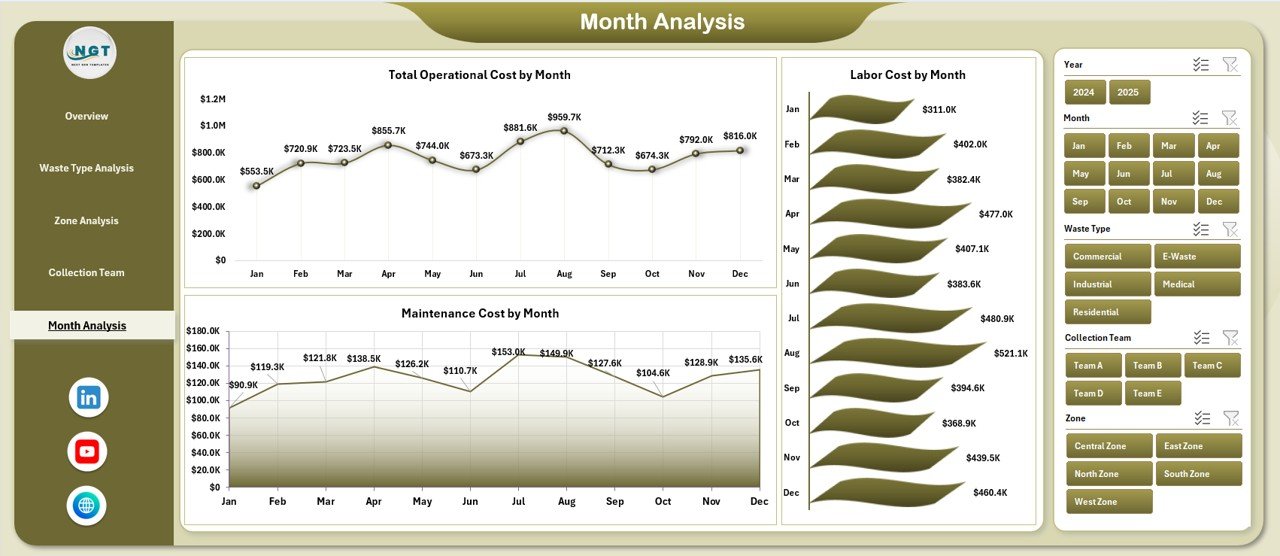
Waste management performance fluctuates monthly. Weather conditions, fuel price changes, and seasonal demand affect operations.
Therefore, this page tracks monthly trends.
Charts on Month Analysis Page
-
Total Vehicle by Month
-
Total Operating Cost by Month
-
Maintenance Cost by Month
What Can You Discover?
-
Does operating cost increase during certain months?
-
Does maintenance cost spike during rainy seasons?
-
Does vehicle deployment change during festive periods?
Because trends reveal patterns, managers can plan proactively.
What Is Included in the Data Sheet?
Click to Purchases Waste Management Dashboard in Excel
The Data Sheet captures structured operational data such as:
-
Date
-
City
-
Region
-
Zone
-
Waste Type
-
Collection Team
-
Vehicle ID
-
Collection Status
-
Operating Cost
-
Maintenance Cost
-
Labor Cost
-
Service Rating
You update this sheet regularly. Then, Pivot Tables automatically refresh the dashboard visuals.
What Is the Support Sheet Used For?
The Support Sheet stores:
-
Helper columns
-
Lookup values
-
Drop-down list sources
-
Calculations
Because structured backend logic ensures smooth performance, the Support Sheet maintains dashboard efficiency.
Advantages of Waste Management Dashboard in Excel
Now let us explore the major advantages of using this dashboard.
✔ Centralized Monitoring
You track vehicles, costs, and service ratings in one system. Therefore, you eliminate scattered spreadsheets.
✔ Improved Cost Control
You monitor operating and maintenance costs closely. As a result, you reduce unnecessary expenses.
✔ Better Resource Allocation
You distribute vehicles based on waste type and zone analysis. Consequently, you improve operational efficiency.
✔ Increased Accountability
Team-level analysis encourages better performance. Therefore, teams focus on maintaining high service ratings.
✔ Faster Decision Making
You access insights instantly through slicers and pivot charts. Thus, you make faster operational decisions.
✔ User-Friendly Interface
Excel provides an intuitive environment. Hence, managers without technical background can operate it easily.
Best Practices for the Waste Management Dashboard in Excel
If you want maximum value, follow these best practices.
1️⃣ Maintain Clean Data Entry
Always ensure:
-
No blank cells in critical columns
-
Proper date formats
-
Consistent waste type names
-
Correct cost entries
Clean data guarantees accurate analysis.
2️⃣ Refresh Pivot Tables Regularly
After updating the Data Sheet:
-
Click “Refresh All”
-
Ensure charts update properly
Regular refreshing ensures accurate insights.
3️⃣ Standardize Waste Categories
Avoid duplicate naming such as:
-
“Industrial Waste”
-
“Ind. Waste”
-
“Industrial”
Instead, use consistent categories.
4️⃣ Track KPIs Monthly
Review monthly trends regularly. Because early detection prevents cost escalation, monthly review remains essential.
5️⃣ Monitor Maintenance Closely
High maintenance cost indicates deeper issues. Therefore:
-
Track breakdown frequency
-
Replace inefficient vehicles
-
Schedule preventive maintenance
6️⃣ Compare Zones Frequently
Zones differ in population and waste generation. However, you must benchmark performance regularly.
7️⃣ Use Service Ratings Strategically
Low service ratings highlight operational weaknesses. Therefore, conduct feedback reviews frequently.
How Does This Dashboard Improve Operational Efficiency?
This dashboard improves efficiency in multiple ways:
-
It reduces manual reporting time
-
It highlights inefficiencies instantly
-
It improves planning accuracy
-
It supports data-driven budgeting
-
It enhances transparency
Therefore, waste management companies gain both financial and operational benefits.
Who Can Benefit from the Waste Management Dashboard in Excel?
This dashboard suits:
-
Municipal corporations
-
Private waste management companies
-
Environmental service providers
-
Facility management firms
-
Industrial waste handlers
Because it scales easily, both small and large organizations can use it effectively.
Conclusion
Waste management demands precision, speed, and cost control. However, manual spreadsheets slow down decision-making. Therefore, you need structured analytics.
The Waste Management Dashboard in Excel provides a powerful yet simple solution. It centralizes data, tracks vehicles, monitors costs, and evaluates service quality.
Moreover, it improves accountability, enhances planning, and reduces unnecessary expenses.
If you want better control over your waste management operations, this dashboard delivers exactly what you need.
Frequently Asked Questions with Answers
1️⃣ What is a Waste Management Dashboard in Excel?
It is an interactive Excel-based reporting system that tracks vehicles, costs, maintenance, service ratings, and operational performance.
2️⃣ Can I customize the dashboard?
Yes. You can add new KPIs, additional zones, or extra waste categories easily.
3️⃣ Does this dashboard require advanced Excel skills?
No. Basic knowledge of Excel navigation and refreshing Pivot Tables is enough.
4️⃣ How often should I update the data?
You should update it daily or weekly, depending on operational volume.
5️⃣ Can small municipalities use this dashboard?
Yes. Small municipalities benefit greatly because it simplifies monitoring and budgeting.
6️⃣ Does this dashboard support long-term trend analysis?
Yes. The Month Analysis page tracks performance trends over time.
Visit our YouTube channel to learn step-by-step video tutorials