Modern businesses run on data. However, data alone does not drive performance. Companies must measure, compare, and analyze performance regularly. Therefore, organizations need a structured system to track Enterprise Resource Planning (ERP) metrics clearly.
So, how can companies monitor ERP performance without complex software?
The answer is simple.
You need an Enterprise Resource Planning KPI Scorecard in Excel.
This ready-to-use Excel template helps organizations track ERP KPIs in a structured, visual, and easy-to-understand format. Moreover, it allows managers to compare Actual vs Target performance using MTD (Month-to-Date) and YTD (Year-to-Date) analysis.
In this complete guide, you will learn:
-
What an Enterprise Resource Planning KPI Scorecard in Excel is
-
Why businesses need it
-
Detailed explanation of all 4 worksheets
-
Key ERP KPIs you can track
-
Advantages of Enterprise Resource Planning KPI Scorecard in Excel
-
Best Practices for the Enterprise Resource Planning KPI Scorecard
-
Frequently Asked Questions with Answers
Let us explore everything step by step.
Click to Purchases Enterprise Resource Planning KPI Scorecard in Excel
What Is an Enterprise Resource Planning KPI Scorecard in Excel?
An Enterprise Resource Planning KPI Scorecard in Excel is a structured performance tracking system that measures and monitors ERP-related metrics.
Instead of using multiple reports or dashboards, this template consolidates KPIs into one centralized scorecard. Moreover, it provides dynamic dropdown selections, trend charts, and performance indicators.
Therefore, managers gain clear visibility into:
-
Operational efficiency
-
Financial performance
-
Inventory management
-
Procurement performance
-
Order fulfillment efficiency
-
System utilization metrics
As a result, leadership teams make faster and more confident decisions.
Click to Purchases Enterprise Resource Planning KPI Scorecard in Excel
Why Do Organizations Need an ERP KPI Scorecard?
ERP systems manage finance, supply chain, HR, production, and sales. However, if organizations do not track ERP performance, they lose visibility.
Without structured KPI monitoring:
-
Departments operate in silos
-
Targets remain unclear
-
Performance gaps stay hidden
-
Decision-making slows down
However, an ERP KPI Scorecard in Excel solves these problems.
Because it tracks performance systematically, organizations can:
-
Compare Actual vs Target
-
Monitor MTD and YTD performance
-
Analyze performance trends
-
Identify weak areas quickly
-
Improve accountability
Consequently, businesses operate more efficiently.
Detailed Explanation of All 4 Worksheets
The Enterprise Resource Planning KPI Scorecard in Excel includes 4 well-structured worksheets. Each worksheet plays a specific role in performance management.
Click to Purchases Enterprise Resource Planning KPI Scorecard in Excel
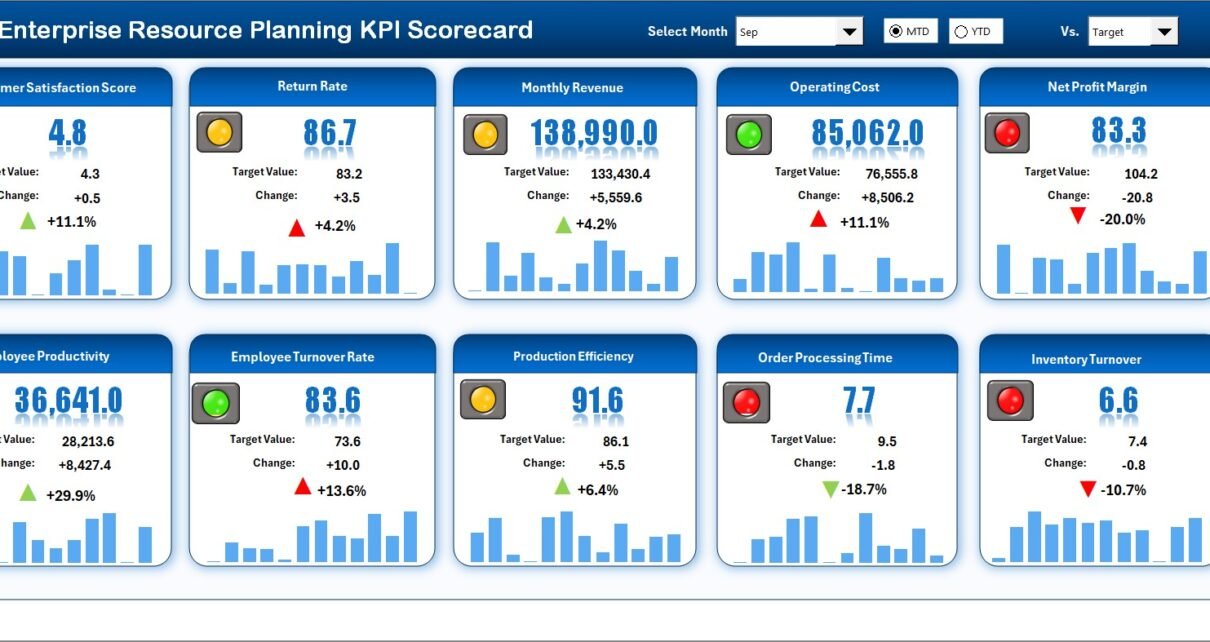
1️⃣ Scorecard Sheet – The Main Dashboard
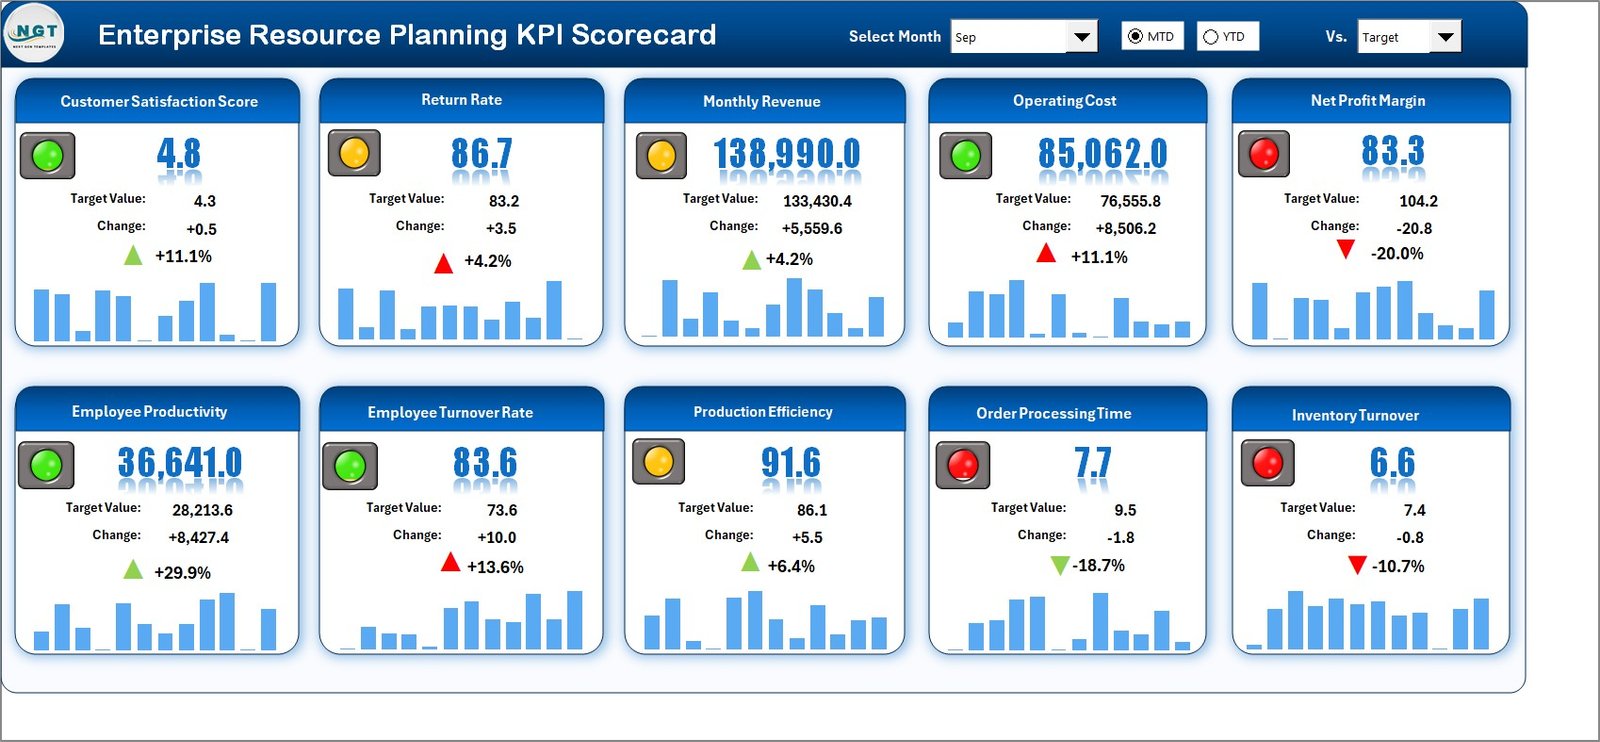
The Scorecard sheet acts as the central interface.
This sheet provides an overall view of KPI performance.
Key Features
🔹 Dropdown Menus
Users can select:
-
Month
-
MTD (Month-to-Date)
-
YTD (Year-to-Date)
Therefore, the scorecard updates dynamically based on the selected period.
🔹 Actual vs Target Values
The template compares:
-
Actual performance
-
Target performance
-
Previous Year (PY) values
Because it shows comparisons clearly, managers immediately understand whether performance meets expectations.
🔹 Visual Indicators
The scorecard uses color-coded indicators or conditional formatting.
For example:
-
Green indicates strong performance
-
Red highlights underperformance
Therefore, users quickly identify which KPIs require attention.
🔹 Comprehensive KPI Overview
The scorecard displays:
-
KPI Name
-
KPI Group
-
Unit
-
MTD values
-
YTD values
-
Target vs Actual comparison
As a result, leadership teams get a complete performance snapshot.
Click to Purchases Enterprise Resource Planning KPI Scorecard in Excel
2️⃣ KPI Trend Sheet – Performance Analysis Over Time
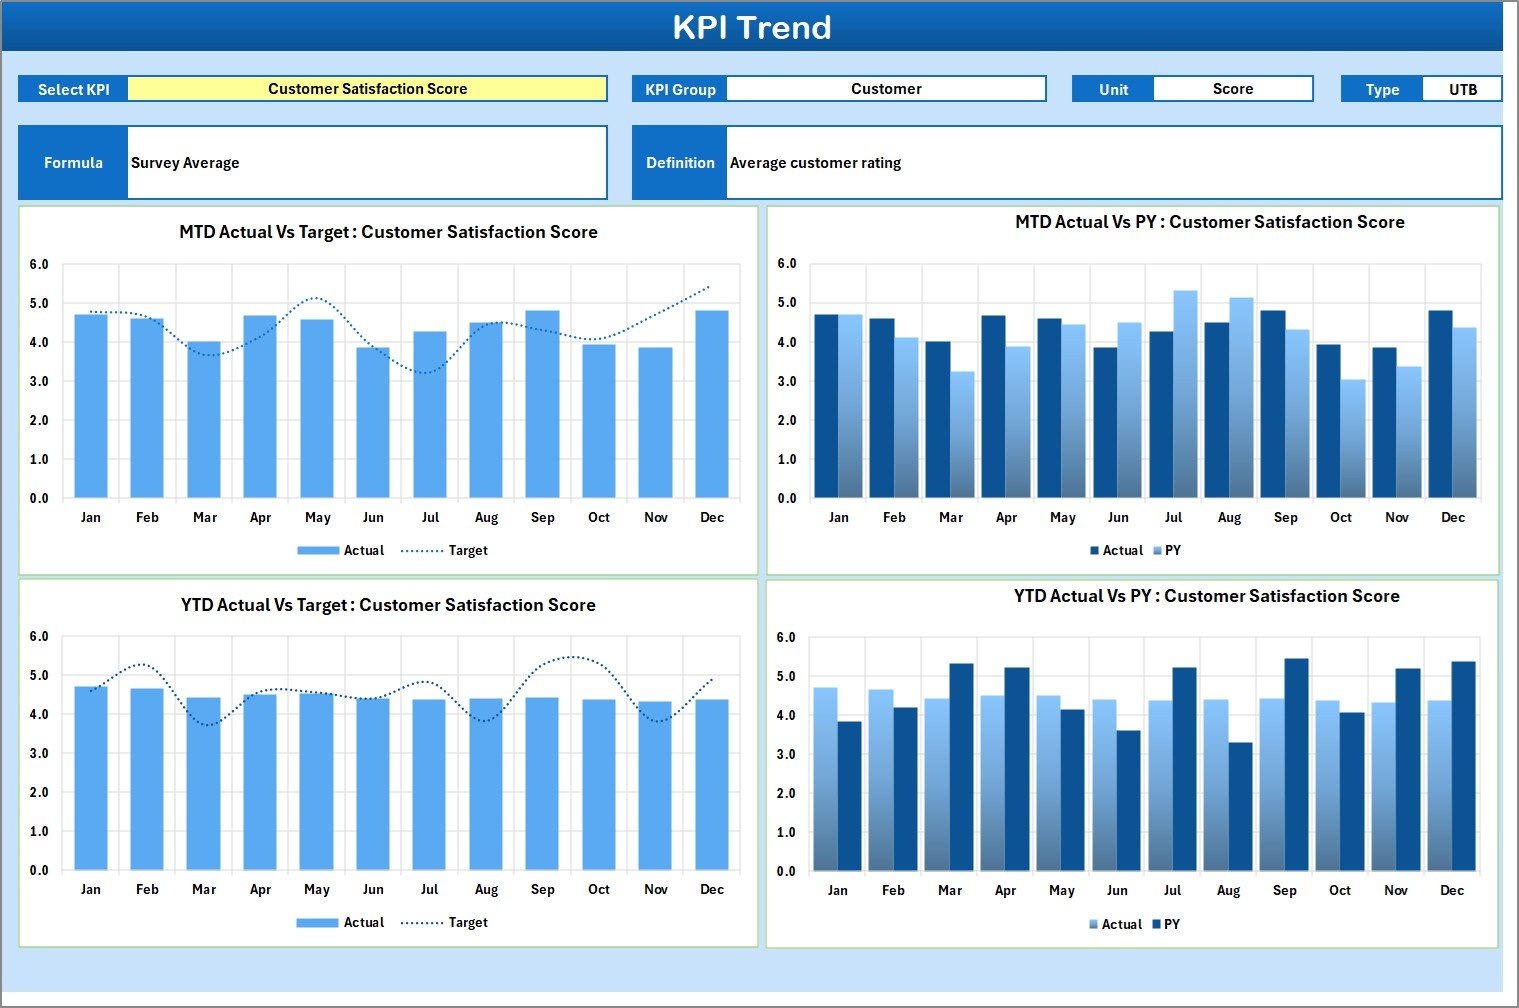
The KPI Trend sheet helps analyze trends for individual KPIs.
Users can select the KPI name from the dropdown available in cell C3.
Information Displayed
-
KPI Group
-
Unit of KPI
-
Type of KPI (Lower the Better or Upper the Better)
-
Formula
-
Definition
Additionally, the sheet displays:
-
MTD Trend Chart
-
YTD Trend Chart
-
Actual vs Target comparison
-
Previous Year comparison
Therefore, users not only see current performance but also track progress over time.
Trend analysis improves forecasting and planning. Consequently, management makes strategic decisions confidently.
Click to Purchases Enterprise Resource Planning KPI Scorecard in Excel
3️⃣ Input Data Sheet – Data Entry Section
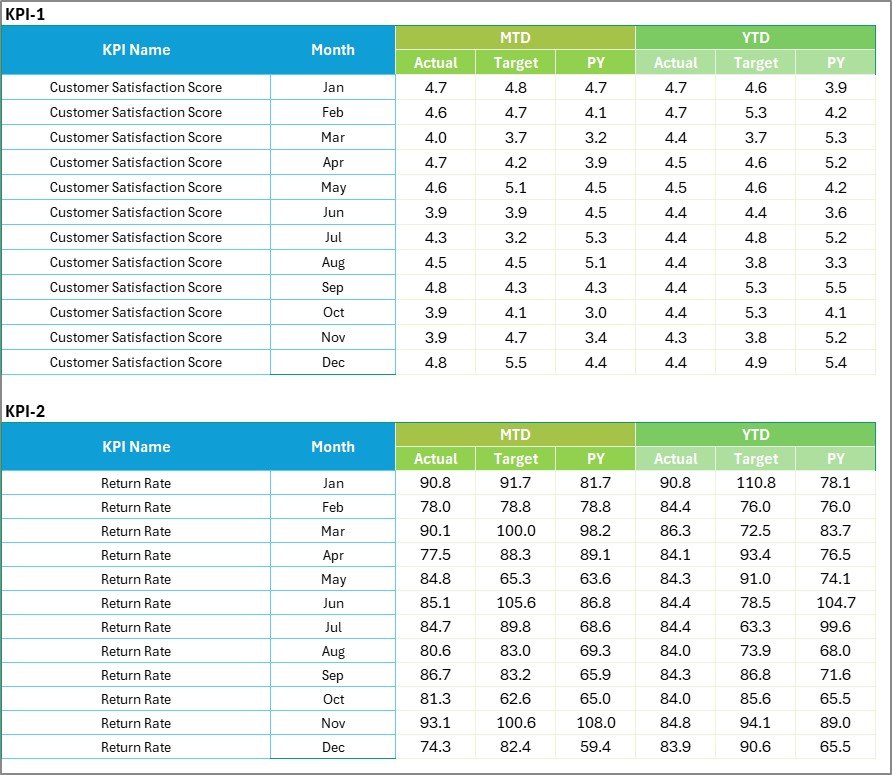
The Input Data sheet serves as the data foundation of the scorecard.
Here, users record:
-
Actual values
-
Target values
-
Previous year values
Because this sheet allows flexible updates, organizations can maintain up-to-date performance data.
Moreover, whenever users update values here, the scorecard refreshes automatically.
Therefore, the template remains dynamic and accurate.
Click to Purchases Enterprise Resource Planning KPI Scorecard in Excel
4️⃣ KPI Definition Sheet – KPI Documentation
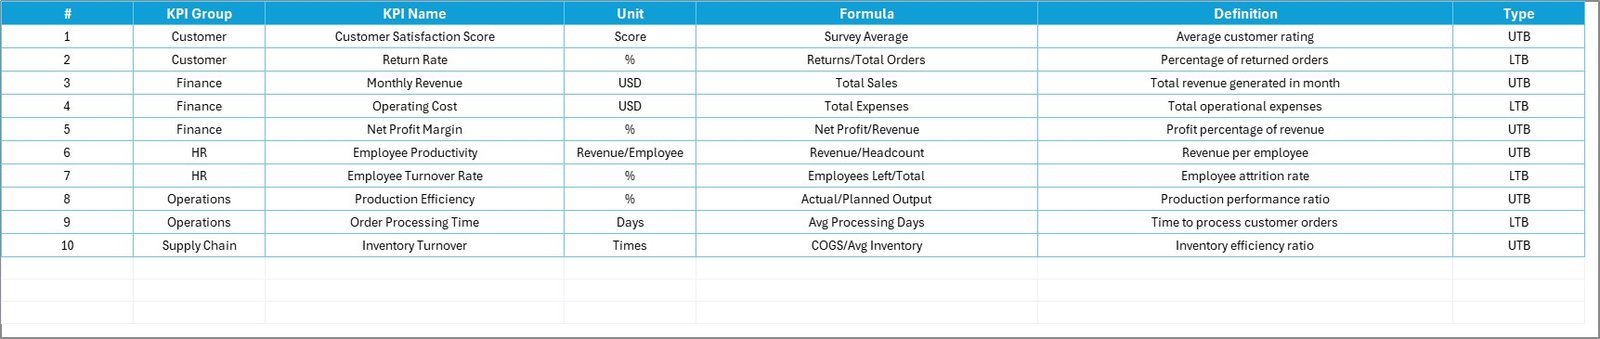
The KPI Definition sheet ensures clarity and standardization.
Here, users define:
-
KPI Name
-
KPI Group
-
Unit
-
Formula
-
KPI Definition
This documentation improves transparency. Moreover, it ensures that all departments understand KPI calculations clearly.
As a result, reporting accuracy improves.
Key ERP KPIs You Can Track
Organizations can track various ERP KPIs, such as:
Financial KPIs
-
Budget Variance %
-
Cost per Transaction
-
Accounts Payable Cycle Time
Inventory KPIs
-
Inventory Turnover Ratio
-
Stock Accuracy %
-
Days of Inventory
Procurement KPIs
-
Purchase Order Cycle Time
-
Supplier On-Time Delivery %
Sales KPIs
-
Order Fulfillment Rate
-
Revenue Growth %
System Performance KPIs
-
ERP System Uptime %
-
User Adoption Rate
-
Data Accuracy %
Because the template remains customizable, businesses can add KPIs according to their needs.
Advantages of Enterprise Resource Planning KPI Scorecard in Excel
Now let us explore the major advantages.
1️⃣ Centralized Performance Monitoring
You monitor all ERP KPIs in one place. Therefore, reporting becomes structured and efficient.
2️⃣ Dynamic Analysis
Dropdown filters allow instant MTD and YTD comparison.
3️⃣ Visual Clarity
Color indicators simplify performance analysis. Consequently, managers make quicker decisions.
4️⃣ Improved Accountability
Because targets and actuals appear side by side, teams understand expectations clearly.
5️⃣ Flexible Data Updates
You can update data easily in the Input Data sheet.
6️⃣ Enhanced Strategic Planning
Trend analysis supports forecasting and long-term planning.
7️⃣ User-Friendly Interface
The Excel-based format ensures simplicity. Therefore, even non-technical users can manage it.
Click to Purchases Enterprise Resource Planning KPI Scorecard in Excel
Best Practices for the Enterprise Resource Planning KPI Scorecard
To maximize the benefits, follow these best practices.
✔ Define Clear KPIs
Choose KPIs that align with business goals.
✔ Update Data Regularly
Enter updated values monthly to maintain accuracy.
✔ Review MTD and YTD Together
Compare short-term and long-term performance simultaneously.
✔ Maintain Accurate KPI Definitions
Ensure formulas and definitions remain consistent.
✔ Conduct Monthly Review Meetings
Use the scorecard during management meetings.
✔ Assign KPI Owners
Assign responsibility for each KPI to specific managers.
✔ Backup Data Periodically
Save backup copies to prevent data loss.
How Does This Scorecard Improve Business Performance?
This scorecard improves performance because it:
-
Enhances visibility
-
Reduces reporting delays
-
Improves transparency
-
Encourages accountability
-
Supports strategic decisions
Moreover, it aligns ERP metrics with business objectives.
Therefore, organizations achieve operational excellence.
Who Can Use This Template?
The Enterprise Resource Planning KPI Scorecard in Excel benefits:
-
ERP Managers
-
CFOs
-
Operations Managers
-
Supply Chain Managers
-
Business Analysts
-
IT Administrators
Therefore, it supports cross-functional leadership.
Conclusion
ERP systems manage core business functions. However, without structured KPI tracking, companies cannot measure performance effectively.
The Enterprise Resource Planning KPI Scorecard in Excel provides:
-
Dynamic MTD and YTD analysis
-
Clear Actual vs Target comparison
-
Trend visualization
-
Centralized KPI monitoring
-
Structured documentation
Moreover, it improves transparency, accountability, and strategic control.
If you want better ERP performance tracking, this scorecard delivers a powerful and practical solution.
Click to Purchases Enterprise Resource Planning KPI Scorecard in Excel
Frequently Asked Questions with Answers
1️⃣ What is an ERP KPI Scorecard in Excel?
It is a ready-to-use Excel template that tracks ERP performance metrics using structured analysis.
2️⃣ Can I customize KPIs?
Yes. You can add or modify KPIs in the KPI Definition sheet.
3️⃣ Does it support MTD and YTD analysis?
Yes. You can switch between MTD and YTD using dropdown menus.
4️⃣ How does trend analysis work?
The KPI Trend sheet displays charts comparing Actual, Target, and Previous Year data.
5️⃣ Is this template suitable for small businesses?
Yes. Both small and large businesses can use it.
6️⃣ Do I need advanced Excel skills?
No. The template provides user-friendly dropdowns and automated calculations.
Click to Purchases Enterprise Resource Planning KPI Scorecard in Excel
Visit our YouTube channel to learn step-by-step video tutorials
