DevOps teams move fast. They deploy code daily, fix issues instantly, and automate processes continuously. However, without structured measurement, speed can hide problems. Therefore, every DevOps team needs a powerful reporting system.
So, how can you track deployment performance, reliability, and efficiency in one place?
The answer is clear.
You need a DevOps Teams KPI Dashboard in Power BI.
This ready-to-use dashboard captures DevOps data from Excel and transforms it into interactive, dynamic visuals inside Power BI. As a result, engineering leaders gain full visibility over KPI performance, trends, and comparisons.
Let us explore everything step by step.
Click to Purchases DevOps Teams KPI Dashboard in Power BI
What Is a DevOps Teams KPI Dashboard in Power BI?
A DevOps Teams KPI Dashboard in Power BI is an interactive business intelligence solution designed to track DevOps performance metrics. It connects to structured Excel data and converts it into meaningful visuals.
Instead of reviewing static spreadsheets, you can:
-
Monitor Month-to-Date (MTD) and Year-to-Date (YTD) performance
-
Compare Actual vs Target instantly
-
Track Current Year vs Previous Year trends
-
Analyze KPI groups dynamically
-
Drill through for KPI details
Because Power BI updates visuals automatically, you always see accurate insights.
Why Do DevOps Teams Need a KPI Dashboard in Power BI?
DevOps combines development and operations. Therefore, teams must balance speed, quality, and stability. However, manual reporting slows decisions.
Here is why a structured dashboard matters:
-
Deployment frequency increases
-
Infrastructure complexity grows
-
Downtime impacts business revenue
-
Security monitoring becomes critical
-
Leadership demands transparency
Consequently, Power BI provides clarity, automation, and data-driven decision-making.
Click to Purchases DevOps Teams KPI Dashboard in Power BI
Key Features of DevOps Teams KPI Dashboard in Power BI
This dashboard includes 3 structured pages inside the Power BI Desktop file. Each page serves a specific purpose.
Let us examine them in detail.
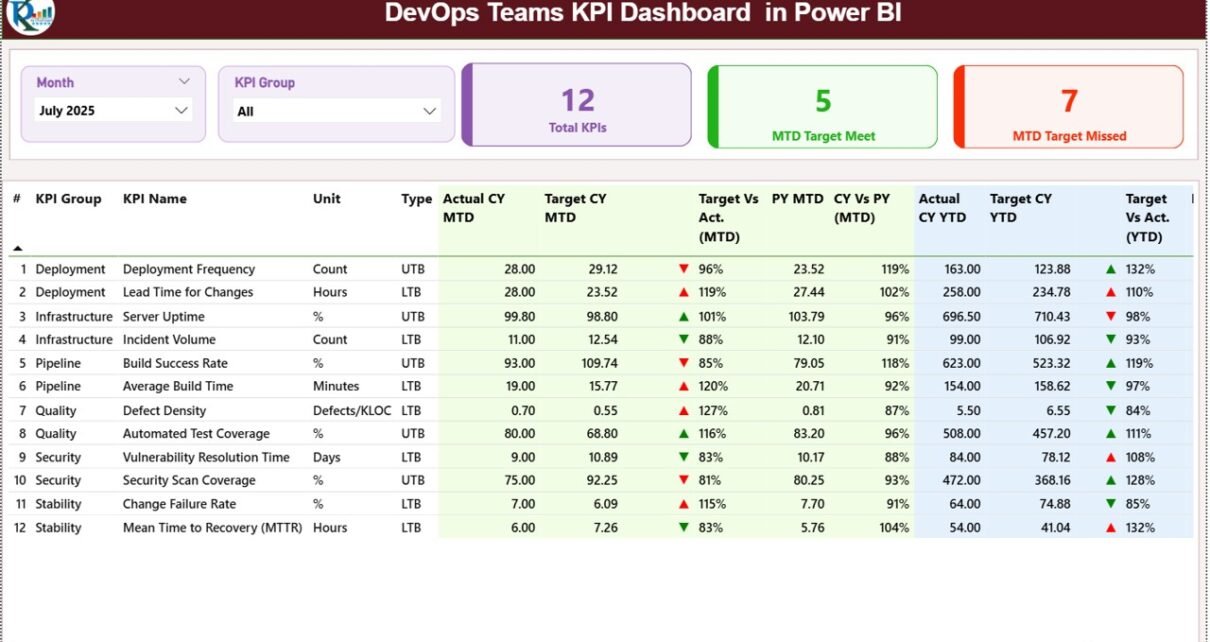
1️⃣ Summary Page – Where Do You Monitor Overall KPI Performance?
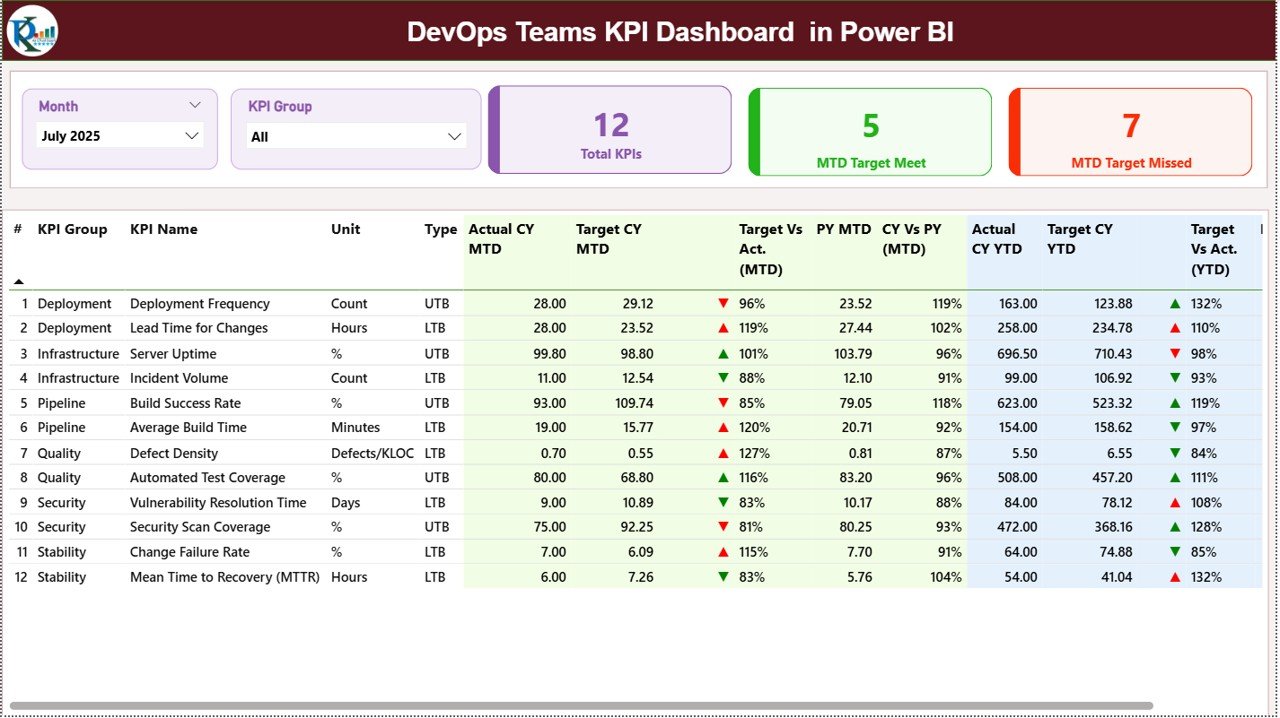
The Summary Page acts as the central reporting interface.
🔹 Top Section
At the top, you will find:
-
Month slicer
-
KPI Group slicer
-
Total KPI Count Card
-
MTD Target Meet Count
-
MTD Target Missed Count
Because slicers filter the entire report, you can instantly view performance for a selected month or KPI group.
🔹 Detailed KPI Table
Below the cards, the dashboard displays a structured table with the following columns:
-
KPI Number – Sequence number
-
KPI Group – Category of KPI
-
KPI Name – KPI description
-
Unit – Measurement unit
-
Type – LTB (Lower the Better) or UTB (Upper the Better)
🔹 MTD Performance Metrics
-
Actual CY MTD
-
Target CY MTD
-
MTD Icon (▲ Green / ▼ Red)
-
Target vs Actual (MTD) %
-
PY MTD
-
CY vs PY (MTD) %
The dashboard calculates:
Target vs Actual (MTD) = Actual MTD / Target MTD
CY vs PY (MTD) = Current MTD / Previous Year MTD
Because of conditional formatting icons, users immediately identify performance gaps.
🔹 YTD Performance Metrics
-
Actual CY YTD
-
Target CY YTD
-
YTD Icon
-
Target vs Actual (YTD) %
-
PY YTD
-
CY vs PY (YTD) %
Target vs Actual (YTD) = Actual YTD / Target YTD
CY vs PY (YTD) = Current YTD / Previous Year YTD
Therefore, the dashboard offers both short-term and long-term visibility.
Click to Purchases DevOps Teams KPI Dashboard in Power BI
2️⃣ KPI Trend Page – How Do You Analyze Trends Over Time?
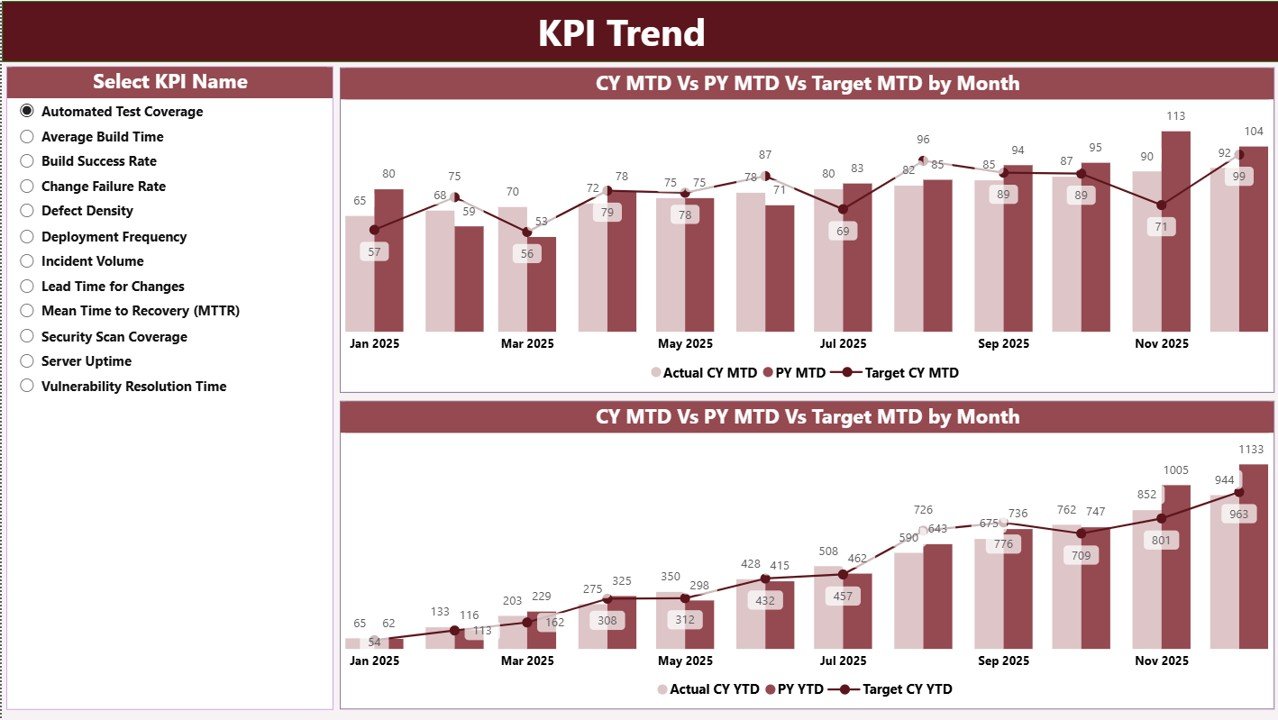
The KPI Trend Page focuses on visual analysis.
Here, you get:
-
KPI Name slicer on the left
-
Two combo charts
-
MTD Trend Chart
-
YTD Trend Chart
-
Each chart compares:
-
Current Year Actual
-
Previous Year Actual
-
Target
Because combo charts combine columns and lines, you can quickly see performance direction.
As a result, leaders can identify patterns early and act faster.
3️⃣ KPI Definition Page – Why Is Drill-Through Important?
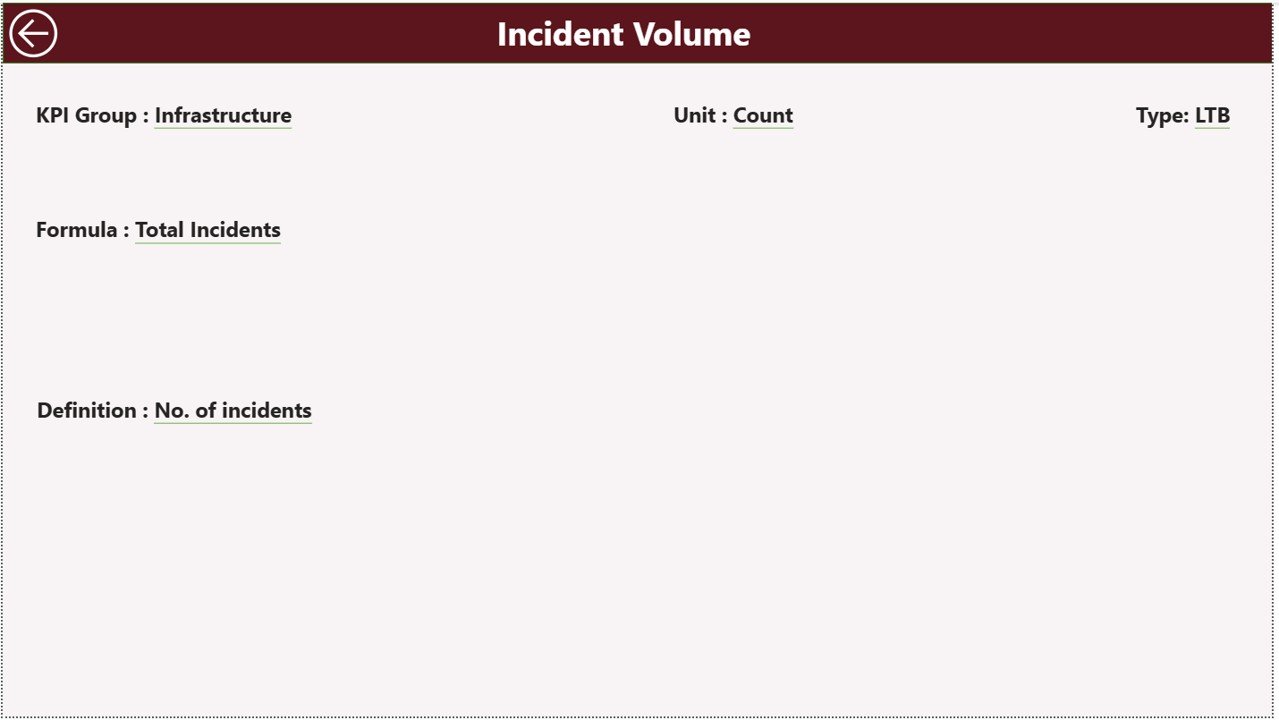
The KPI Definition Page works as a drill-through page.
It remains hidden by default. However, from the Summary Page, you can right-click and drill through to view:
-
KPI Formula
-
KPI Definition
-
KPI Group
-
KPI Type
To return, simply click the back button at the top-left corner.
Therefore, the dashboard ensures transparency and documentation.
Excel Data Structure – How Does the Data Source Work?
This Power BI dashboard uses an Excel file as its data source.
You must fill three sheets:
1️⃣ Input_Actual Sheet
Enter:
-
KPI Name
-
Month (use first date of month)
-
MTD Value
-
YTD Value
Because Power BI connects directly to this sheet, updates reflect instantly.
2️⃣ Input_Target Sheet
Enter:
-
KPI Name
-
Month
-
MTD Target
-
YTD Target
As a result, the dashboard compares Actual vs Target automatically.
3️⃣ KPI Definition Sheet
Enter:
-
KPI Number
-
KPI Group
-
KPI Name
-
Unit
-
Formula
-
Definition
-
Type (LTB or UTB)
Therefore, Power BI links KPI metadata to performance data.
Click to Purchases DevOps Teams KPI Dashboard in Power BI
What KPIs Should DevOps Teams Track?
Although each organization differs, most DevOps teams track:
Deployment KPIs
-
Deployment Frequency
-
Lead Time for Changes
-
Release Success Rate
-
Change Failure Rate
Reliability KPIs
-
System Uptime %
-
Mean Time to Recovery (MTTR)
-
Incident Resolution Time
Quality KPIs
-
Defect Rate
-
Automated Test Coverage
-
Build Success Rate
Efficiency KPIs
-
Sprint Velocity
-
Pipeline Duration
-
Infrastructure Cost Efficiency
Because structured measurement drives improvement, KPI tracking becomes essential.
Click to Purchases DevOps Teams KPI Dashboard in Power BI
Advantages of DevOps Teams KPI Dashboard in Power BI
Now let us explore the real benefits.
1️⃣ Real-Time Performance Visibility
Power BI updates visuals dynamically. Therefore, leaders access accurate insights instantly.
2️⃣ Faster Decision-Making
Since the dashboard centralizes KPIs, managers identify issues quickly.
3️⃣ Improved Accountability
When KPI performance stays visible, teams focus on results.
4️⃣ Trend Identification
MTD and YTD comparisons reveal patterns. As a result, teams predict risks early.
5️⃣ Automated Reporting
Instead of building manual Excel reports, Power BI automates calculations and visuals.
6️⃣ Drill-Through Transparency
Because KPI definitions stay accessible, stakeholders understand metrics clearly.
How Does This Dashboard Improve DevOps Performance?
This dashboard supports DevOps success by:
-
Highlighting bottlenecks
-
Tracking deployment speed
-
Monitoring downtime
-
Comparing year-over-year growth
-
Measuring target achievement
Consequently, teams align technical performance with business goals.
Click to Purchases DevOps Teams KPI Dashboard in Power BI
Best Practices for the DevOps Teams KPI Dashboard in Power BI
To maximize results, follow these best practices:
✅ Define Business-Aligned KPIs
Choose KPIs that directly impact delivery speed and stability.
✅ Keep Data Updated Monthly
Consistency ensures accurate reporting.
✅ Use LTB and UTB Correctly
Define whether higher or lower values indicate improvement.
✅ Review Trends Regularly
Analyze both MTD and YTD visuals.
✅ Avoid Too Many KPIs
Focus on critical metrics instead of overwhelming reports.
✅ Share Insights with Leadership
Transparent reporting builds trust and improves alignment.
Who Should Use This Dashboard?
This dashboard helps:
-
DevOps Managers
-
CTOs
-
Engineering Heads
-
IT Operations Leaders
-
Agile Delivery Managers
Moreover, startups and enterprises benefit equally.
How to Implement the DevOps KPI Dashboard Successfully?
Follow these steps:
-
Define KPI structure
-
Prepare Excel data
-
Import data into Power BI
-
Set slicers and filters
-
Validate calculations
-
Schedule monthly reviews
Because structured implementation drives consistency, regular review ensures continuous improvement.
Conclusion
DevOps teams operate in a high-speed environment. They must balance agility, stability, and quality. However, without structured reporting, performance gaps remain hidden.
The DevOps Teams KPI Dashboard in Power BI provides clarity, automation, and actionable insights. It centralizes KPI tracking, compares performance against targets, and highlights trends with dynamic visuals.
If your organization wants faster decisions, better visibility, and measurable DevOps growth, this dashboard delivers the right solution.
Click to Purchases DevOps Teams KPI Dashboard in Power BI
Frequently Asked Questions with Answers
1. What is a DevOps KPI Dashboard in Power BI?
It is an interactive report that tracks DevOps metrics such as deployment frequency, uptime, and failure rate.
2. Does this dashboard support MTD and YTD tracking?
Yes. It tracks both Month-to-Date and Year-to-Date metrics.
3. Can I customize KPIs?
Yes. You can modify KPI names, formulas, and groups in the Excel data file.
4. How does the dashboard compare previous year performance?
It calculates Current Year vs Previous Year percentages automatically.
5. Do I need advanced Power BI skills?
No. The dashboard comes ready to use. You only need to update Excel data.
6. Why should DevOps teams track KPIs?
Because measurement drives improvement, KPI tracking ensures better speed, quality, and reliability.
Click to Purchases DevOps Teams KPI Dashboard in Power BI
Visit our YouTube channel to learn step-by-step video tutorials