Retail businesses move fast. Products arrive daily. Customers expect availability. Margins stay tight. However, many retailers still manage inventory using scattered spreadsheets and manual tracking. As a result, stockouts increase, overstock piles up, and profits shrink.
So, how can you monitor inventory performance clearly and improve decision-making?
You need a Retail Inventory KPI Scorecard in Excel.
This ready-to-use scorecard helps you track essential retail inventory metrics in one structured dashboard. Moreover, it allows you to compare Actual vs Target, analyze Month-to-Date (MTD) and Year-to-Date (YTD) results, and review previous year performance. Therefore, you gain complete control over stock levels, turnover, and profitability.
In this detailed guide, you will learn:
-
What a Retail Inventory KPI Scorecard in Excel is
-
Why retailers need it
-
Detailed explanation of all worksheets
-
Key inventory KPIs you should track
-
Advantages of using this scorecard
-
Best practices for implementation
-
Frequently Asked Questions with Answers
Let us explore everything step by step.
Click to Purchases Retail Inventory KPI Scorecard in Excel
What Is a Retail Inventory KPI Scorecard in Excel?
A Retail Inventory KPI Scorecard in Excel is a structured performance monitoring tool designed to track inventory-related metrics in retail businesses.
Instead of reviewing raw stock reports manually, you can:
-
Monitor stock turnover
-
Track sell-through rate
-
Compare inventory carrying cost
-
Analyze stock aging
-
Measure shrinkage
-
Review MTD and YTD trends
Because the scorecard runs in Excel, you can customize it easily. At the same time, you can maintain data accuracy and consistency.
Why Do Retailers Need an Inventory KPI Scorecard?
Retail inventory directly impacts revenue and cash flow. However, without structured monitoring, problems grow silently.
For example:
-
Overstock increases holding costs
-
Understock leads to lost sales
-
Slow-moving items reduce profitability
-
Shrinkage damages margins
Therefore, retailers must track KPIs regularly.
When you use a Retail Inventory KPI Scorecard:
-
You gain visibility into stock performance
-
You identify weak-performing categories
-
You reduce waste
-
You improve purchasing decisions
-
You protect profit margins
As a result, your retail operation becomes efficient and data-driven.
Click to Purchases Retail Inventory KPI Scorecard in Excel
How Is the Retail Inventory KPI Scorecard Structured?
This template contains 4 worksheets, each designed to serve a specific purpose.
Let us review them one by one.
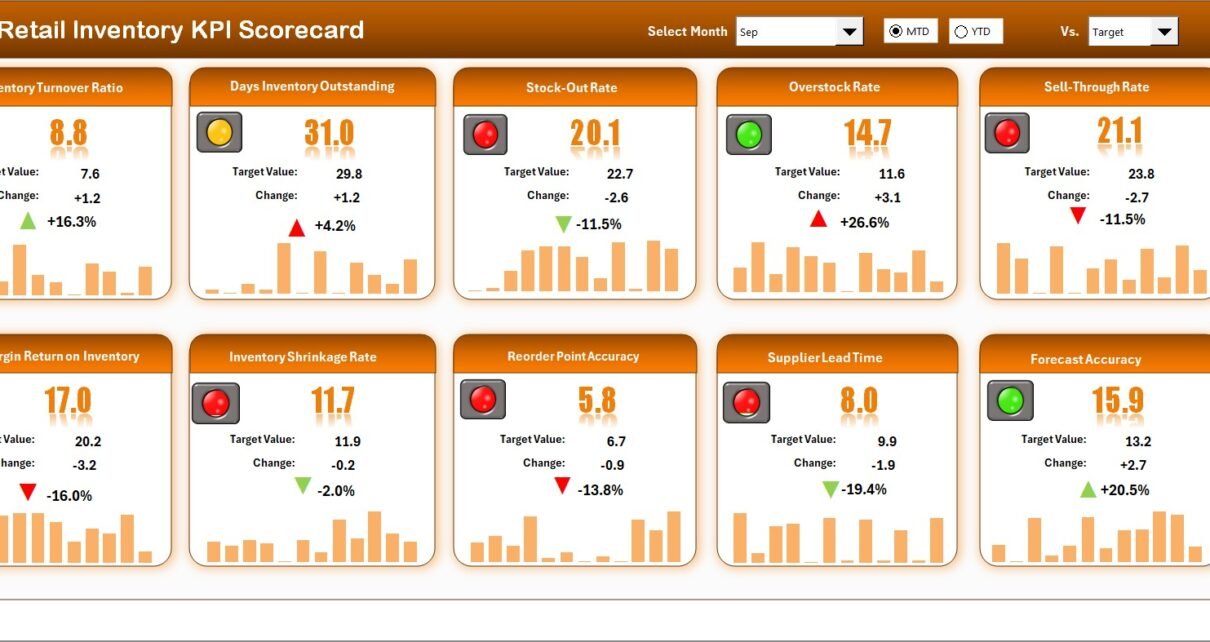
1️⃣ Scorecard Sheet – The Main Performance Dashboard
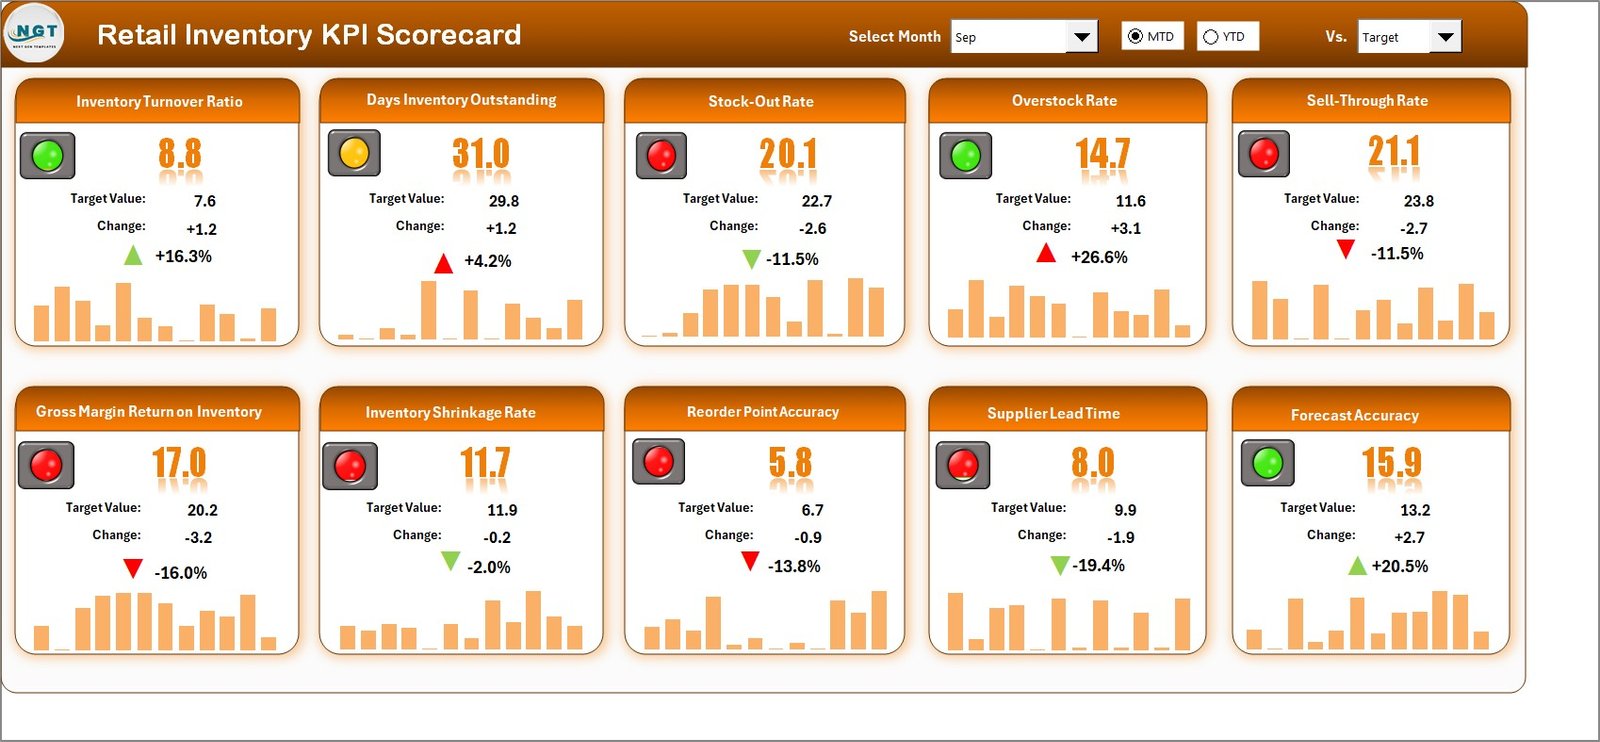
The Scorecard Sheet acts as the main interface.
Here, you can view complete KPI performance at a glance.
Key Features of the Scorecard Sheet
🔹 Dropdown Menus
You can select:
-
Month
-
MTD (Month-to-Date)
-
YTD (Year-to-Date)
Because of this flexibility, you can analyze performance for any period instantly.
🔹 Actual vs Target Comparison
For each KPI, you can compare:
-
Actual Value
-
Target Value
-
Previous Year Value
Additionally, you can view:
-
Target vs Actual variance
-
PY vs Actual variance
Therefore, you identify performance gaps quickly.
🔹 Visual Indicators
The scorecard uses:
-
Color-coded signals
-
Conditional formatting
-
Up and down arrows
These indicators help you understand performance status instantly.
For example:
-
Green arrow indicates improvement
-
Red arrow highlights decline
Because visuals simplify analysis, managers make faster decisions.
🔹 Comprehensive KPI Overview
The dashboard displays:
-
KPI Name
-
KPI Group
-
Unit of Measurement
-
MTD Data
-
YTD Data
-
Performance comparison
Therefore, you get a complete inventory health snapshot.
Click to Purchases Retail Inventory KPI Scorecard in Excel
2️⃣ KPI Trend Sheet – Deep Performance Analysis
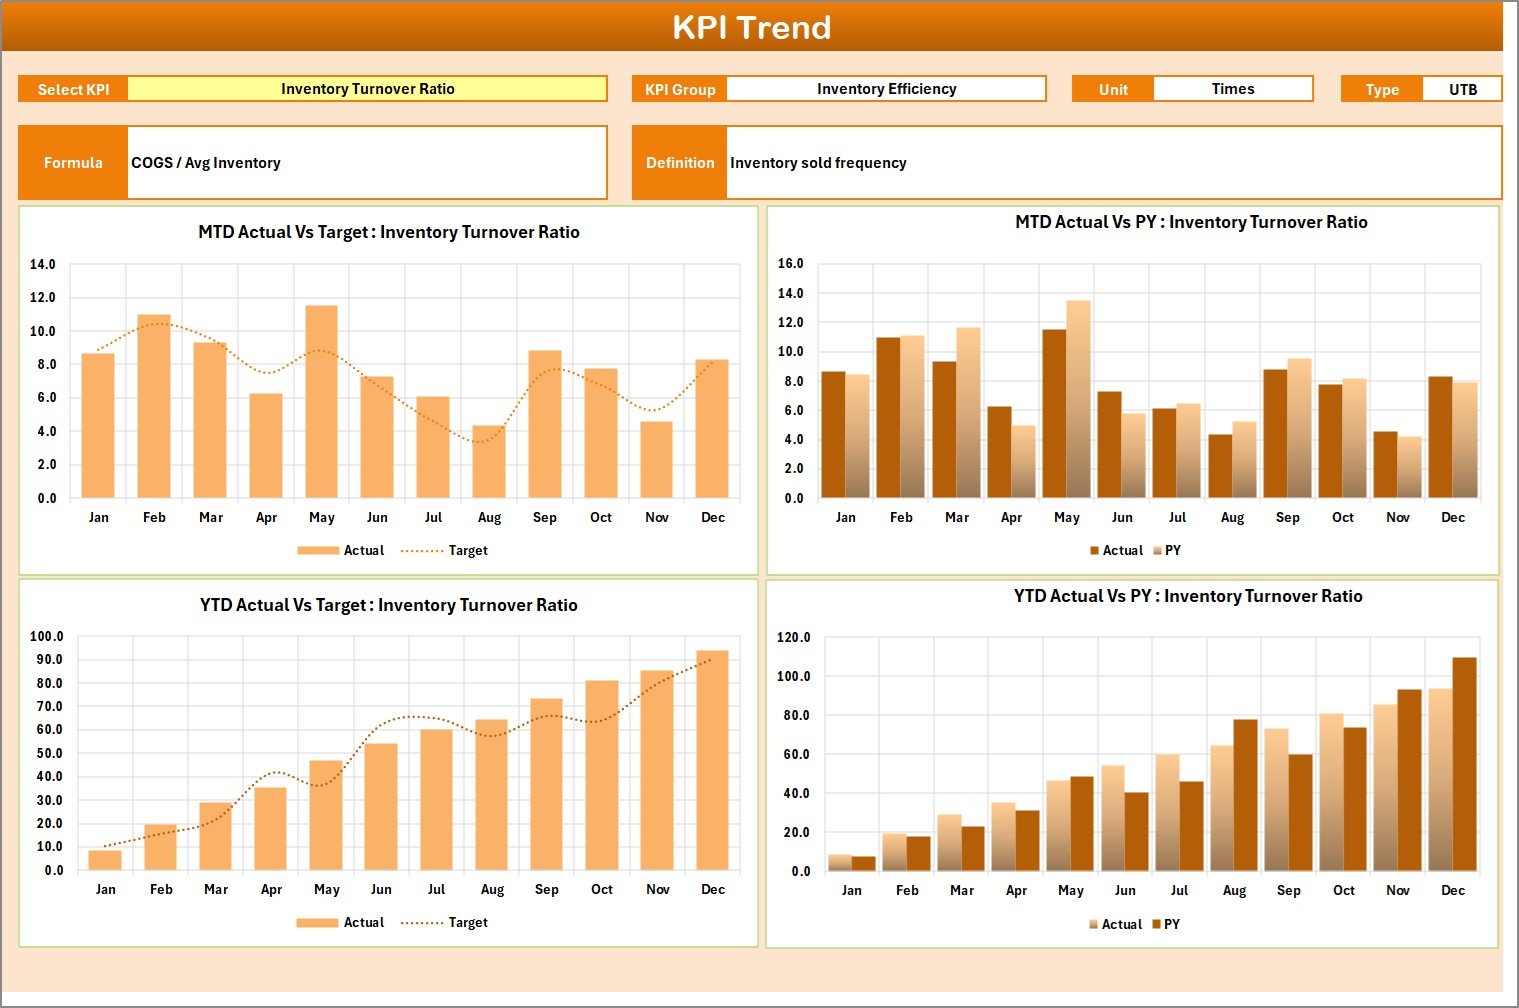
The KPI Trend Sheet allows you to analyze individual KPIs in detail.
What Can You Do Here?
-
Select KPI from drop-down (Cell C3)
-
View KPI Group
-
Check Unit of KPI
-
Identify KPI Type (Lower the Better / Upper the Better)
-
Review KPI Formula
-
Understand KPI Definition
Additionally, the sheet displays:
-
MTD Trend Chart (Actual vs Target vs PY)
-
YTD Trend Chart (Actual vs Target vs PY)
Because of these charts, you can detect patterns over time.
For example:
-
Is inventory turnover improving?
-
Is shrinkage increasing?
-
Are holding costs rising steadily?
Therefore, you can adjust strategies accordingly.
3️⃣ Input Data Sheet – Where You Enter KPI Data
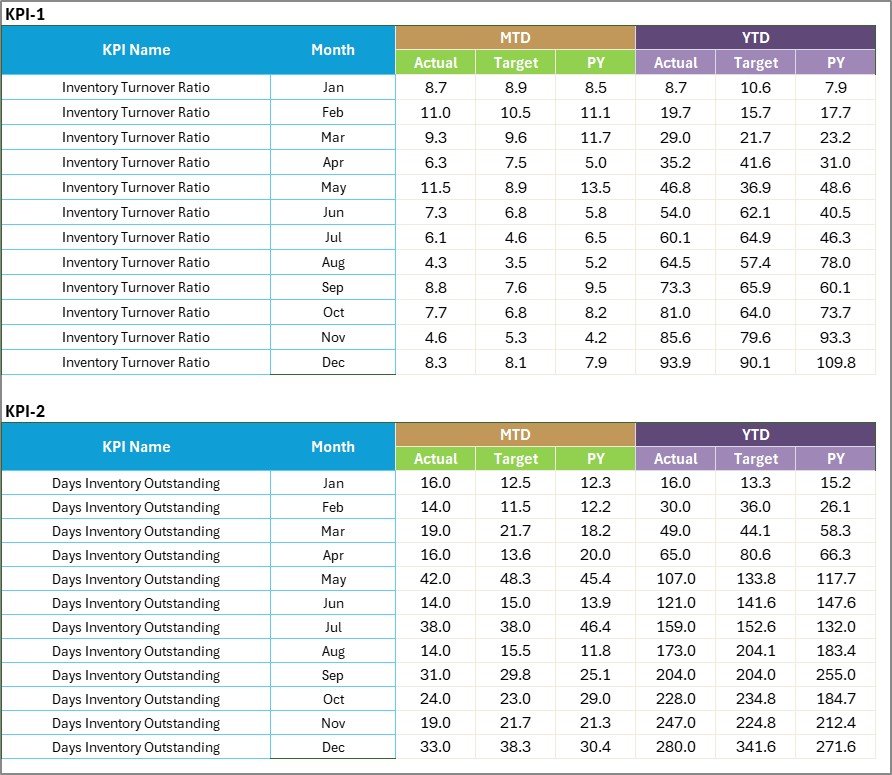
The Input Data Sheet acts as the data entry area.
Here, you record:
-
Actual values
-
Target values
-
Other KPI metrics
This sheet offers flexibility. You can update data monthly as new results become available.
Because the dashboard links directly to this sheet, updates reflect automatically.
Therefore, your scorecard always stays current.
Click to Purchases Retail Inventory KPI Scorecard in Excel
4️⃣ KPI Definition Sheet – Maintaining Clarity and Consistency
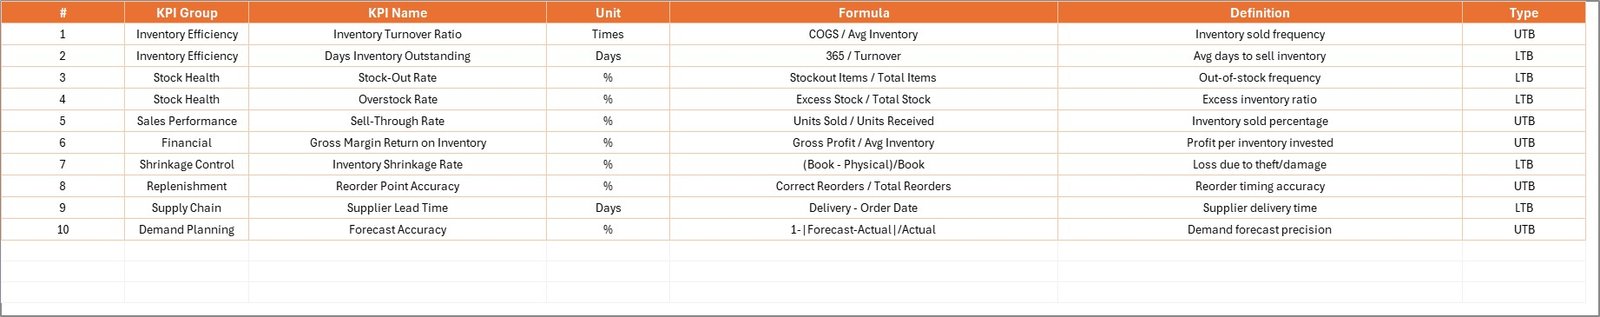
The KPI Definition Sheet stores KPI information such as:
-
KPI Name
-
KPI Group
-
Unit
-
Formula
-
KPI Definition
This sheet ensures transparency.
When everyone understands KPI definitions:
-
Confusion reduces
-
Reporting accuracy improves
-
Accountability increases
Therefore, governance becomes stronger.
Click to Purchases Retail Inventory KPI Scorecard in Excel
What Retail Inventory KPIs Should You Track?
Although every retailer differs, most businesses track the following KPIs.
Inventory Turnover Ratio
This KPI measures how many times inventory sells during a period.
Higher turnover usually indicates efficient stock management.
Sell-Through Rate
This KPI measures how much inventory sells compared to received stock.
Higher sell-through improves cash flow.
Stock Aging
This KPI tracks how long products stay in inventory.
Lower aging reduces risk of obsolescence.
Gross Margin Return on Inventory (GMROI)
This KPI measures profit earned for each rupee invested in inventory.
Higher GMROI indicates better purchasing strategy.
Shrinkage Rate
This KPI tracks loss due to theft, damage, or error.
Lower shrinkage protects profit.
Inventory Carrying Cost
This KPI measures storage and holding expenses.
Lower carrying cost improves profitability.
Because the scorecard allows LTB (Lower the Better) and UTB (Upper the Better) classification, performance interpretation becomes clear.
Click to Purchases Retail Inventory KPI Scorecard in Excel
Advantages of Retail Inventory KPI Scorecard in Excel
Now let us explore its major advantages.
1️⃣ Centralized Inventory Monitoring
You can track all inventory KPIs in one dashboard.
2️⃣ Clear Performance Visibility
Color-coded indicators simplify complex data.
3️⃣ Real-Time Comparison
You can compare:
-
Actual vs Target
-
Current Year vs Previous Year
Therefore, you identify issues immediately.
4️⃣ Trend-Based Decision Making
MTD and YTD trend charts help you plan future purchases effectively.
5️⃣ Easy Customization
Because Excel offers flexibility, you can:
-
Add new KPIs
-
Modify formulas
-
Adjust targets
-
Customize layout
6️⃣ Cost-Effective Solution
You avoid expensive inventory management software.
How Does This Scorecard Improve Retail Profitability?
This scorecard improves profitability in several ways.
Better Stock Planning
You avoid overstock and understock.
Improved Cash Flow
Faster turnover frees working capital.
Reduced Waste
You monitor slow-moving products early.
Stronger Supplier Negotiation
Data-backed insights improve vendor discussions.
Click to Purchases Retail Inventory KPI Scorecard in Excel
Best Practices for the Retail Inventory KPI Scorecard
To maximize value, follow these best practices.
1. Define Relevant KPIs
Avoid tracking too many metrics. Focus on actionable KPIs.
2. Update Data Monthly
Consistent updates ensure reliable reports.
3. Validate Data Accuracy
Check numbers before entry.
4. Review Trends Regularly
Analyze both MTD and YTD patterns.
5. Align KPIs with Business Goals
Ensure KPIs support growth strategy.
6. Train Your Team
Ensure managers understand KPI meaning.
How to Implement Retail Inventory KPI Scorecard Successfully?
Follow these steps:
-
Identify inventory KPIs
-
Enter KPI definitions
-
Set monthly targets
-
Record actual data
-
Review dashboard
-
Conduct monthly inventory meetings
-
Take corrective action
Because you follow structured steps, implementation becomes smooth.
Who Should Use This Scorecard?
This template suits:
-
Retail store owners
-
Supermarkets
-
E-commerce sellers
-
Fashion retailers
-
Electronics retailers
-
Warehouse managers
-
Inventory analysts
Whether you manage a single store or multiple outlets, this scorecard provides clarity.
Click to Purchases Retail Inventory KPI Scorecard in Excel
Conclusion: Why Should You Use a Retail Inventory KPI Scorecard in Excel?
Inventory management determines retail success. However, without structured monitoring, businesses lose money silently.
The Retail Inventory KPI Scorecard in Excel provides:
-
MTD and YTD tracking
-
Actual vs Target comparison
-
Previous Year benchmarking
-
Trend analysis
-
Visual performance indicators
-
Easy customization
Therefore, you gain control over stock levels, reduce waste, and improve profitability.
If you want smarter inventory decisions without complex software, this Excel scorecard delivers powerful results in a simple format.
Click to Purchases Retail Inventory KPI Scorecard in Excel
Frequently Asked Questions with Answers
1. What is a Retail Inventory KPI Scorecard in Excel?
It is an Excel template that tracks retail inventory performance metrics using structured KPIs.
2. Can I customize KPIs?
Yes. You can modify KPIs and formulas based on your business needs.
3. Does it support MTD and YTD tracking?
Yes. The dashboard displays both MTD and YTD performance.
4. Can I compare with previous year data?
Yes. You can enter previous year data and analyze performance differences.
5. Do I need advanced Excel skills?
No. Basic Excel knowledge is enough to use this scorecard.
6. Is it suitable for small retailers?
Yes. Both small and large retailers can benefit from this template.
7. Can I use it for multiple store locations?
Yes. You can customize the sheet to include store-wise data.
Click to Purchases Retail Inventory KPI Scorecard in Excel
Visit our YouTube channel to learn step-by-step video tutorials