Managing facility leases across multiple locations can quickly become overwhelming. Many organizations still depend on scattered spreadsheets. As a result, they lose visibility into lease costs, escalation trends, and occupancy performance. Moreover, decision-makers often struggle to control expenses and monitor facility utilization effectively.
So, how can facility managers track lease costs, service charges, downtime, and escalation percentages in one structured system?
The answer is simple.
You need a Facilities Leasing Dashboard in Excel.
Click to Purchases Facilities Leasing Dashboard in Excel
This ready-to-use dashboard helps facility teams monitor lease performance, analyze cost drivers, and identify optimization opportunities in one centralized Excel framework. Furthermore, it enables fast monthly analysis. Therefore, organizations gain clarity, control, and confidence in their facility decisions.
In this detailed guide, you will learn:
-
What a Facilities Leasing Dashboard in Excel is
-
Why organizations need it
-
Detailed explanation of all 5 analytical pages
-
Advantages of the Facilities Leasing Dashboard in Excel
-
Best practices for using the dashboard
-
Frequently asked questions with answers
Let us explore everything step by step.
What Is a Facilities Leasing Dashboard in Excel?
A Facilities Leasing Dashboard in Excel is a structured analytical tool that helps organizations monitor and manage leased facilities efficiently. It consolidates lease data, service charges, downtime metrics, and escalation percentages into interactive visual reports.
Instead of manually reviewing multiple files, facility managers can quickly:
-
Track monthly lease expenses
-
Monitor escalation trends
-
Evaluate facility utilization
-
Compare departments and regions
-
Identify cost-saving opportunities
Moreover, because the dashboard runs in Excel, teams can easily customize it according to their business needs.
Why Do Organizations Need a Facilities Leasing Dashboard?
Many companies manage dozens or even hundreds of leased facilities. However, without a centralized system, they face several challenges.
Common Problems Without a Dashboard
-
Lease costs increase without early warning
-
Escalation clauses remain unmonitored
-
Downtime impacts stay hidden
-
Department-wise expenses lack clarity
-
Regional comparisons become difficult
-
Manual reporting consumes too much time
Therefore, organizations need a smarter and faster solution.
How This Dashboard Solves the Problem
The Facilities Leasing Dashboard in Excel:
-
Centralizes all lease data
-
Automates monthly analysis
-
Highlights high-cost areas
-
Improves decision-making speed
-
Reduces manual effort
-
Enhances financial control
As a result, facility teams move from reactive management to proactive optimization.
Key Features of the Facilities Leasing Dashboard in Excel
This ready-to-use Excel dashboard includes powerful interactive components. Additionally, it follows a clean and professional layout.
⭐ Page Navigator (Left Side)
The dashboard includes a Page Navigator located on the left side. This feature allows users to switch between analytical pages instantly.
Benefits:
-
Smooth navigation
-
User-friendly experience
-
Professional dashboard feel
-
Faster analysis workflow
Because of this design, even non-technical users can operate the dashboard easily.
How Many Pages Are Available in the Dashboard?
The Excel dashboard contains 5 analytical pages, plus supporting sheets:
-
Overview Page
-
Facility Type Analysis
-
Department Analysis
-
Region Analysis
-
Month Analysis
-
Support Sheet
-
Data Sheet
Now, let us understand each page in detail.
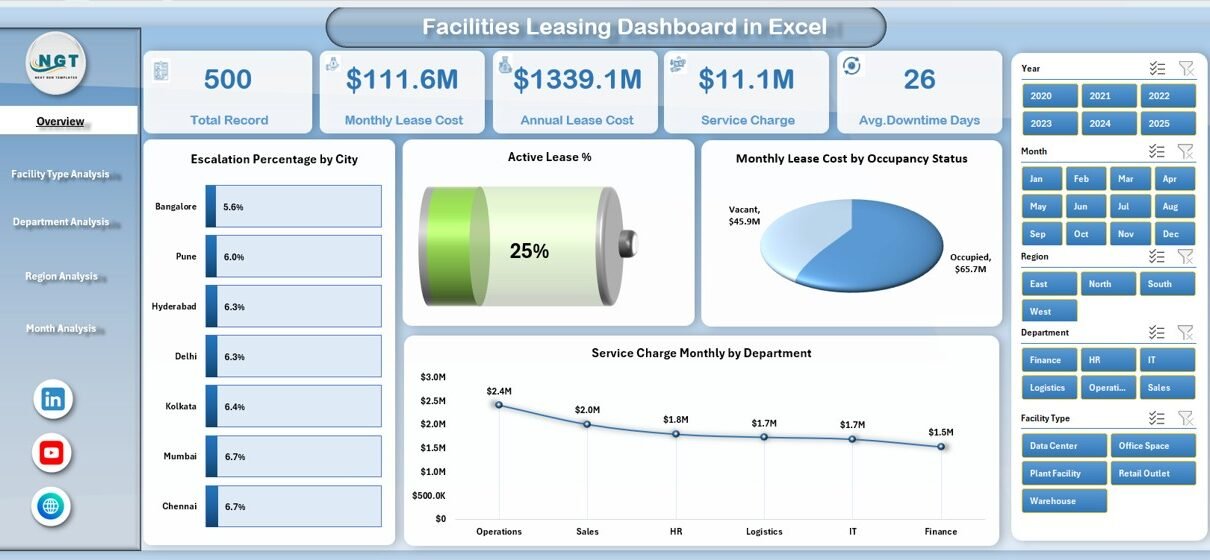
📊 Overview Page: The Executive Summary
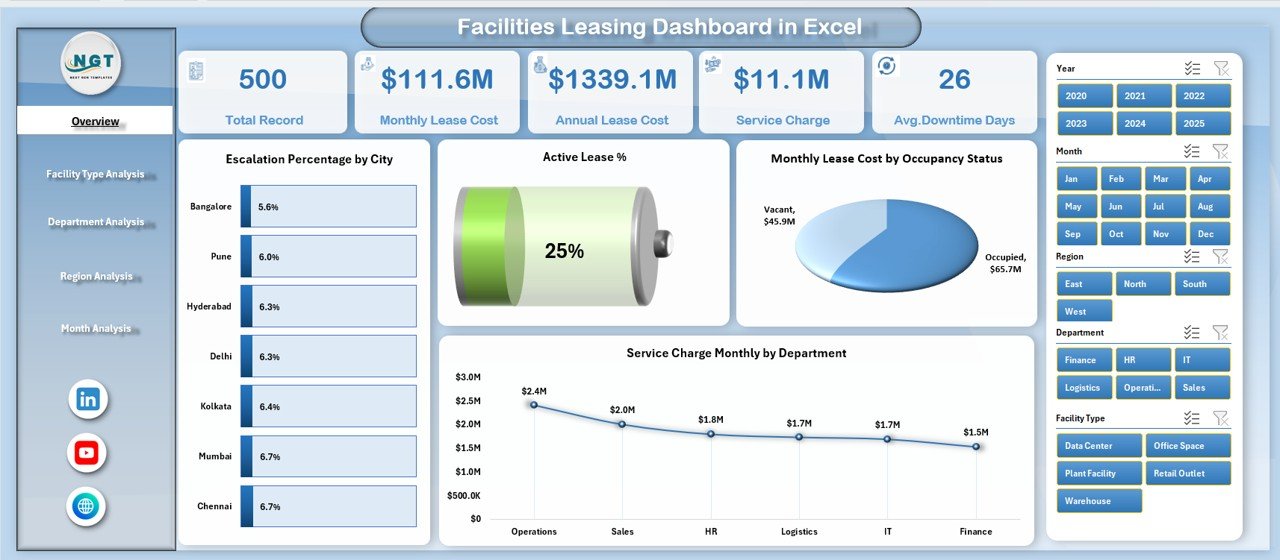
The Overview Page serves as the main control center of the dashboard. It provides a high-level snapshot of facility leasing performance.
What Does the Overview Page Contain?
🔹 Right-Side Slicer
Users can filter the entire dashboard dynamically. Therefore, decision-makers can focus on specific time periods or categories.
🔹 Four KPI Cards
These cards provide instant performance insights.
🔹 Four Interactive Charts
The page includes the following visuals:
-
Escalation % by City
-
Active Lease %
-
Monthly Lease Cost by Occupancy Status
-
Service Charge Monthly by Department
Why This Page Matters
Because executives need quick insights, this page delivers:
-
Instant cost visibility
-
Occupancy health check
-
Escalation trend monitoring
-
Departmental service charge comparison
As a result, leadership can take faster strategic decisions.
Click to Purchases Facilities Leasing Dashboard in Excel
🏢 Facility Type Analysis: Where Do Costs Concentrate?
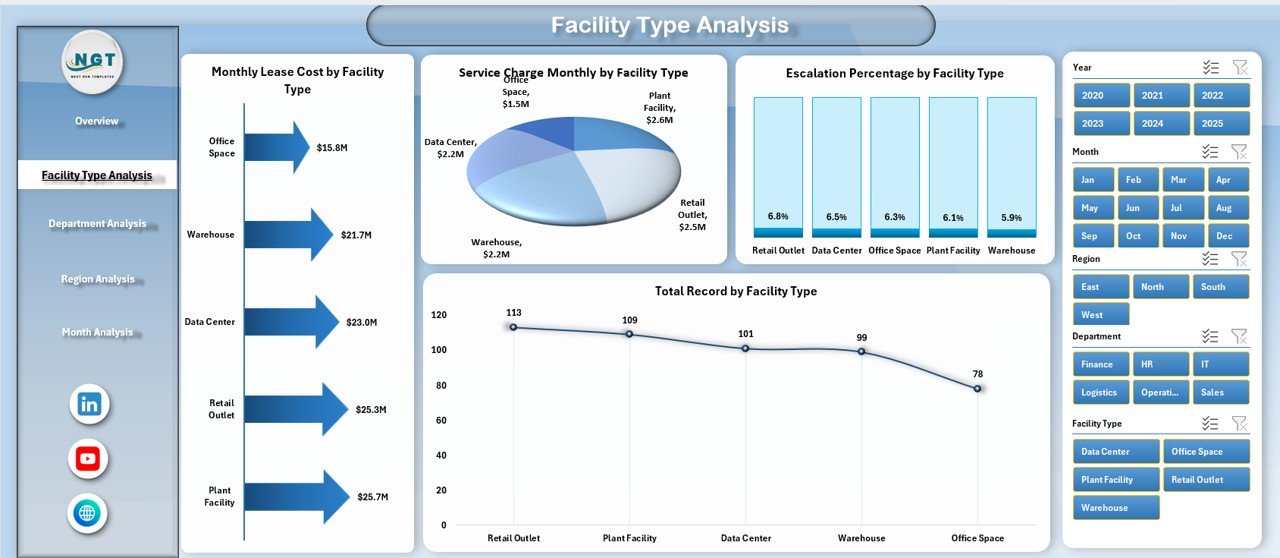
The Facility Type Analysis page helps organizations understand how different facility categories perform.
Charts Available on This Page
-
Escalation % by Facility Type
-
Monthly Lease Cost by Facility Type
-
Service Charge Monthly by Facility Type
-
Total Record by Facility Type
What Insights Can You Extract?
Using this page, you can:
-
Identify expensive facility types
-
Compare escalation patterns
-
Evaluate service charge distribution
-
Monitor facility portfolio mix
Therefore, facility planners can optimize the property mix more effectively.
👥 Department Analysis: Who Drives the Highest Cost?
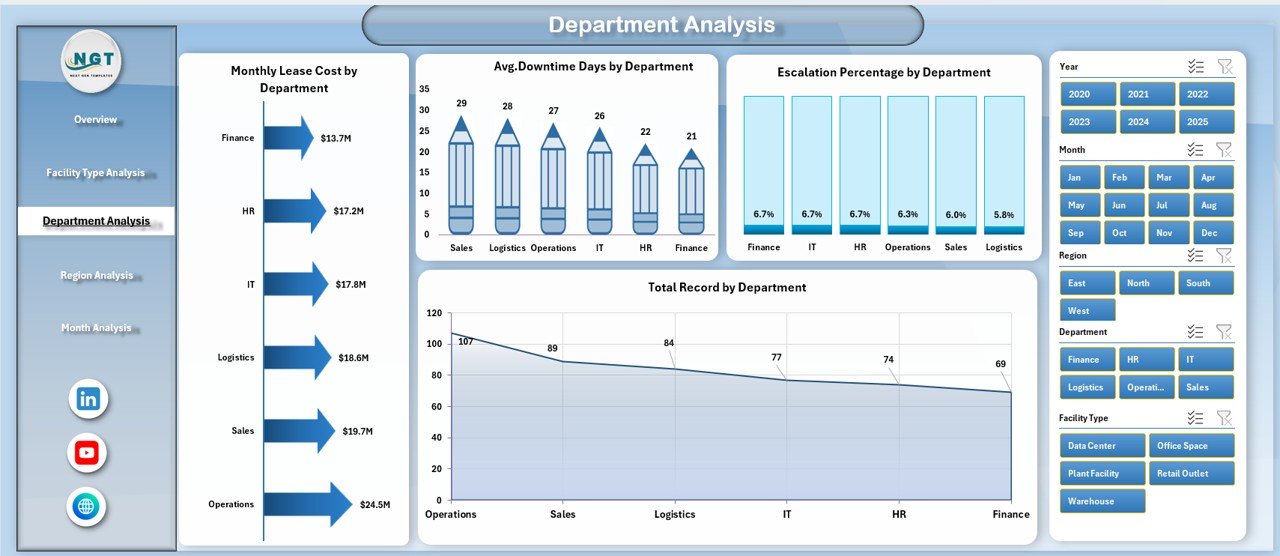
The Department Analysis page focuses on internal cost allocation. It shows how different departments utilize leased facilities.
Visuals Included
-
Escalation % by Department
-
Monthly Lease Cost by Department
-
Avg. Downtime Days by Department
-
Total Record by Department
Why This Page Is Powerful
Because cost accountability matters, this page helps you:
-
Detect high-cost departments
-
Monitor downtime impact
-
Improve space allocation
-
Support internal chargeback models
Consequently, finance and facility teams can work together more efficiently.
🌍 Region Analysis: How Do Locations Compare?
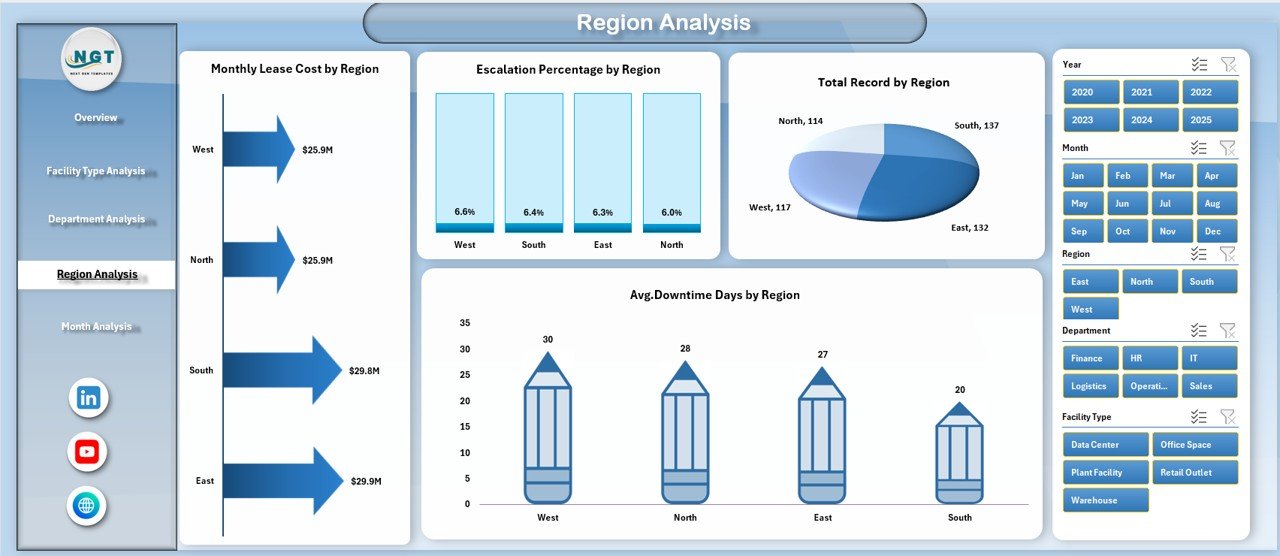
The Region Analysis page provides geographic visibility into facility performance.
Charts on This Page
-
Escalation % by Region
-
Monthly Lease Cost by Region
-
Avg. Downtime Days by Region
-
Total Record by Region
Key Business Benefits
With this analysis, organizations can:
-
Compare regional cost efficiency
-
Identify high-risk locations
-
Monitor downtime trends
-
Support regional budgeting
Therefore, companies with multi-location operations gain strong strategic visibility.
📅 Month Analysis: How Do Costs Trend Over Time?
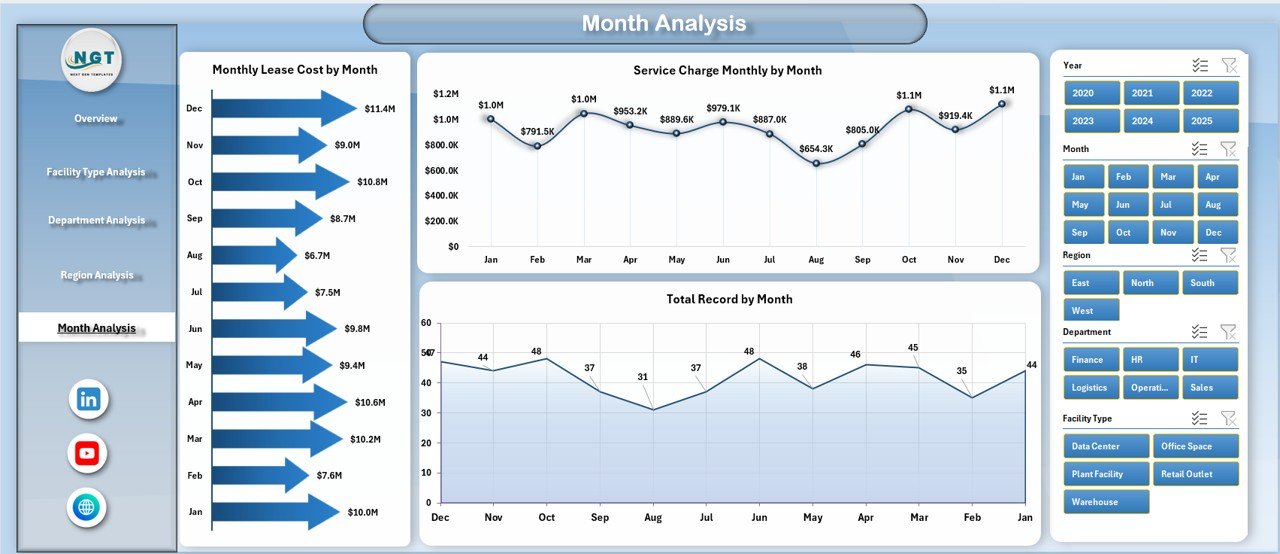
The Month Analysis page focuses on time-based performance. It helps users track trends across months.
Visuals Available
-
Monthly Lease Cost by Month
-
Total Record by Month
-
Service Charge Monthly by Month
Why Monthly Tracking Matters
Because facility costs change frequently, this page enables:
-
Trend analysis
-
Seasonal pattern detection
-
Budget monitoring
-
Forecast preparation
As a result, finance teams can plan more accurately.
📂 Support Sheet: The Engine Behind the Dashboard
The Support Sheet works in the background. Although users rarely interact with it directly, it plays a critical role.
Purpose of the Support Sheet
-
Stores intermediate calculations
-
Supports pivot tables
-
Maintains helper formulas
-
Improves dashboard performance
Therefore, the dashboard runs smoothly and efficiently.
🗄️ Data Sheet: The Single Source of Truth
Click to Purchases Facilities Leasing Dashboard in Excel
The Data Sheet contains the raw leasing data. Every chart and KPI pulls information from this structured table.
Typical Fields in the Data Sheet
-
Facility ID
-
Facility Type
-
Department
-
Region
-
City
-
Occupancy Status
-
Monthly Lease Cost
-
Service Charge
-
Escalation %
-
Downtime Days
-
Lease Status
-
Month
Because the data follows a clean tabular format, users can easily update it monthly.
Advantages of Facilities Leasing Dashboard in Excel
Implementing this dashboard brings significant operational and financial benefits.
🚀 Improved Cost Visibility
-
Track lease expenses instantly
-
Monitor service charges clearly
-
Detect cost spikes early
-
Support budget control
⚡ Faster Decision-Making
-
Real-time visual insights
-
Interactive filtering
-
Executive-ready reports
-
Reduced manual analysis
📉 Better Risk Management
-
Monitor escalation trends
-
Identify high-downtime facilities
-
Compare regional risks
-
Improve lease negotiations
🧭 Enhanced Operational Control
Click to Purchases Facilities Leasing Dashboard in Excel
-
Department-wise tracking
-
Facility type comparison
-
Monthly performance review
-
Occupancy monitoring
💰 Significant Time Savings
-
Automated reporting
-
No manual consolidation
-
Ready-to-use visuals
-
Quick monthly updates
Best Practices for the Facilities Leasing Dashboard in Excel
To get maximum value from the dashboard, follow these proven best practices.
✅ Keep Your Data Clean
Always ensure:
-
No blank rows
-
No merged cells
-
Consistent naming
-
Correct date formats
Clean data guarantees accurate insights.
✅ Update Data Monthly
You should refresh the data regularly. Otherwise, insights become outdated.
Recommended routine:
-
Upload latest lease data
-
Refresh pivot tables
-
Validate key KPIs
-
Review trend changes
Consistency drives better decisions.
✅ Use Slicers Strategically
Instead of viewing all data at once, apply filters wisely.
For example:
-
Filter by region for regional review
-
Filter by department for cost control
-
Filter by month for trend analysis
This approach improves focus and clarity.
✅ Monitor Escalation Closely
Escalation clauses directly impact long-term costs. Therefore, always:
-
Track high escalation locations
-
Review renewal terms early
-
Compare against budget
-
Flag abnormal increases
Proactive monitoring saves money.
✅ Review Downtime Regularly
Downtime often hides operational inefficiencies.
You should:
-
Investigate high downtime departments
-
Compare regions
-
Identify root causes
-
Take corrective action
This step improves facility utilization.
✅ Customize Based on Business Needs
Because every organization differs, you can enhance the dashboard by adding:
-
Lease expiry alerts
-
Renewal trackers
-
Budget vs actual analysis
-
Forecast models
Customization increases long-term value.
Who Should Use the Facilities Leasing Dashboard?
Click to Purchases Facilities Leasing Dashboard in Excel
This dashboard serves a wide range of professionals.
Ideal Users
-
Facility Managers
-
Corporate Real Estate Teams
-
Finance Managers
-
Operations Heads
-
Admin Departments
-
Infrastructure Teams
If your organization manages leased properties, this tool becomes extremely valuable.
Conclusion: Take Control of Your Facility Leasing Today
Managing facility leases without a structured system creates unnecessary risk and cost leakage. However, with the Facilities Leasing Dashboard in Excel, organizations gain complete visibility into their leasing portfolio.
Throughout this guide, you discovered how the dashboard:
-
Centralizes lease data
-
Tracks escalation trends
-
Monitors downtime
-
Compares departments and regions
-
Supports smarter financial decisions
Moreover, because the dashboard runs in Excel, implementation remains simple and cost-effective.
If you want better control, faster insights, and smarter facility decisions, this dashboard provides the perfect solution.
Frequently Asked Questions with Answers
❓ What is a Facilities Leasing Dashboard in Excel?
It is an interactive Excel-based reporting tool that tracks lease costs, escalation percentages, service charges, and facility performance in one centralized view.
❓ Can beginners use this dashboard?
Yes. The dashboard uses simple Excel features like slicers and pivot charts. Therefore, even non-technical users can operate it easily.
❓ How often should I update the data?
You should update the data monthly. Regular updates ensure accurate trend analysis and better decision-making.
❓ Can I customize the dashboard?
Absolutely. You can add new KPIs, filters, charts, or calculations based on your organization’s requirements.
❓ Does this dashboard support multiple locations?
Yes. The dashboard includes region and city analysis. Therefore, it works perfectly for multi-location organizations.
❓ What Excel skills are required?
Basic Excel knowledge is enough. However, familiarity with pivot tables and slicers will help you use the dashboard more effectively.
Visit our YouTube channel to learn step-by-step video tutorials