Product development drives growth. However, without proper measurement, even great ideas can fail to deliver results. Many teams focus heavily on innovation but struggle to track timelines, efficiency, and success rates.
Therefore, you need a structured performance system.
More importantly, you need real-time visibility into your development KPIs.
That is exactly why the Product Development KPI Scorecard in Excel becomes essential.
This ready-to-use Excel template helps product managers, R&D teams, and business leaders monitor performance, compare targets, and improve delivery efficiency — all in one dynamic scorecard.
In this detailed guide, you will learn:
-
What a Product Development KPI Scorecard in Excel is
-
Why product teams need KPI tracking
-
Detailed explanation of all 4 worksheets
-
Important KPIs for product development
-
Advantages of the Product Development KPI Scorecard
-
Best Practices for the Product Development KPI Scorecard
-
Frequently Asked Questions with Answers
Let us explore everything step by step.
Click to Purchases Product Development KPI Scorecard in Excel
What Is a Product Development KPI Scorecard in Excel?
A Product Development KPI Scorecard in Excel is a structured performance tracking tool designed to measure the effectiveness of product development activities.
Instead of relying on scattered reports, you can:
-
Monitor development speed
-
Track project success rates
-
Compare Actual vs Target
-
Review Month-to-Date (MTD) and Year-to-Date (YTD) performance
-
Analyze historical trends
Because Excel provides automation and visual indicators, the scorecard transforms raw data into actionable insights.
As a result, teams make faster and smarter decisions.
Why Do Product Teams Need a KPI Scorecard?
Product development involves multiple moving parts. Without measurement, delays and inefficiencies remain hidden.
Without a KPI scorecard:
-
Projects may miss deadlines
-
Costs may exceed budgets
-
Product quality may decline
-
Team productivity may drop
-
Management lacks visibility
However, when you implement a KPI scorecard:
-
You monitor progress clearly
-
You identify bottlenecks early
-
You improve accountability
-
You optimize resource allocation
Therefore, the scorecard becomes a strategic management tool.
Click to Purchases Product Development KPI Scorecard in Excel
Overview of Worksheets in the Product Development KPI Scorecard
This ready-to-use template contains 4 powerful worksheets:
1️⃣ Scorecard Sheet
2️⃣ KPI Trend Sheet
3️⃣ Input Data Sheet
4️⃣ KPI Definition Sheet
Each sheet plays a specific role in performance monitoring.
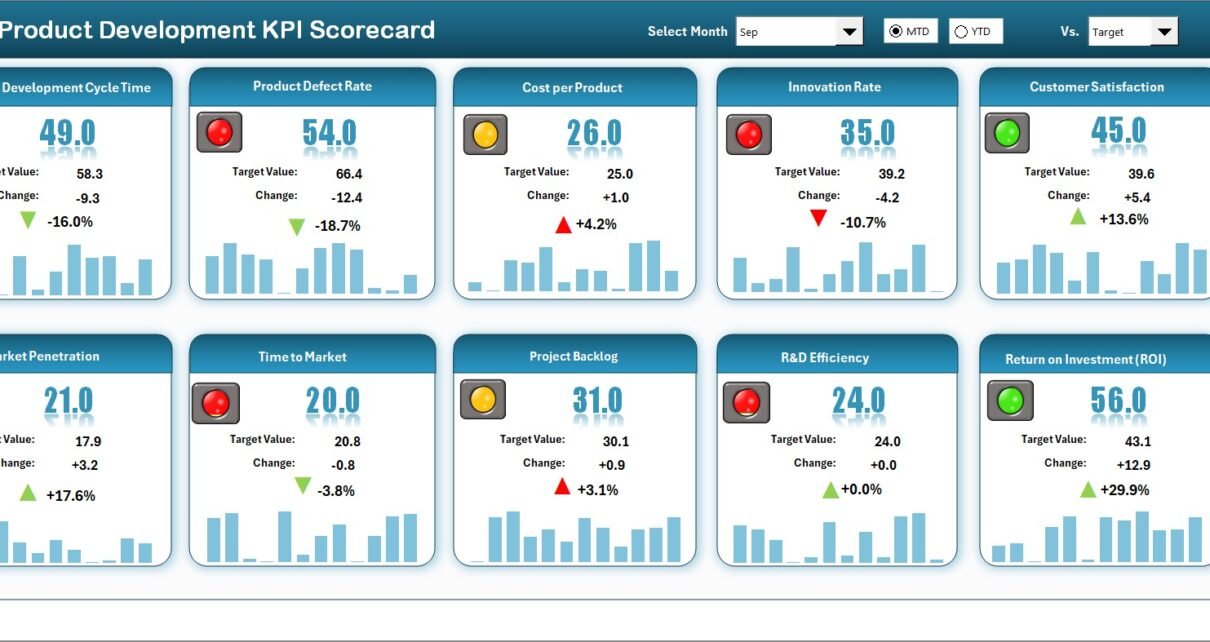
1️⃣ Scorecard Sheet – The Main Performance Dashboard
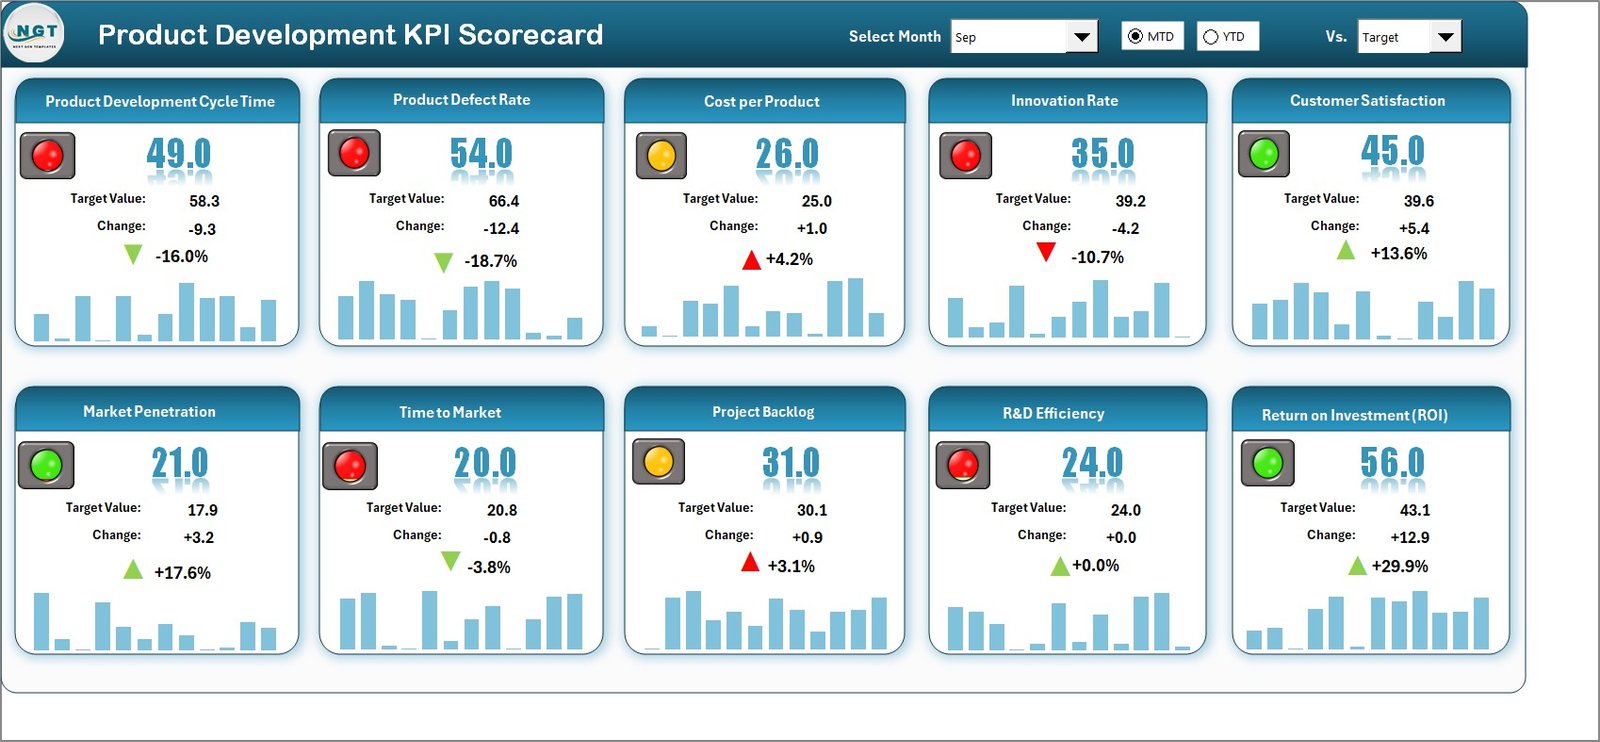
The Scorecard sheet acts as the central performance view.
Here, you can quickly evaluate how your product development function performs.
🔹 Key Features of the Scorecard
✅ Dropdown Menus
You can select:
-
Month
-
MTD (Month-to-Date)
-
YTD (Year-to-Date)
Because of these dropdowns, the dashboard updates instantly. Therefore, analysis becomes fast and flexible.
✅ Actual vs Target Comparison
The scorecard clearly compares:
-
Actual performance
-
Target performance
This comparison helps leadership understand whether the team meets expectations.
✅ Visual Indicators
The template uses color-coded conditional formatting.
For example:
-
Green indicators show good performance
-
Red indicators highlight areas needing attention
Because of these visuals, decision-makers identify issues quickly.
✅ Comprehensive KPI Overview
The scorecard displays complete KPI information, including:
-
KPI performance status
-
MTD comparison
-
YTD comparison
Therefore, you get a full performance snapshot in one screen.
Click to Purchases Product Development KPI Scorecard in Excel
2️⃣ KPI Trend Sheet – Deep Performance Analysis
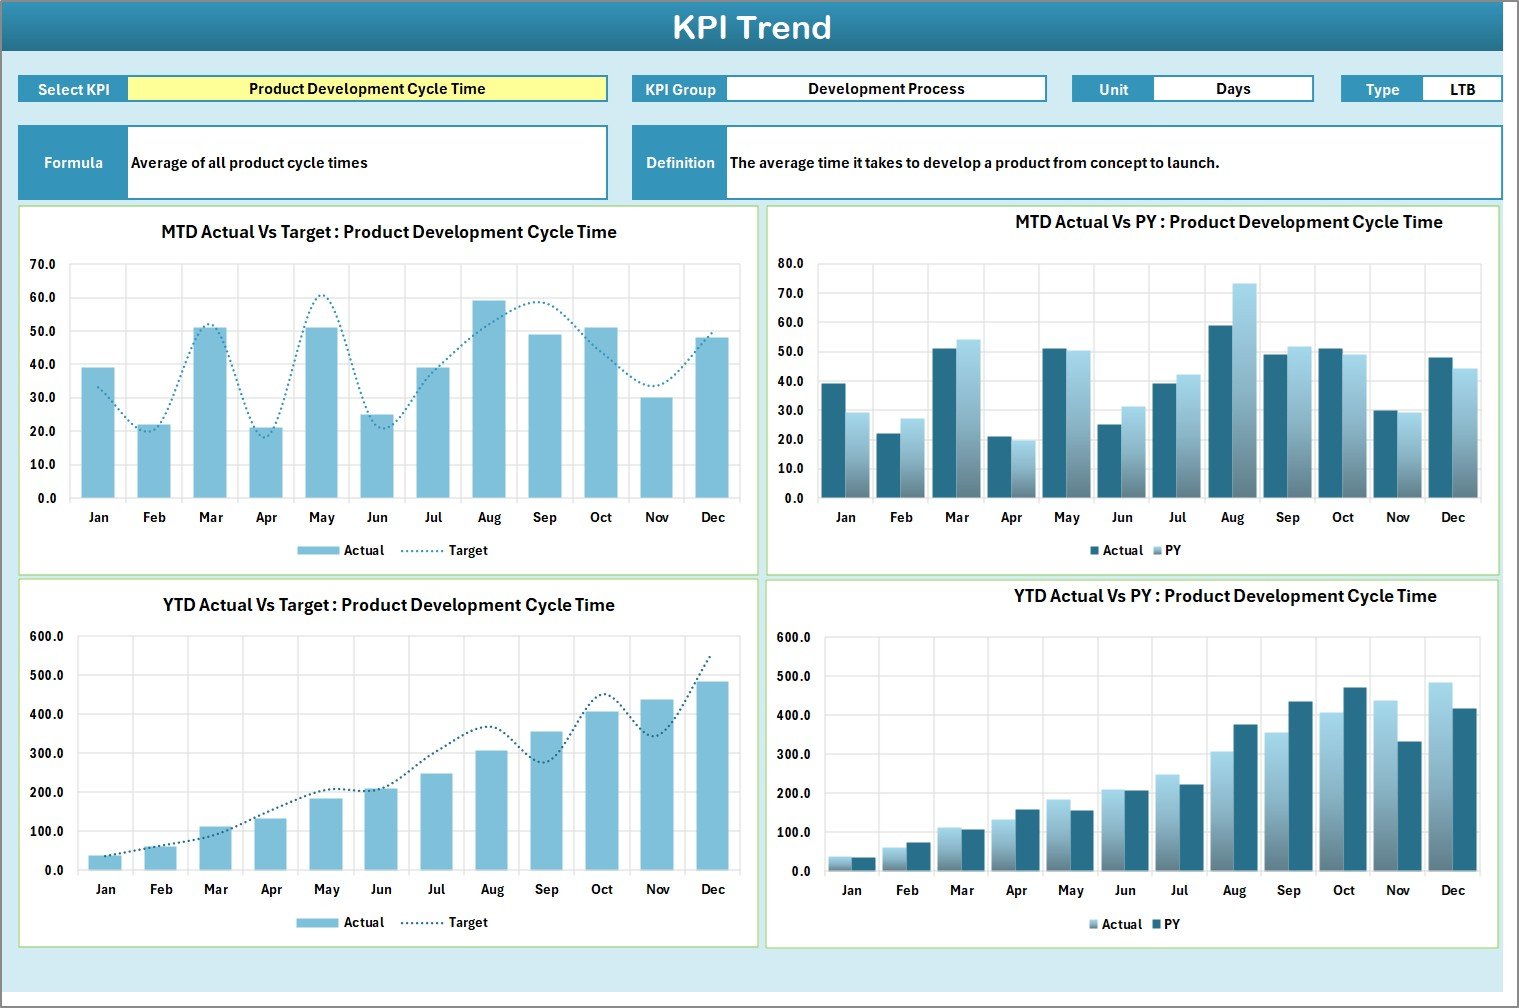
The KPI Trend sheet provides detailed analysis for individual KPIs.
🔹 KPI Selection
On range C3, you can select any KPI from the dropdown.
Once selected, the sheet displays:
-
KPI Group
-
Unit of KPI
-
Type (LTB or UTB)
-
Formula
-
KPI Definition
Because of this structure, users always understand what each KPI measures.
🔹 Trend Charts
The sheet includes two dynamic charts:
-
MTD Trend Chart
-
YTD Trend Chart
Each chart compares:
-
Actual
-
Target
-
Previous Year (PY)
Therefore, you can:
-
Identify trends
-
Detect performance dips
-
Evaluate consistency
-
Monitor long-term improvement
3️⃣ Input Data Sheet – The Data Entry Engine
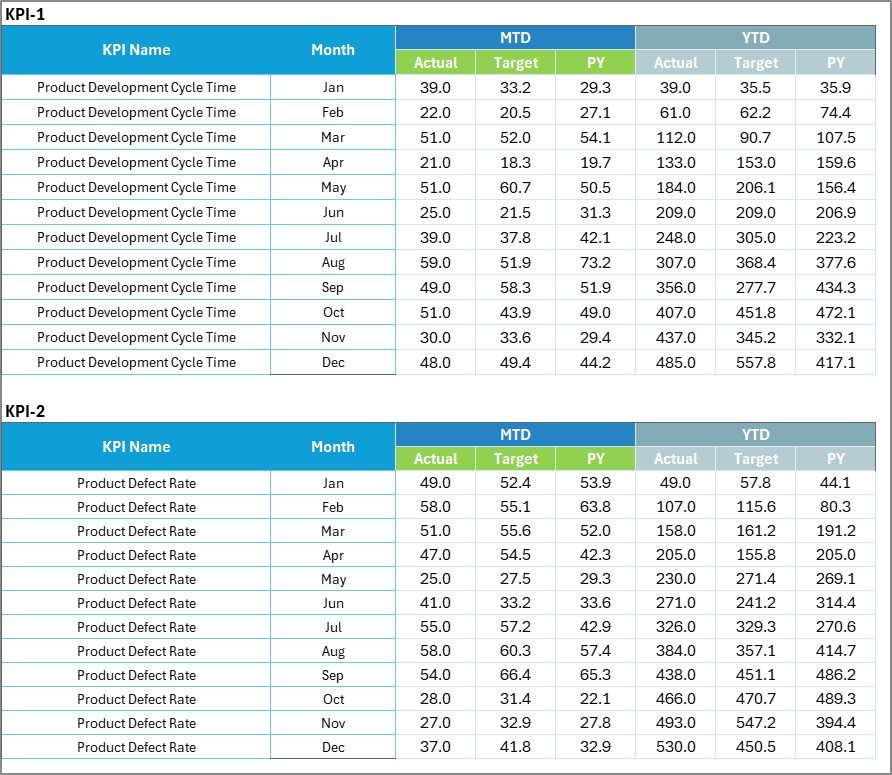
The Input Data sheet is where you enter all KPI values.
🔹 Data Entry Features
Here you can record:
-
Actual values
-
Target values
-
Monthly data
Because the sheet uses structured formatting, updates remain simple and reliable.
🔹 Flexibility
You can easily update the data whenever new results become available. As a result, the scorecard always reflects the latest performance.
Click to Purchases Product Development KPI Scorecard in Excel
4️⃣ KPI Definition Sheet – The KPI Knowledge Base
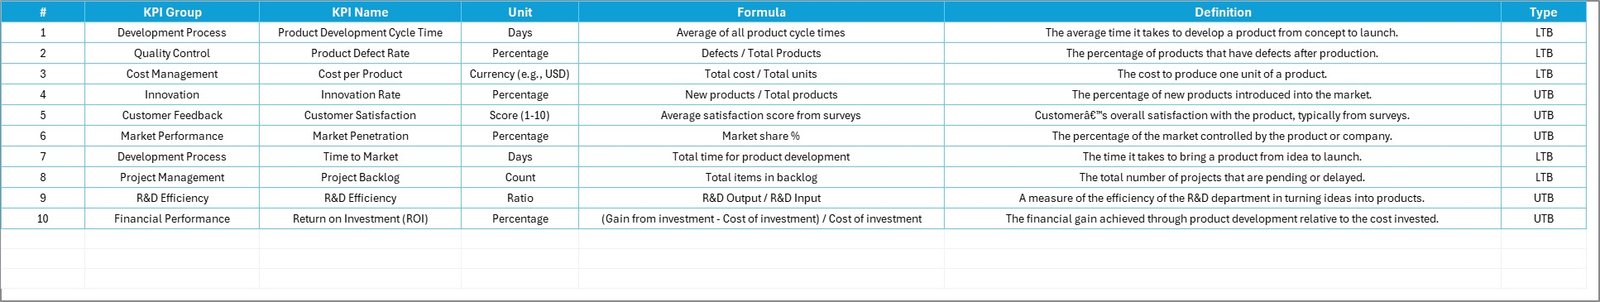
This sheet stores the core KPI information.
You must enter:
-
KPI Name
-
KPI Group
-
Unit
-
Formula
-
KPI Definition
Because of this centralized definition table, KPI understanding remains consistent across teams.
Important KPIs for Product Development Teams
To maximize value, product teams should track meaningful KPIs.
🔹 Innovation KPIs
-
New Product Development Cycle Time
-
Time to Market
-
R&D Productivity
-
Idea Conversion Rate
-
Feature Delivery Rate
🔹 Quality KPIs
-
Defect Density
-
First Pass Yield
-
Product Reliability Score
-
Bug Fix Rate
🔹 Financial KPIs
-
Development Cost Variance
-
ROI on New Products
-
Budget Utilization %
-
Cost per Feature
🔹 Process KPIs
-
Sprint Velocity
-
On-Time Project Delivery %
-
Resource Utilization
-
Change Request Rate
Tracking these KPIs improves both speed and quality.
Click to Purchases Product Development KPI Scorecard in Excel
Advantages of Product Development KPI Scorecard in Excel
Now let us review the major benefits.
✅ 1. Centralized Performance Monitoring
You track all development KPIs in one structured file.
✅ 2. Faster Decision Making
Because visual indicators highlight issues, teams act quickly.
✅ 3. Improved Accountability
Actual vs Target comparison creates performance ownership.
✅ 4. Trend Visibility
MTD and YTD charts reveal long-term patterns.
✅ 5. Easy Customization
You can add or modify KPIs easily in Excel.
✅ 6. Cost-Effective Solution
Excel eliminates the need for expensive BI tools.
✅ 7. Professional Reporting
The scorecard creates executive-ready performance views.
How Does This Scorecard Improve Product Success?
When teams track KPIs consistently:
-
They reduce development delays
-
They improve product quality
-
They optimize resource usage
-
They control development costs
-
They accelerate time to market
Because of these improvements, product success rates increase significantly.
Click to Purchases Product Development KPI Scorecard in Excel
Best Practices for the Product Development KPI Scorecard
To get maximum value, follow these best practices.
🔹 1. Update Data Regularly
Enter new KPI data monthly to keep the dashboard accurate.
🔹 2. Define KPIs Clearly
Always maintain clear formulas and definitions.
🔹 3. Set Realistic Targets
Base targets on historical performance and team capacity.
🔹 4. Review Trends, Not Just Snapshots
Always analyze MTD and YTD trends together.
🔹 5. Focus on Actionable Metrics
Track KPIs that directly impact delivery speed and quality.
🔹 6. Train Stakeholders
Ensure managers and team members understand the scorecard.
Who Should Use This Template?
This scorecard is ideal for:
-
Product Managers
-
R&D Teams
-
Engineering Leaders
-
PMO Teams
-
Startup Founders
-
Technology Companies
-
Manufacturing Product Teams
If your organization builds products, this template becomes highly valuable.
Conclusion: Drive Product Excellence with Data
Product development requires speed, quality, and control. Without measurement, improvement becomes difficult.
The Product Development KPI Scorecard in Excel provides:
-
Clear performance visibility
-
Target comparison
-
Trend analysis
-
Structured KPI management
Therefore, teams move from guesswork to data-driven execution.
When you implement this scorecard consistently, you accelerate innovation, improve delivery reliability, and build stronger products.
Click to Purchases Product Development KPI Scorecard in Excel
Frequently Asked Questions (FAQs)
❓ What is the main purpose of the Product Development KPI Scorecard?
It helps teams monitor development performance, compare targets, and track trends in one Excel dashboard.
❓ Can I customize the KPIs?
Yes. You can easily modify the KPI Definition sheet.
❓ How often should I update the data?
You should update the Input Data sheet monthly or whenever new results arrive.
❓ What does LTB and UTB mean?
LTB means Lower the Better.
UTB means Upper the Better.
❓ Is this template suitable for startups?
Yes. It works perfectly for both startups and large enterprises.
Click to Purchases Product Development KPI Scorecard in Excel
Visit our YouTube channel to learn step-by-step video tutorials