Running a tattoo studio today requires more than artistic talent. You also need strong business visibility. Without clear performance tracking, many tattoo parlors struggle to monitor bookings, revenue, artist productivity, and customer trends.
Therefore, studio owners must rely on data-driven insights.
That is exactly where the Tattoo Parlors KPI Dashboard in Power BI becomes powerful.
Click to Purchases Tattoo Parlors KPI Dashboard in Power BI
This ready-to-use dashboard helps tattoo studio owners, managers, and analysts monitor key performance indicators in one interactive view. Moreover, it transforms raw Excel data into meaningful insights that support faster and smarter decisions.
In this comprehensive guide, you will learn:
-
What the Tattoo Parlors KPI Dashboard in Power BI is
-
Why tattoo studios need KPI tracking
-
Detailed explanation of all dashboard pages
-
Advantages of the dashboard
-
Best practices for implementation
-
Frequently asked questions
Let us explore everything step by step.
What Is a Tattoo Parlors KPI Dashboard in Power BI?
A Tattoo Parlors KPI Dashboard in Power BI is an interactive business intelligence tool designed to track and analyze the performance of tattoo studios using key metrics.
Instead of working with scattered spreadsheets, this dashboard consolidates all KPI data into one centralized visual platform. As a result, studio owners can instantly evaluate performance trends.
Most importantly, the dashboard connects with Excel data sources. Therefore, users can easily update numbers without changing the Power BI design.
Key Purpose of the Dashboard
-
Monitor studio performance in real time
-
Compare actual vs target KPIs
-
Track monthly and yearly progress
-
Identify underperforming areas quickly
-
Support data-driven business decisions
Because of these capabilities, tattoo businesses gain full operational clarity.
Why Do Tattoo Parlors Need KPI Tracking?
Tattoo studios operate in a highly competitive market. However, many owners still rely on manual tracking. Consequently, they miss important growth signals.
With proper KPI monitoring, studios can:
-
Improve artist productivity
-
Increase appointment conversion
-
Control operational costs
-
Enhance customer satisfaction
-
Boost overall profitability
Moreover, Power BI dashboards eliminate guesswork. Instead, they provide clear visual signals.
Common Challenges Without KPI Dashboards
-
Scattered performance data
-
Delayed monthly reporting
-
No real-time visibility
-
Difficulty tracking targets
-
Poor decision support
Therefore, implementing a KPI dashboard becomes essential for modern tattoo businesses.
Key Features of Tattoo Parlors KPI Dashboard in Power BI
This dashboard comes with three powerful analytical pages in the Power BI Desktop file. Each page serves a specific business purpose.
Let us understand them in detail.
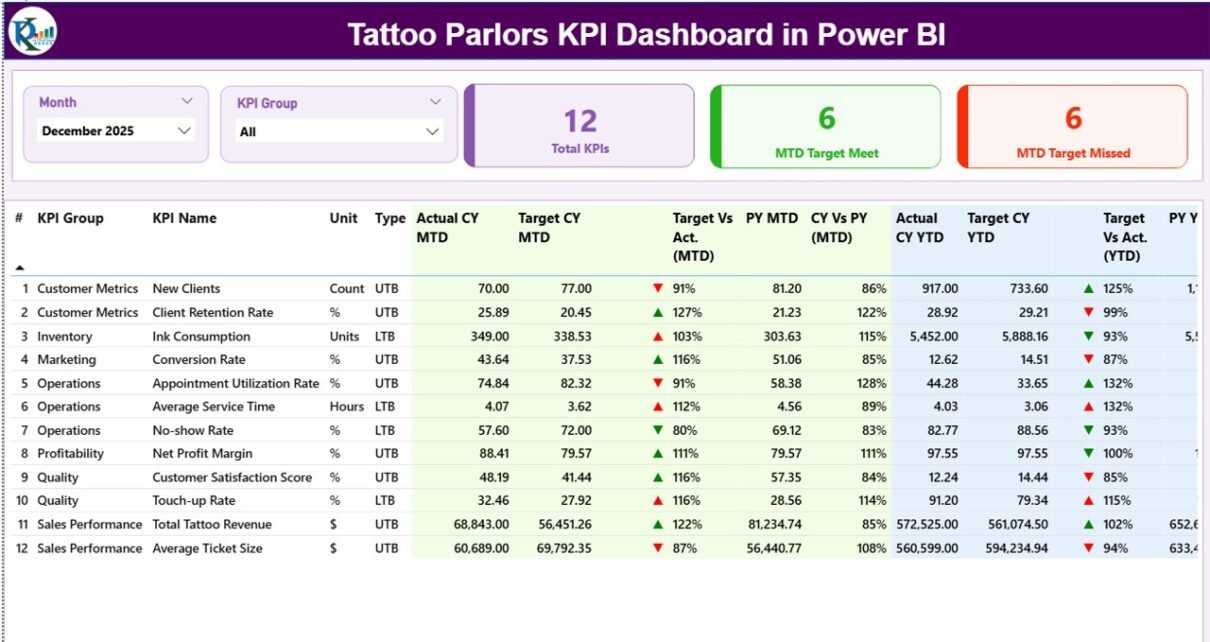
1️⃣ Summary Page — The Main Performance Control Center

The Summary Page acts as the primary monitoring screen. Here, users can quickly review overall KPI performance.
Top Slicers
At the top of the page, you will find:
-
Month slicer
-
KPI Group slicer
These filters allow users to analyze performance dynamically. For example, you can instantly switch between months.
KPI Cards
The dashboard displays three important cards:
-
Total KPIs Count — shows total tracked KPIs
-
MTD Target Meet Count — shows KPIs meeting targets
-
MTD Target Missed Count — shows KPIs below target
Because of these cards, managers get a quick performance snapshot.
Detailed KPI Performance Table
Below the cards, the dashboard presents a structured KPI table containing:
KPI Identification Fields
-
KPI Number — sequence of the KPI
-
KPI Group — category of the KPI
-
KPI Name — specific metric name
-
Unit — measurement unit
-
Type — UTB (Upper the Better) or LTB (Lower the Better)
These fields help users clearly understand each metric.
Click to Purchases Tattoo Parlors KPI Dashboard in Power BI
MTD (Month-to-Date) Performance Metrics
The dashboard provides detailed MTD tracking.
Actual CY MTD
Shows current year actual MTD value.
Target CY MTD
Displays target MTD value.
MTD Icon
Visual indicator using:
-
▲ Green = performing well
-
▼ Red = underperforming
Because of these icons, users quickly spot issues.
Target vs Actual (MTD)
Calculated using:
Actual MTD ÷ Target MTD
This percentage shows how close performance is to the target.
PY MTD
Previous year MTD value for comparison.
CY vs PY (MTD)
Calculated using:
Current Year MTD ÷ Previous Year MTD
This metric highlights year-over-year growth.
YTD (Year-to-Date) Performance Metrics
Similarly, the dashboard tracks yearly progress.
Actual CY YTD
Current year cumulative performance.
Target CY YTD
Yearly target value.
YTD Icon
Visual status indicator using arrows and colors.
Target vs Actual (YTD)
Calculated using:
Actual YTD ÷ Target YTD
PY YTD
Previous year YTD number.
CY vs PY (YTD)
Year-over-year comparison.
Because of these metrics, studios can monitor long-term growth.
2️⃣ KPI Trend Page — Visual Performance Analysis
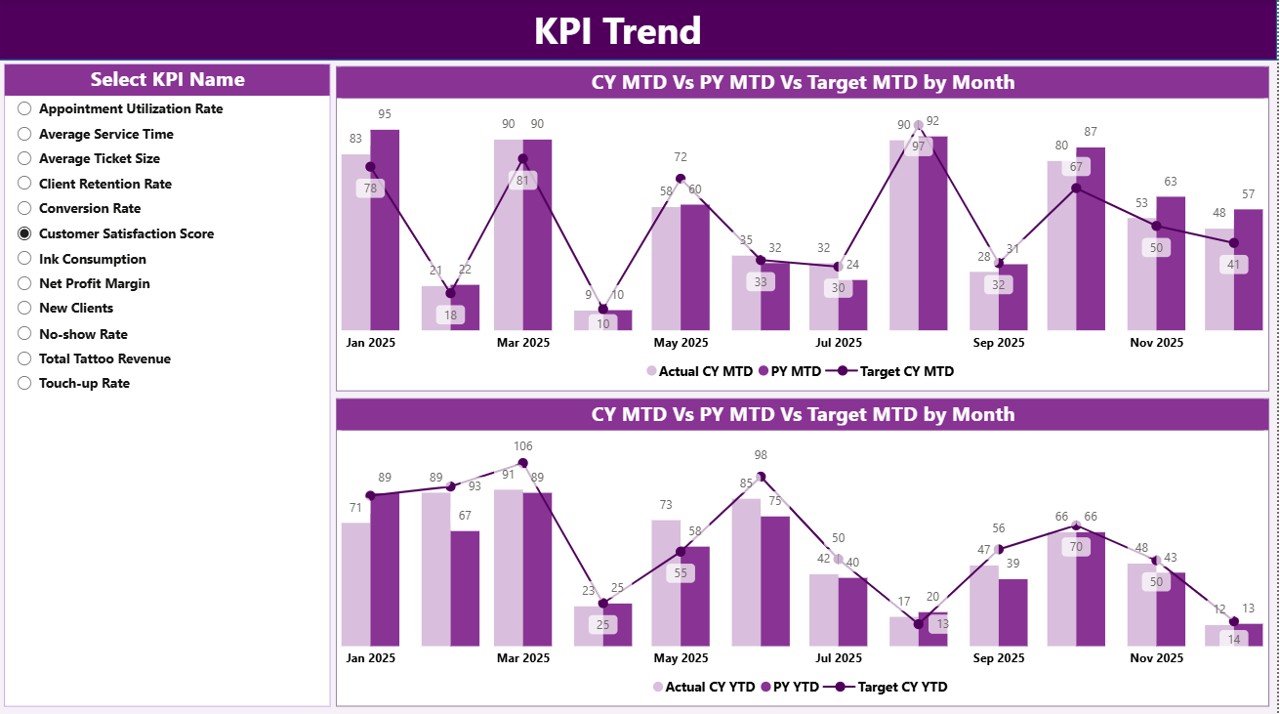
While the summary page shows status, the KPI Trend Page reveals patterns.
This page contains two powerful combo charts.
What the Trend Page Shows
-
Current Year Actuals
-
Previous Year Actuals
-
Target values
-
MTD and YTD trends
Therefore, users can easily identify growth or decline patterns.
KPI Selection Slicer
On the left side, the dashboard provides a KPI Name slicer.
Using this filter, users can:
-
Focus on a single KPI
-
Compare performance over time
-
Identify seasonal trends
Because of this flexibility, analysis becomes highly interactive.
3️⃣ KPI Definition Page — Drill-Through Intelligence
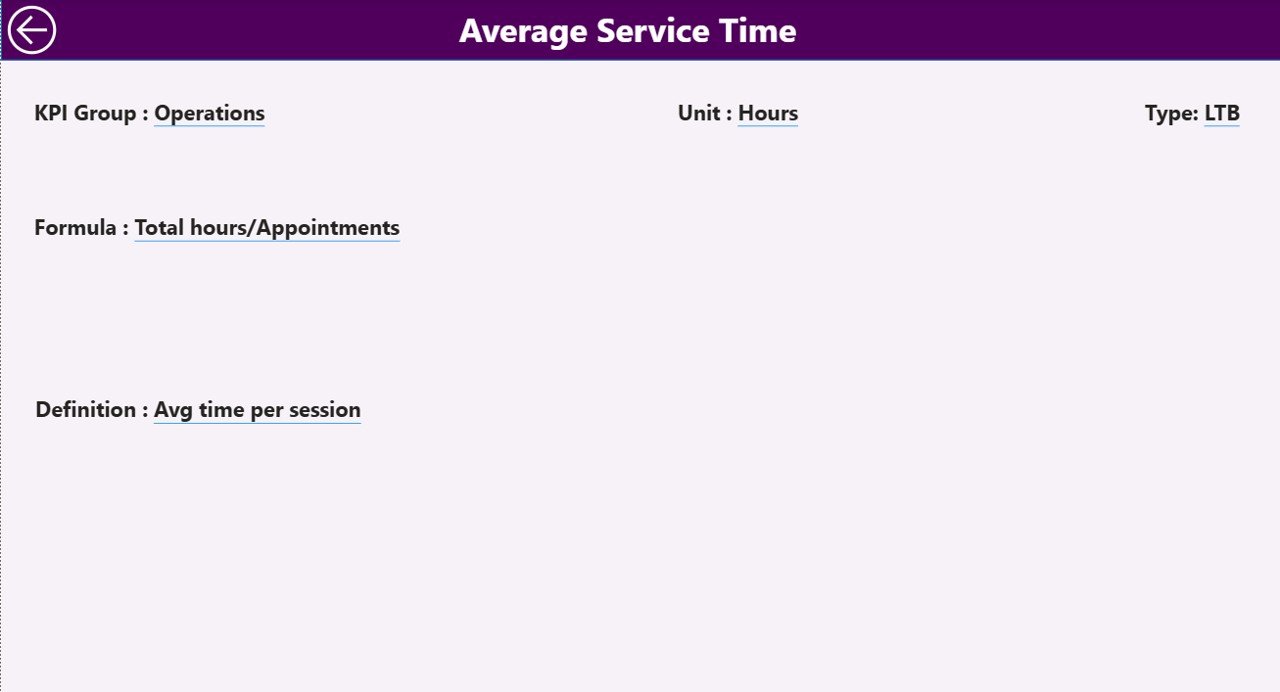
The KPI Definition Page provides deep metric clarity.
This page remains hidden and works through drill-through functionality.
What You Can See Here
When users drill through from the summary page, they can view:
-
KPI Formula
-
KPI Definition
-
KPI Group
-
Measurement Unit
-
KPI Type
Therefore, teams always understand what each KPI means.
Click to Purchases Tattoo Parlors KPI Dashboard in Power BI
Easy Navigation
To return to the main page, simply click the Back button located at the top-left corner.
This ensures smooth user experience.
Excel Data Structure — The Backbone of the Dashboard
The Power BI dashboard connects to an Excel file. Therefore, maintaining proper data structure becomes very important.
The Excel file contains three worksheets.
Let us review them.
1️⃣ Input_Actual Sheet
This sheet stores actual performance data.
Required Columns
-
KPI Name
-
Month (first date of month)
-
MTD Number
-
YTD Number
Important Notes
-
Always use the first date of the month
-
Do not leave blank KPI names
-
Ensure numeric formatting
Because clean data improves accuracy.
2️⃣ Input_Target Sheet
This sheet contains target values.
Required Columns
-
KPI Name
-
Month
-
MTD Target
-
YTD Target
Keeping targets updated ensures correct variance analysis.
3️⃣ KPI Definition Sheet
This sheet defines each KPI.
Required Fields
-
KPI Number
-
KPI Group
-
KPI Name
-
Unit
-
Formula
-
Definition
-
Type (LTB or UTB)
This sheet drives the entire KPI logic.
Advantages of Tattoo Parlors KPI Dashboard in Power BI
Implementing this dashboard delivers powerful business benefits.
✅ Real-Time Performance Visibility
First, the dashboard provides instant KPI status. As a result, managers do not wait for manual reports.
✅ Faster Decision-Making
Because all metrics appear visually, owners can take quick actions.
✅ Improved Artist Productivity Tracking
Studio managers can monitor performance trends easily. Therefore, they can optimize staff allocation.
✅ Target vs Actual Monitoring
The dashboard clearly highlights gaps. Consequently, teams focus on improvement areas.
✅ Year-Over-Year Comparison
With built-in PY comparisons, businesses can measure true growth.
✅ Interactive Filtering
Users can slice data by:
-
Month
-
KPI Group
-
KPI Name
Thus, analysis becomes flexible.
✅ Easy Excel Integration
Since the data comes from Excel, updates remain simple and fast.
✅ Professional Visual Presentation
Power BI visuals enhance reporting quality. Therefore, stakeholders understand performance quickly.
Best Practices for the Tattoo Parlors KPI Dashboard in Power BI
Click to Purchases Tattoo Parlors KPI Dashboard in Power BI
To get maximum value, follow these best practices.
🔹 Keep KPI Definitions Clear
Always write simple KPI definitions. Otherwise, teams may misinterpret metrics.
🔹 Update Excel Data Regularly
Update Actual and Target sheets monthly. Because outdated data leads to wrong insights.
🔹 Use Proper KPI Grouping
Group KPIs logically, such as:
-
Revenue
-
Operations
-
Customer Experience
-
Artist Performance
This improves analysis clarity.
🔹 Monitor Both MTD and YTD
Do not rely only on monthly numbers. Instead, review yearly trends as well.
🔹 Validate Data Before Refresh
Always check Excel data for:
-
Missing values
-
Wrong dates
-
Incorrect formats
Clean data ensures accurate dashboards.
🔹 Train Your Team
Make sure managers understand:
-
UTB vs LTB logic
-
KPI icons
-
Drill-through feature
Proper training improves adoption.
🔹 Review Underperforming KPIs Weekly
Do not wait until month end. Instead, review weak KPIs frequently.
🔹 Maintain Consistent Naming
Keep KPI names consistent across all sheets. Otherwise, Power BI relationships may break.
How Can Tattoo Studios Use This Dashboard Effectively?
Tattoo businesses can apply this dashboard in many ways.
Operational Monitoring
Track daily and monthly performance.
Artist Performance Review
Evaluate individual productivity.
Revenue Optimization
Identify high-earning services.
Marketing Effectiveness
Measure booking conversion trends.
Strategic Planning
Use YTD insights for long-term decisions.
Because of this versatility, the dashboard supports both small and large studios.
Who Should Use the Tattoo Parlors KPI Dashboard?
This dashboard works best for:
-
Tattoo studio owners
-
Studio managers
-
Business analysts
-
Franchise operators
-
Finance teams
Even growing studios can benefit significantly.
Conclusion
Click to Purchases Tattoo Parlors KPI Dashboard in Power BI
The tattoo industry continues to evolve rapidly. Therefore, studios must rely on data rather than guesswork.
The Tattoo Parlors KPI Dashboard in Power BI provides exactly that advantage. It combines structured Excel data with powerful Power BI visuals. As a result, studio owners gain complete performance visibility.
Moreover, the dashboard simplifies target tracking, highlights trends, and supports faster decisions. When teams follow best practices and maintain clean data, the dashboard becomes a powerful growth engine.
If you want to scale your tattoo business with confidence, this KPI dashboard offers the perfect starting point.
Frequently Asked Questions (FAQs)
❓ What is the main purpose of the Tattoo Parlors KPI Dashboard?
The main purpose is to monitor tattoo studio performance using visual KPIs. It helps track actual vs target results and yearly trends.
❓ Do I need Power BI skills to use this dashboard?
No. Basic Power BI knowledge helps, but the dashboard comes ready to use. You mainly need to update the Excel data.
❓ How often should I update the Excel data?
You should update the data monthly. However, weekly updates provide even better insights.
❓ What does UTB and LTB mean?
-
UTB (Upper the Better) — higher values indicate good performance
-
LTB (Lower the Better) — lower values indicate good performance
❓ Can I add more KPIs to the dashboard?
Yes. You can easily add new KPIs in the KPI Definition sheet and update Actual and Target data.
❓ Is this dashboard suitable for multiple tattoo branches?
Yes. With slight data expansion, you can track multiple studio locations.
❓ Why use Power BI instead of only Excel?
Power BI provides:
-
Interactive visuals
-
Better filtering
-
Faster insights
-
Professional dashboards
Therefore, it offers superior business intelligence.
Visit our YouTube channel to learn step-by-step video tutorials