In today’s digital-first world, performance marketing drives measurable growth. However, many marketers still struggle to track campaign effectiveness in one centralized view. As a result, teams often waste time compiling reports instead of optimizing campaigns.Therefore, businesses need a structured and dynamic KPI tracking system. More importantly, they need real-time visibility into campaign performance.
That is exactly where the Performance Marketing KPI Scorecard in Excel becomes a powerful solution.This ready-to-use Excel template helps marketing managers, digital analysts, and business owners monitor key metrics, compare targets, and make faster data-driven decisions. In this comprehensive guide, you will learn everything about this scorecard, including features, benefits, implementation tips, and best practices.
Click to buy Performance Marketing KPI Scorecard in Excel
What Is a Performance Marketing KPI Scorecard in Excel?
A Performance Marketing KPI Scorecard in Excel is a structured dashboard that tracks and evaluates the effectiveness of digital marketing campaigns using key performance indicators (KPIs).
Instead of relying on scattered reports, you can monitor all critical metrics in one interactive Excel interface. Consequently, you gain better control over campaign performance.
Why Do Marketers Need a KPI Scorecard?
Performance marketing generates massive data. However, without proper tracking, that data loses value. Therefore, a KPI scorecard helps you:
- Monitor campaign efficiency
- Compare actual vs target performance
- Identify underperforming channels
- Optimize marketing spend
- Improve ROI
In short, this scorecard turns raw marketing data into actionable insights.
Key Features of the Performance Marketing KPI Scorecard in Excel
This ready-to-use template includes four powerful worksheets that work together to deliver complete performance visibility.
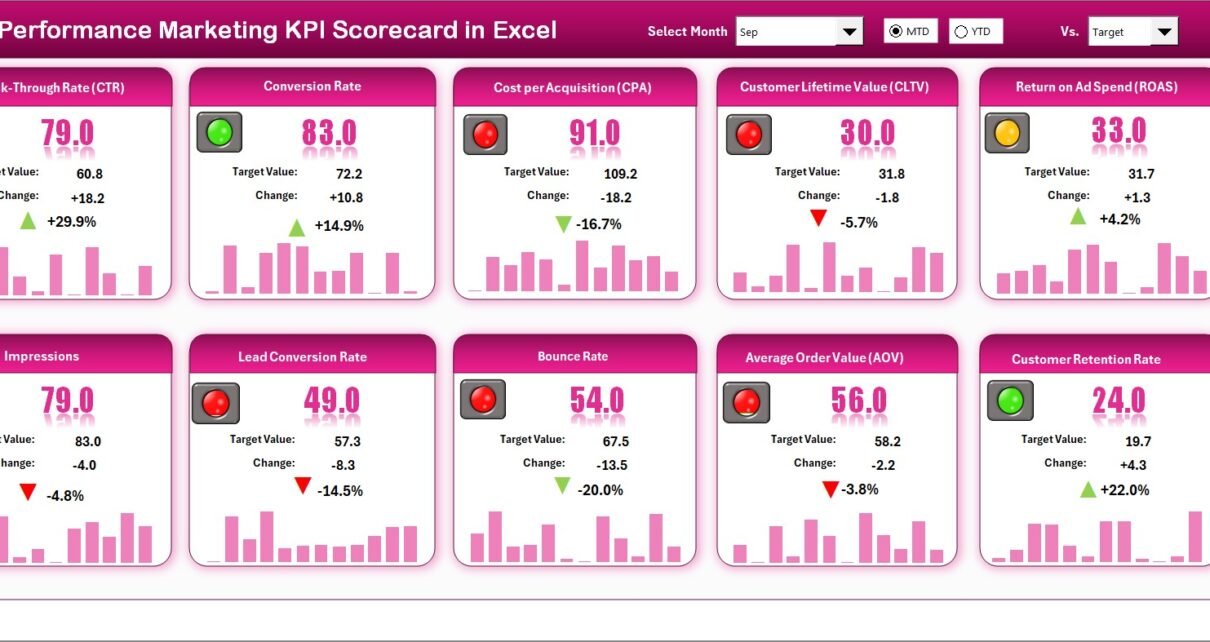
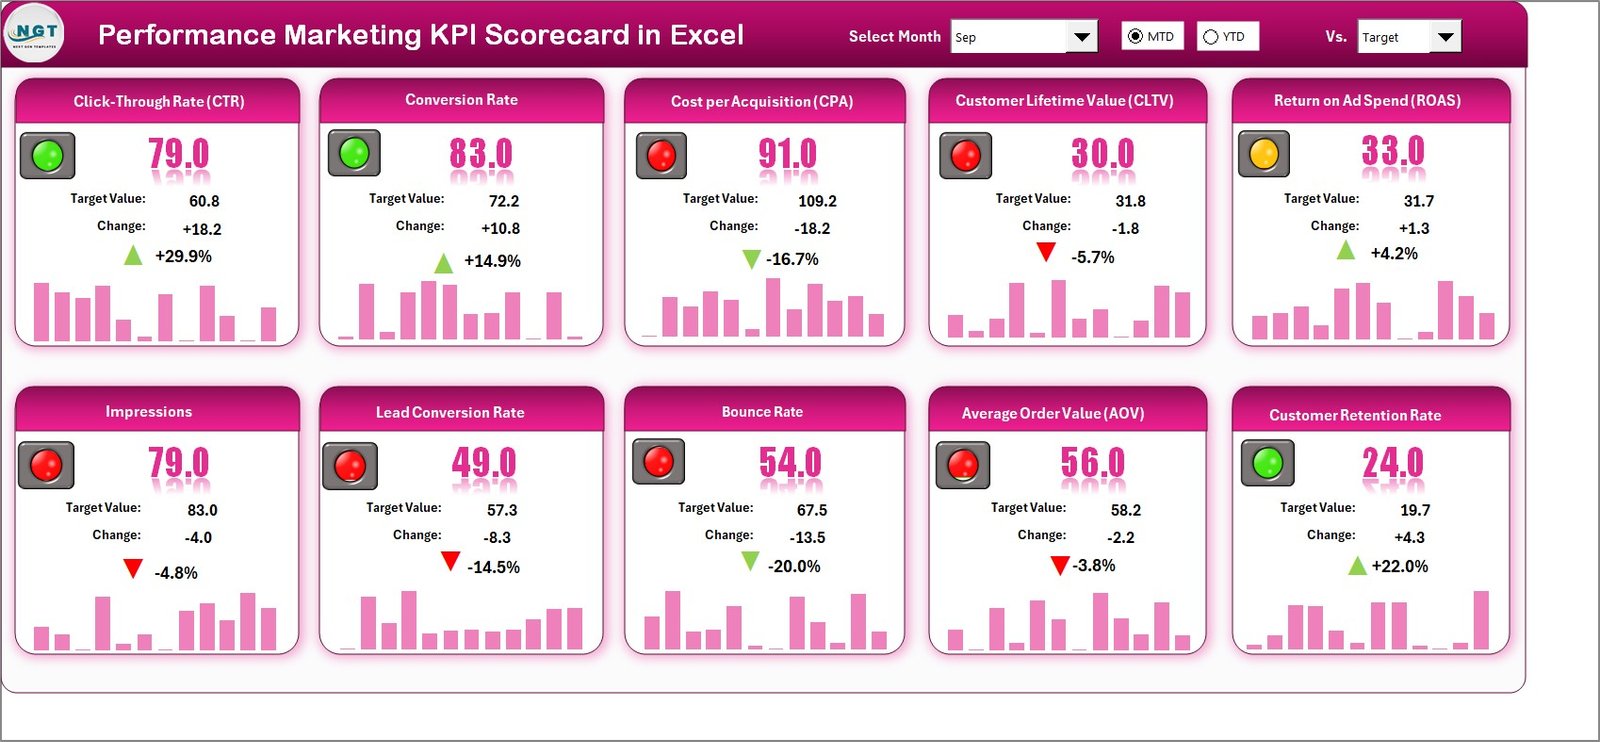
Scorecard Sheet – Your Command Center
The Scorecard Sheet acts as the main interface where you review overall KPI performance. Moreover, it presents insights in a clean and interactive format.
What Makes the Scorecard Sheet Powerful?
Dropdown Menus
You can select:
- Month
- MTD (Month-to-Date)
- YTD (Year-to-Date)
As soon as you change the selection, the entire dashboard updates automatically. Therefore, you always see the most relevant data.
Actual vs Target Comparison
The scorecard clearly shows:
- Actual performance
- Target values
- Performance gap
Because of this comparison, you quickly understand whether campaigns meet expectations.
Visual Performance Indicators
The template uses conditional formatting and color coding. As a result, you can instantly spot:
- Overperforming KPIs
- Underperforming KPIs
- On-track metrics
This visual clarity saves significant analysis time.
Comprehensive KPI Overview
The dashboard displays:
- KPI name
- KPI group
- Unit
- MTD performance
- YTD performance
- Target comparison
Therefore, decision-makers get a complete performance snapshot in seconds.
10 KPIs in One View
The scorecard shows ten KPIs simultaneously. Consequently, marketing teams can monitor multiple campaign dimensions without switching screens.
Click to buy Performance Marketing KPI Scorecard in Excel
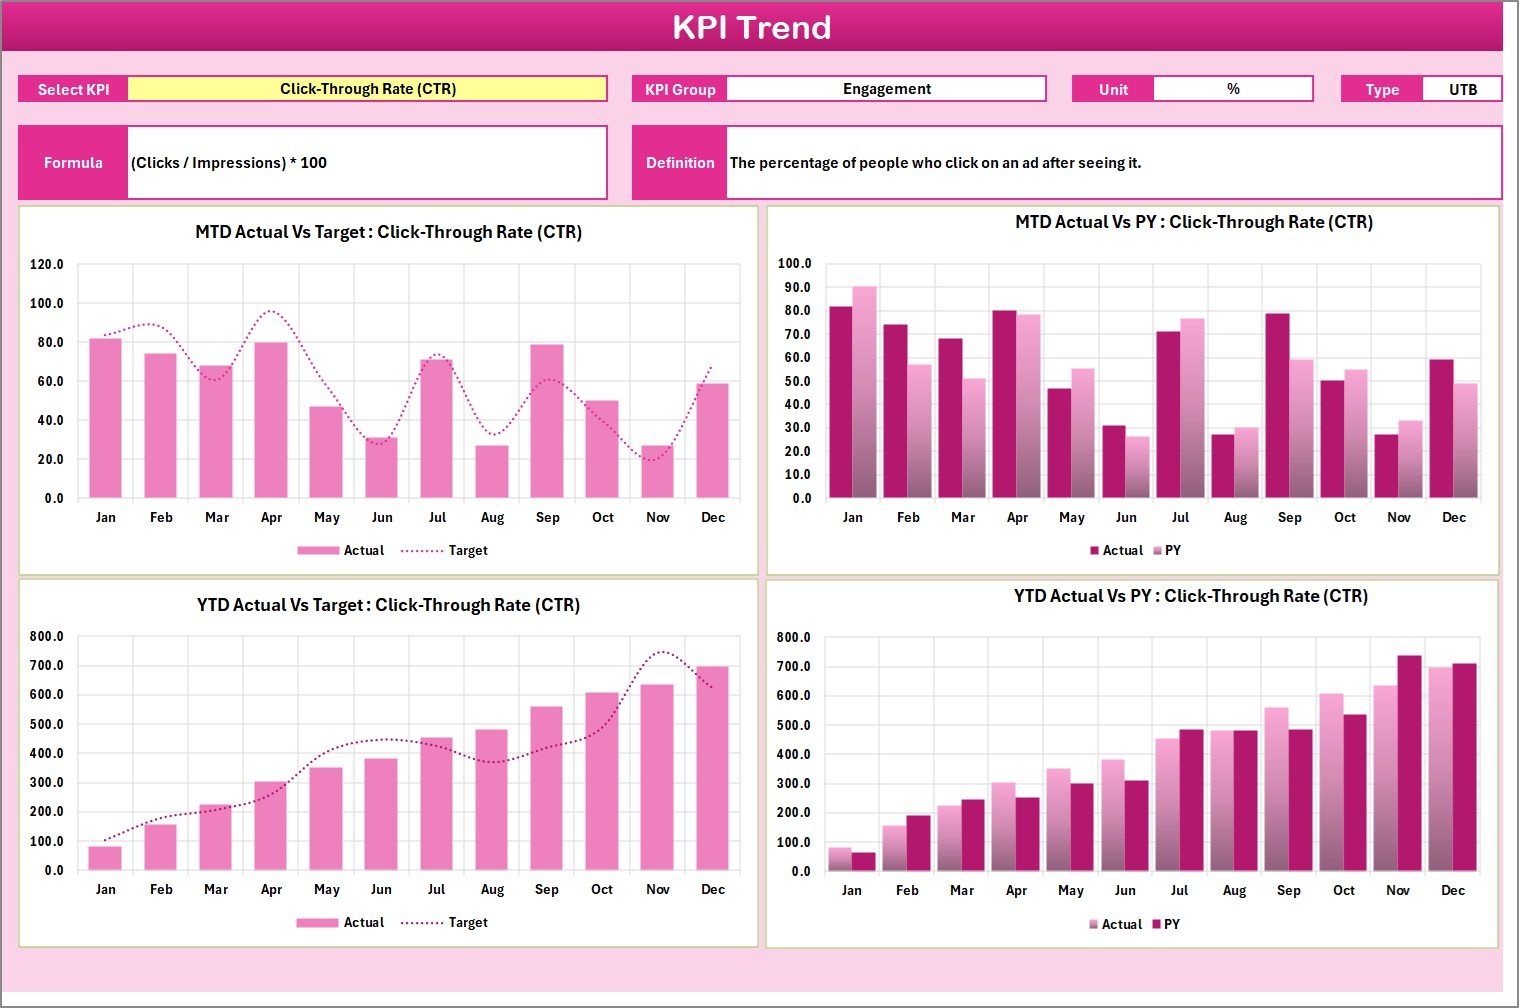
KPI Trend Sheet – Deep Performance Intelligence
While the scorecard gives a snapshot, the KPI Trend Sheet provides deeper analytical insight. Therefore, it helps you understand performance patterns over time.
Interactive KPI Selection
You can select any KPI from the dropdown in cell C3. Immediately, the sheet updates with detailed information.
Detailed KPI Information Display
For each KPI, the sheet shows:
- KPI Group
- Unit of measurement
- KPI Type (LTB or UTB)
- Formula
- Definition
Because of this structured layout, users understand exactly what each metric represents.
Powerful Trend Charts
The sheet includes dynamic trend charts for:
- Actual values
- Target values
- Previous Year (PY)
Additionally, the template displays both MTD and YTD trends. Therefore, you can analyze both short-term and long-term performance.
Why Trend Analysis Matters
Trend analysis helps you:
- Detect seasonal patterns
- Identify performance drops early
- Forecast future results
- Optimize campaigns proactively
Without trend visibility, marketers often react too late.
Click to buy Performance Marketing KPI Scorecard in Excel
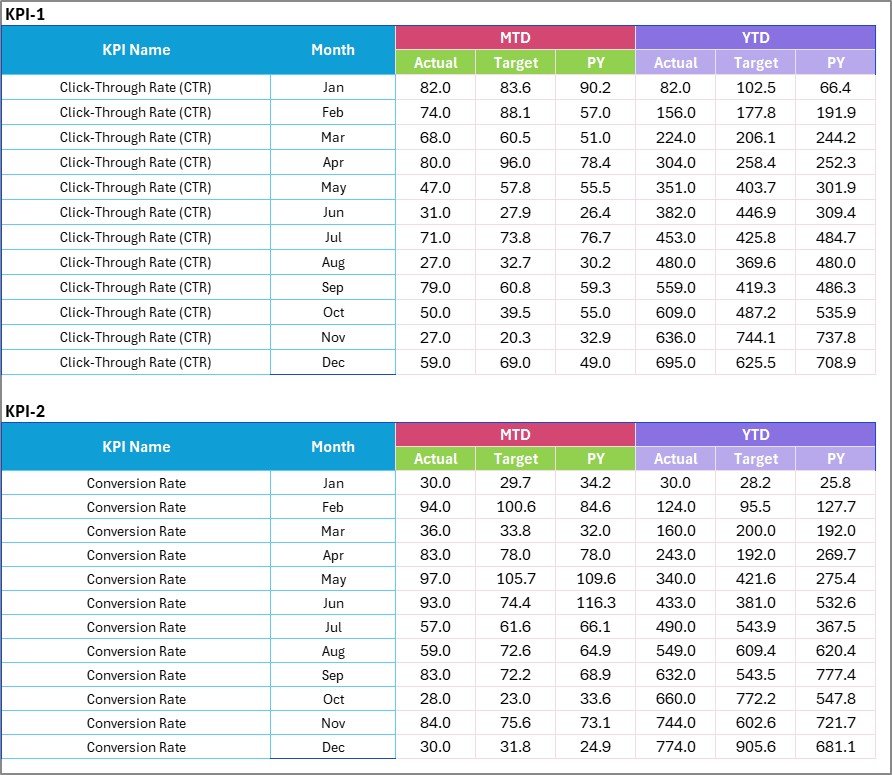
Input Data Sheet – The Data Engine
The Input Data Sheet serves as the backbone of the entire scorecard. Therefore, accurate data entry remains critical.
Simple and Flexible Data Entry
In this sheet, you can enter:
- Actual values
- Target values
- Previous year data
- Monthly metrics
Because the structure remains simple, even non-technical users can update data easily. Real-Time Dashboard Updates
As soon as you update the input data, the scorecard refreshes automatically. Consequently, your reports always stay current.
Why Structured Data Entry Matters
Proper data entry ensures:
- Accurate KPI calculations
- Reliable performance insights
- Better decision-making
- Consistent reporting
In contrast, poor data entry leads to misleading conclusions.
Click to buy Performance Marketing KPI Scorecard in Excel
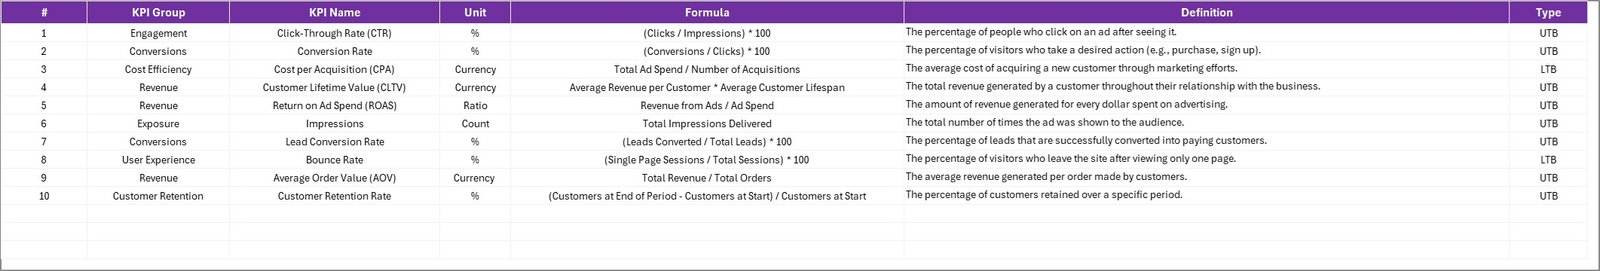
KPI Definition Sheet – Your KPI Dictionary
The KPI Definition Sheet ensures clarity and standardization across the organization.
What You Enter in This Sheet
You define:
- KPI Name
- KPI Group
- Unit
- Formula
- KPI Definition
Because of this documentation, every stakeholder understands the metrics clearly.
Why KPI Definitions Matter
Clear KPI definitions:
- Remove confusion
- Align teams
- Improve reporting accuracy
- Support governance
Therefore, this sheet plays a crucial strategic role.
Click to buy Performance Marketing KPI Scorecard in Excel
What KPIs Should You Track in Performance Marketing?
Although every business differs, most performance marketing teams track these essential KPIs:
Traffic & Acquisition KPIs
- Website Sessions
- Click-Through Rate (CTR)
- Cost Per Click (CPC)
- Impressions
- New Users
Conversion KPIs
- Conversion Rate
- Cost Per Acquisition (CPA)
- Leads Generated
- Sales Conversions
- Funnel Drop-off Rate
Revenue & ROI KPIs
- Return on Ad Spend (ROAS)
- Marketing ROI
- Revenue per Campaign
- Customer Lifetime Value (CLV)
- Average Order Value (AOV)
Engagement KPIs
- Bounce Rate
- Session Duration
- Pages per Session
- Email Open Rate
- Engagement Rate
By tracking the right mix, you gain full funnel visibility.
Advantages of Performance Marketing KPI Scorecard in Excel
Implementing this scorecard delivers significant business value. Let us explore the major advantages.
Centralized Performance Monitoring
Instead of using multiple reports, you view all KPIs in one place. Therefore, decision-making becomes faster and more accurate.
Real-Time Decision Support
Because the dashboard updates instantly, you can react quickly to performance changes. As a result, marketing teams stay agile.
Improved Campaign Optimization
The scorecard highlights underperforming metrics clearly. Consequently, you can adjust budgets and strategies immediately.
Better Budget Control
When you track cost-related KPIs closely, you prevent overspending. Therefore, marketing ROI improves consistently.
Easy Customization
Since the template runs in Excel, you can modify KPIs, formulas, and visuals easily. Thus, the tool adapts to any business model.
No Advanced Tools Required
Many organizations lack expensive BI tools. However, this Excel scorecard delivers powerful insights without additional software costs.
Opportunities for Improvement
While the scorecard delivers strong value, you can enhance it further with these improvements:
- Integrate Power Query for automated data refresh
- Add channel-wise performance breakdown
- Include campaign-level drill-down
- Build weekly performance tracking
- Add predictive forecasting models
- Connect with Google Ads or Meta Ads exports🔹 Include automated alert indicators
By implementing these enhancements, you can elevate the dashboard to an advanced analytics solution.
Best Practices for the Performance Marketing KPI Scorecard in Excel
To get maximum value, follow these proven best practices.
Define KPIs Before Implementation
First, align stakeholders on KPI definitions. Otherwise, teams may interpret metrics differently.
Keep Data Clean and Consistent
Always validate input data. Moreover, maintain consistent naming conventions.
Update Data Regularly
Schedule weekly or monthly updates. Consequently, the dashboard stays reliable.
Use Meaningful Targets
Set realistic targets based on historical performance. Otherwise, comparisons lose value.
Focus on Actionable Metrics
Avoid vanity metrics. Instead, track KPIs that directly impact revenue and growth.
Review Trends, Not Just Snapshots
Always analyze trends along with current performance. Therefore, you can detect issues early.
Limit KPI Overload
Although data matters, too many KPIs create confusion. Therefore, keep the scorecard focused.
Who Should Use This KPI Scorecard?
This template serves multiple roles across organizations.
Digital Marketing Managers
They can monitor campaign efficiency and budget utilization.
Marketing Analysts
They can perform deep performance analysis quickly.
Business Owners
They can track ROI without technical complexity.
Performance Marketing Agencies
They can create client-ready reports efficiently.
E-commerce Teams
They can optimize acquisition and conversion funnels.
How to Implement the Scorecard Step by Step
Follow this simple process to deploy the template successfully.
Step 1: Define Your KPIs
Select metrics that align with your marketing goals.
Step 2: Populate the KPI Definition Sheet
Enter KPI names, formulas, and units.
Step 3: Load Historical Data
Fill the Input Data sheet with past performance.
Step 4: Set Targets
Define realistic monthly and yearly targets.
Step 5: Validate the Scorecard
Check calculations and visual indicators.
Step 6: Share with Stakeholders
Distribute the dashboard to decision-makers.
Step 7: Monitor and Optimize
Review performance regularly and adjust campaigns.
Conclusion: Why This Scorecard Is a Must-Have
Performance marketing demands speed, clarity, and precision. However, manual reporting slows teams down and hides critical insights.
The Performance Marketing KPI Scorecard in Excel solves this problem effectively. It centralizes data, simplifies analysis, and empowers faster decisions.
Moreover, because the template remains flexible and easy to use, organizations of any size can adopt it quickly.
If you want to improve campaign visibility, optimize marketing spend, and drive measurable growth, this scorecard becomes an essential tool in your analytics stack.
Frequently Asked Questions (FAQs)
What is a Performance Marketing KPI Scorecard?
A Performance Marketing KPI Scorecard is an Excel-based dashboard that tracks and analyzes key digital marketing metrics in one centralized view.
Who can use this Excel scorecard?
Digital marketers, analysts, agencies, and business owners can use this template to monitor campaign performance effectively.
How often should I update the data?
You should update the Input Data sheet weekly or monthly. Regular updates ensure accurate insights.
Can I customize the KPIs?
Yes. You can easily modify KPI names, formulas, and targets based on your business needs.
Does this template support MTD and YTD analysis?
Yes. The scorecard automatically calculates and displays both Month-to-Date and Year-to-Date performance.
Do I need advanced Excel skills to use it?
No. The template uses simple structures and dropdowns. Therefore, even beginners can operate it comfortably.
Can this replace Power BI dashboards?
For many small and mid-sized teams, yes. However, large enterprises may still prefer Power BI for enterprise-scale automation.
Visit our YouTube channel to learn step-by-step video tutorials
Watch the step-by-step video tutorial:
Click to buy Performance Marketing KPI Scorecard in Excel