In today’s sustainability-driven world, recycling companies must track performance with accuracy and speed. However, many recycling plants still rely on scattered spreadsheets and manual reports. As a result, managers often struggle to measure operational efficiency, revenue performance, waste processing rates, and compliance metrics in one place.
Therefore, recycling companies need a centralized and smart monitoring system. More importantly, they need real-time insights into operational and financial KPIs.
That is exactly where the Recycling Companies KPI Dashboard in Power BI becomes essential.
This ready-to-use dashboard transforms raw Excel data into meaningful, interactive insights. Instead of compiling multiple reports, you can instantly monitor targets, compare current performance with last year, and make confident data-driven decisions.
In this comprehensive guide, you will learn:
Click to Purchases Recycling Companies KPI Dashboard in Power BI
-
What the Recycling Companies KPI Dashboard in Power BI is
-
Why recycling businesses need KPI tracking
-
Detailed explanation of dashboard pages
-
Advantages of using this dashboard
-
Best practices for implementation
-
Frequently asked questions
Let us explore everything step by step.
What Is a Recycling Companies KPI Dashboard in Power BI?
A Recycling Companies KPI Dashboard in Power BI is an interactive performance monitoring tool designed specifically for recycling and waste management businesses. It tracks key operational, environmental, and financial metrics in one structured view.
Instead of reviewing multiple files, managers can:
-
Track Month-to-Date (MTD) performance
-
Monitor Year-to-Date (YTD) trends
-
Compare current year results with previous year
-
Evaluate target achievement instantly
-
Analyze KPI definitions and formulas through drill-through
Because the dashboard uses Power BI, users can interact with slicers, filters, and visuals easily. As a result, decision-makers gain clarity and control.
Why Do Recycling Companies Need a KPI Dashboard?
Recycling operations involve multiple activities. For example:
-
Waste collection
-
Material segregation
-
Processing and sorting
-
Recycling output
-
Revenue generation
-
Environmental compliance
Without structured KPI monitoring, companies lose visibility. Consequently, inefficiencies increase.
However, when you implement a KPI dashboard:
-
You detect bottlenecks quickly
-
You improve resource allocation
-
You control operational costs
-
You increase recycling output
-
You ensure regulatory compliance
Therefore, KPI tracking becomes a strategic necessity.
Key Features of Recycling Companies KPI Dashboard in Power BI
Click to Purchases Recycling Companies KPI Dashboard in Power BI
This dashboard includes three powerful pages inside the Power BI Desktop application file. Each page serves a specific purpose.
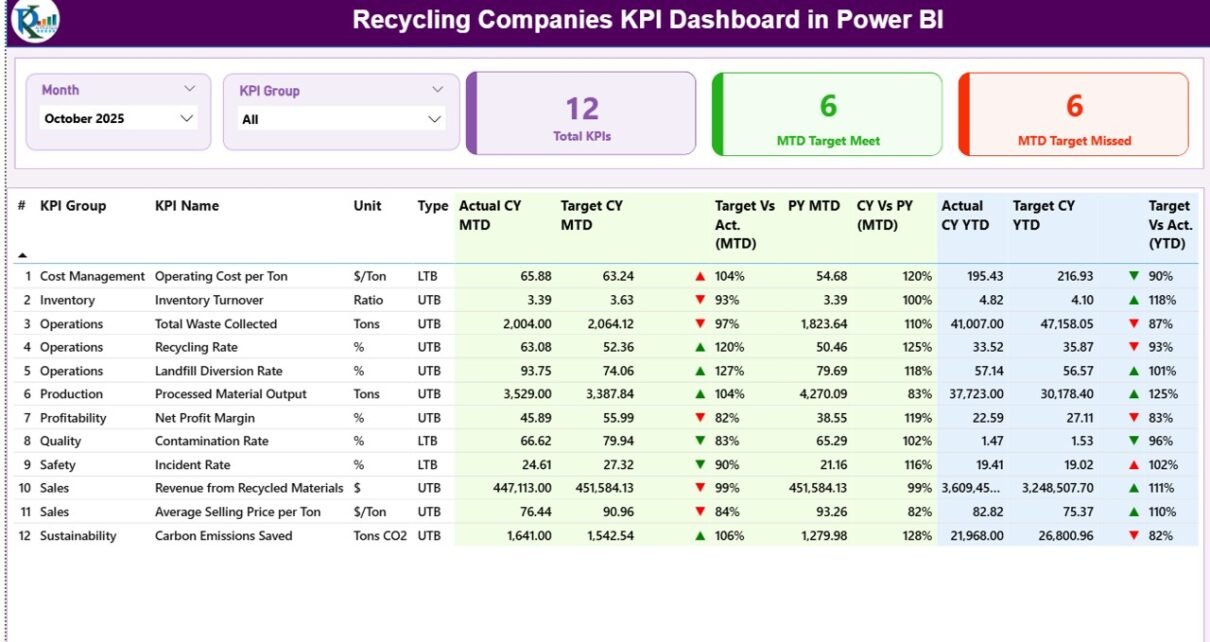
1️⃣ Summary Page – The Main Control Center
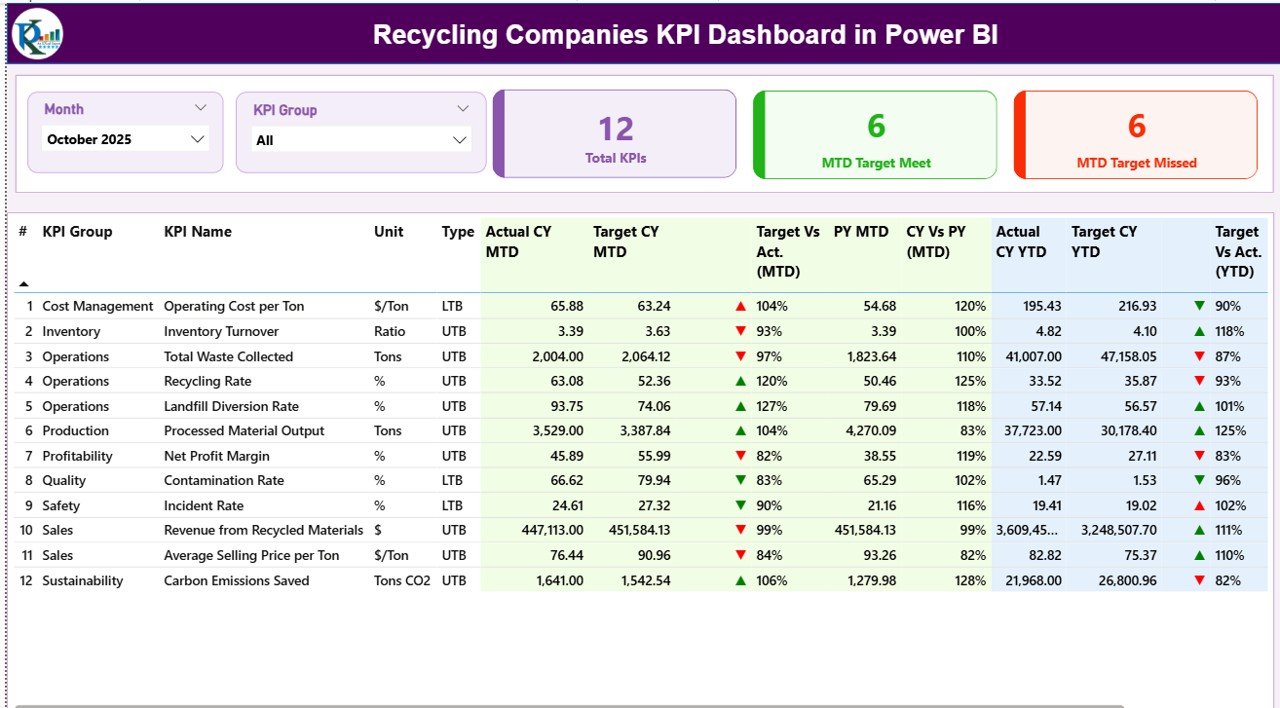
The Summary Page acts as the heart of the dashboard. It provides a full overview of all KPIs in one place.
What Does the Top Section Display?
At the top, you will see:
-
Month Slicer – Select any month
-
KPI Group Slicer – Filter KPIs by category
Because of these slicers, the entire dashboard updates instantly.
What KPI Cards Are Available?
The dashboard displays three powerful cards:
-
Total KPIs Count
-
MTD Target Meet Count
-
MTD Target Missed Count
These cards help managers instantly understand performance health.
What Details Appear in the KPI Table?
Below the cards, you will see a detailed KPI table that includes:
KPI Number
It shows the sequence number of the KPI.
KPI Group
It displays the category, such as:
-
Operational
-
Financial
-
Environmental
-
Compliance
KPI Name
It shows the name of the KPI, for example:
-
Total Waste Processed
-
Recycling Rate
-
Processing Cost per Ton
-
Revenue per Ton
Unit
It defines the measurement unit, such as:
-
Tons
-
Percentage (%)
-
USD
-
Hours
Type (LTB or UTB)
-
LTB (Lower the Better) – Example: Processing Cost
-
UTB (Upper the Better) – Example: Recycling Rate
How Does MTD Performance Work?
The dashboard displays:
-
Actual CY MTD
-
Target CY MTD
-
MTD Icon (▲ Green / ▼ Red)
-
Target vs Actual (MTD %)
-
PY MTD
-
CY vs PY (MTD %)
How Is Target vs Actual (MTD) Calculated?
Formula:
If performance exceeds target, the green arrow appears. Otherwise, the red arrow shows underperformance.
How Does YTD Performance Work?
Similarly, the dashboard shows:
-
Actual CY YTD
-
Target CY YTD
-
YTD Icon
-
Target vs Actual (YTD %)
-
PY YTD
-
CY vs PY (YTD %)
How Is CY vs PY Calculated?
Formula:
Therefore, managers can compare yearly trends easily.
2️⃣ KPI Trend Page – Deep Performance Analysis
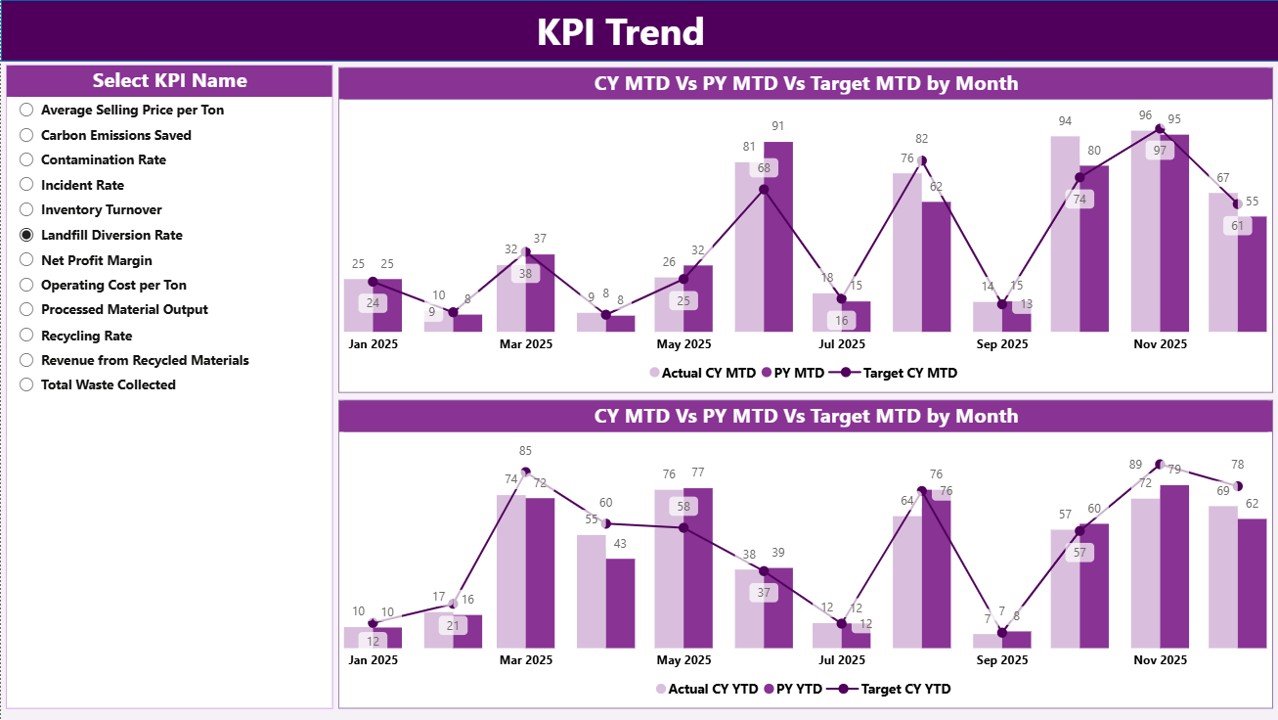
The KPI Trend Page provides visual insights.
What Does This Page Include?
-
Two combo charts
-
KPI Name slicer
What Do the Combo Charts Show?
Click to Purchases Recycling Companies KPI Dashboard in Power BI
Chart 1 – MTD Performance
-
Current Year Actual
-
Previous Year Actual
-
Target
Chart 2 – YTD Performance
-
Current Year Actual
-
Previous Year Actual
-
Target
Because the charts combine bars and lines, users can identify trends clearly.
For example:
-
If recycling output rises monthly, you can confirm operational improvement.
-
If costs increase, you can act quickly.
Thus, the Trend Page supports strategic planning.
3️⃣ KPI Definition Page – Detailed KPI Intelligence
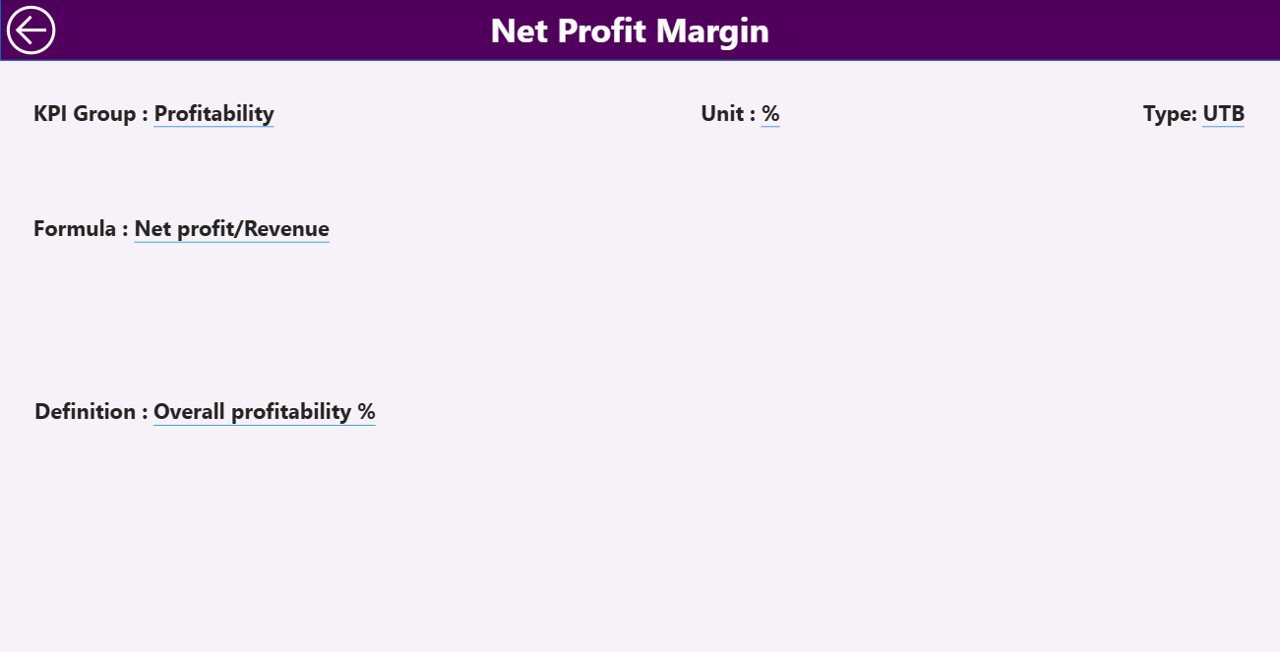
The KPI Definition Page works as a drill-through page.
What Information Does It Show?
-
KPI Number
-
KPI Group
-
KPI Name
-
Unit
-
Formula
-
Definition
-
Type (LTB or UTB)
When users click on a KPI from the Summary Page, they can drill through to view its formula and explanation.
Therefore, transparency improves significantly.
To return, users simply click the back button on the top-left corner.
Excel Data Structure Used in This Dashboard
The dashboard uses an Excel file as its data source. This makes data entry simple and flexible.
The Excel file contains three worksheets.
1️⃣ Input_Actual Sheet
In this sheet, you must fill:
-
KPI Name
-
Month (First date of month)
-
MTD Number
-
YTD Number
Because the month uses a date format, Power BI can aggregate correctly.
2️⃣ Input_Target Sheet
Here, you must enter:
-
KPI Name
-
Month
-
MTD Target
-
YTD Target
As a result, the dashboard calculates achievement percentages automatically.
3️⃣ KPI Definition Sheet
This sheet contains:
-
KPI Number
-
KPI Group
-
KPI Name
-
Unit
-
Formula
-
Definition
-
Type (LTB or UTB)
Therefore, the dashboard maintains complete documentation.
What KPIs Should Recycling Companies Track?
Although companies differ, most recycling businesses track:
Operational KPIs
-
Total Waste Collected
-
Total Waste Processed
-
Recycling Rate (%)
-
Machine Downtime
Financial KPIs
-
Revenue per Ton
-
Processing Cost per Ton
-
Gross Profit Margin
-
Transportation Cost
Environmental KPIs
-
CO₂ Reduction
-
Landfill Diversion Rate
-
Energy Consumption
Compliance KPIs
-
Regulatory Incidents
-
Safety Incidents
-
Audit Completion Rate
Because this dashboard supports multiple KPI groups, companies can customize easily.
Advantages of Recycling Companies KPI Dashboard in Power BI
Click to Purchases Recycling Companies KPI Dashboard in Power BI
Now let us explore the major advantages.
1️⃣ Real-Time Performance Visibility
Managers can monitor KPIs instantly. Therefore, decision-making becomes faster.
2️⃣ Target Tracking Made Easy
The dashboard compares actual numbers with targets automatically. As a result, performance gaps become visible immediately.
3️⃣ Year-over-Year Comparison
Because the dashboard shows CY vs PY metrics, companies can measure growth clearly.
4️⃣ Centralized Reporting
Instead of reviewing multiple files, users access everything in one Power BI report.
5️⃣ Improved Accountability
When teams see clear targets and results, accountability improves naturally.
6️⃣ Data Transparency
Since the KPI Definition page includes formulas, everyone understands the logic behind numbers.
7️⃣ Interactive Analysis
Users can filter by month and KPI group. Consequently, they can focus on specific performance areas.
Best Practices for the Recycling Companies KPI Dashboard in Power BI
To maximize benefits, follow these best practices.
1️⃣ Define Clear KPIs
First, select KPIs that align with business goals. Avoid unnecessary metrics.
2️⃣ Maintain Accurate Data Entry
Ensure that the Excel input sheets contain correct and consistent data.
3️⃣ Update Data Monthly
Update actual and target sheets regularly. Therefore, the dashboard always reflects current performance.
4️⃣ Use Consistent Units
Always define measurement units clearly in the KPI Definition sheet.
5️⃣ Monitor Trends, Not Just Targets
While target tracking matters, trend analysis provides deeper insights.
6️⃣ Train Team Members
Make sure managers understand slicers, drill-through, and filtering options.
7️⃣ Review KPIs Periodically
Business priorities change. Therefore, review KPI relevance every quarter.
How Does This Dashboard Improve Recycling Operations?
This dashboard supports operational excellence in several ways.
-
It highlights inefficiencies quickly.
-
It identifies cost overruns early.
-
It monitors recycling performance consistently.
-
It supports environmental reporting.
-
It strengthens compliance management.
As a result, recycling companies can grow sustainably.
Click to Purchases Recycling Companies KPI Dashboard in Power BI
Conclusion
Recycling businesses operate in a highly competitive and regulated environment. Therefore, they need structured performance monitoring.
The Recycling Companies KPI Dashboard in Power BI offers:
-
Real-time performance tracking
-
Target comparison
-
Year-over-year analysis
-
Interactive trend charts
-
Detailed KPI documentation
Because it uses Excel as a data source, implementation remains simple. At the same time, Power BI ensures powerful visualization.
If your recycling company wants better control, improved efficiency, and stronger profitability, this dashboard delivers the right solution.
Frequently Asked Questions (FAQs)
1️⃣ What is the main purpose of the Recycling Companies KPI Dashboard in Power BI?
It helps recycling companies monitor operational, financial, environmental, and compliance KPIs in one interactive dashboard.
2️⃣ Can I customize KPIs in this dashboard?
Yes. You can add or modify KPIs in the Excel file and update the Power BI report accordingly.
3️⃣ Does the dashboard support MTD and YTD analysis?
Yes. It tracks both Month-to-Date and Year-to-Date performance with target comparisons.
4️⃣ What does LTB and UTB mean?
-
LTB means Lower the Better.
-
UTB means Upper the Better.
These types define how performance is evaluated.
5️⃣ How often should I update the data?
You should update actual and target data monthly for accurate reporting.
6️⃣ Can I use this dashboard for multiple recycling plants?
Yes. You can expand the data model to include location filters and plant-wise analysis.
7️⃣ Is Power BI required to use this dashboard?
Yes. You need Microsoft Power BI Desktop or Power BI Service to use and interact with the dashboard.
Visit our YouTube channel to learn step-by-step video tutorials