The pet care industry continues to grow rapidly. Pet owners now expect high-quality grooming, boarding, daycare, training, and veterinary services. Therefore, pet care businesses must track performance consistently and professionally.
However, many pet service providers still rely on scattered spreadsheets. As a result, they struggle to monitor bookings, revenue, customer satisfaction, occupancy rates, and staff productivity in one place.
So, how can you track everything clearly and make smarter decisions?
The answer is simple.
You need a Pet Care Services KPI Dashboard in Power BI.
This ready-to-use Power BI dashboard transforms your Excel data into interactive reports. Moreover, it helps you compare MTD and YTD performance, monitor targets, and analyze trends instantly. Consequently, you gain full control over your pet care business.
In this detailed guide, you will learn:
-
What a Pet Care Services KPI Dashboard in Power BI is
-
Why pet businesses need KPI tracking
-
Detailed explanation of all 3 dashboard pages
-
Excel data structure requirements
-
Important KPIs for pet care services
-
Advantages of Pet Care Services KPI Dashboard in Power BI
-
Best Practices for implementation
-
Frequently Asked Questions
Let us explore everything step by step.
Click to Purchases Pet Care Services KPI Dashboard in Power BI
📊 What Is a Pet Care Services KPI Dashboard in Power BI?
A Pet Care Services KPI Dashboard in Power BI is an interactive business intelligence report that tracks key performance indicators (KPIs) for pet-related services.
Instead of manually reviewing Excel sheets, you can:
-
Select a month
-
Filter by KPI group
-
View target vs actual performance
-
Compare current year vs previous year
-
Analyze trends visually
Because Power BI offers dynamic filtering and drill-through features, you can explore performance in detail within seconds.
🐶 Why Do Pet Care Businesses Need KPI Tracking?
Pet care businesses manage multiple services daily. For example:
-
Grooming appointments
-
Boarding occupancy
-
Vet consultations
-
Training sessions
-
Retail product sales
If you do not track KPIs properly, you lose visibility. Therefore, you cannot identify growth areas or operational problems.
KPI tracking helps you:
-
Improve revenue management
-
Optimize service capacity
-
Increase customer retention
-
Monitor staff efficiency
-
Compare performance month-over-month
Moreover, when you measure performance regularly, you make faster and more confident decisions.
Click to Purchases Pet Care Services KPI Dashboard in Power BI
📁 What Are the 3 Pages in the Pet Care Services KPI Dashboard in Power BI?
This ready-to-use Power BI file contains 3 powerful pages:
1️⃣ Summary Page
2️⃣ KPI Trend Page
3️⃣ KPI Definition Page (Drill-Through)
Let us understand each page in detail.
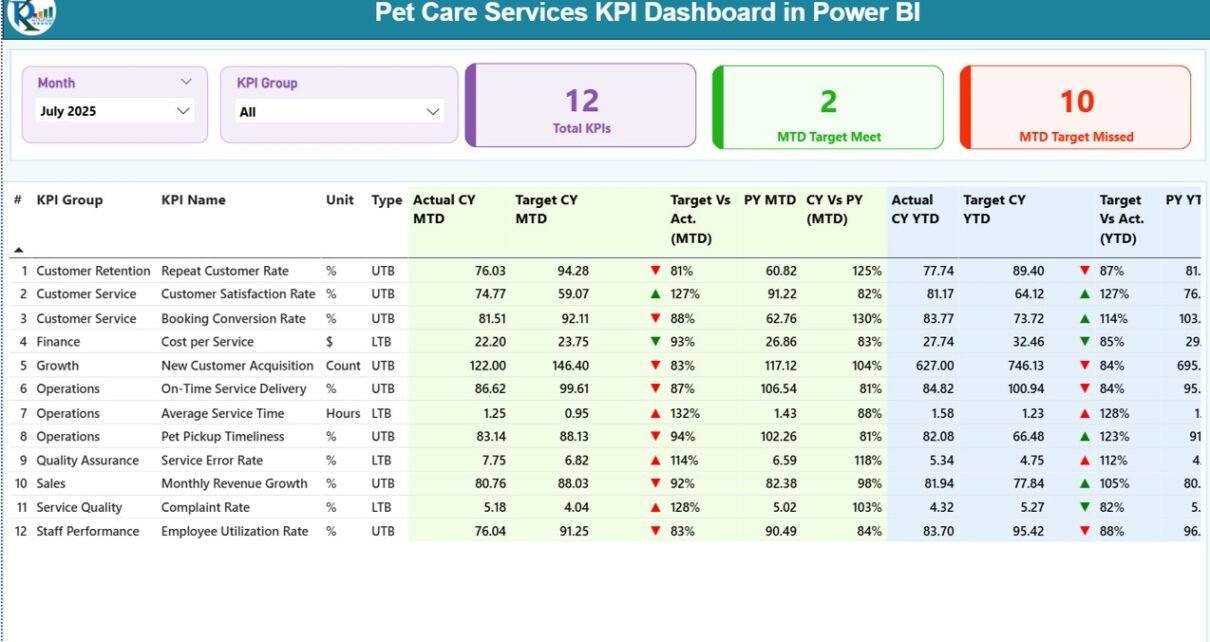
1️⃣ Summary Page – Complete KPI Overview
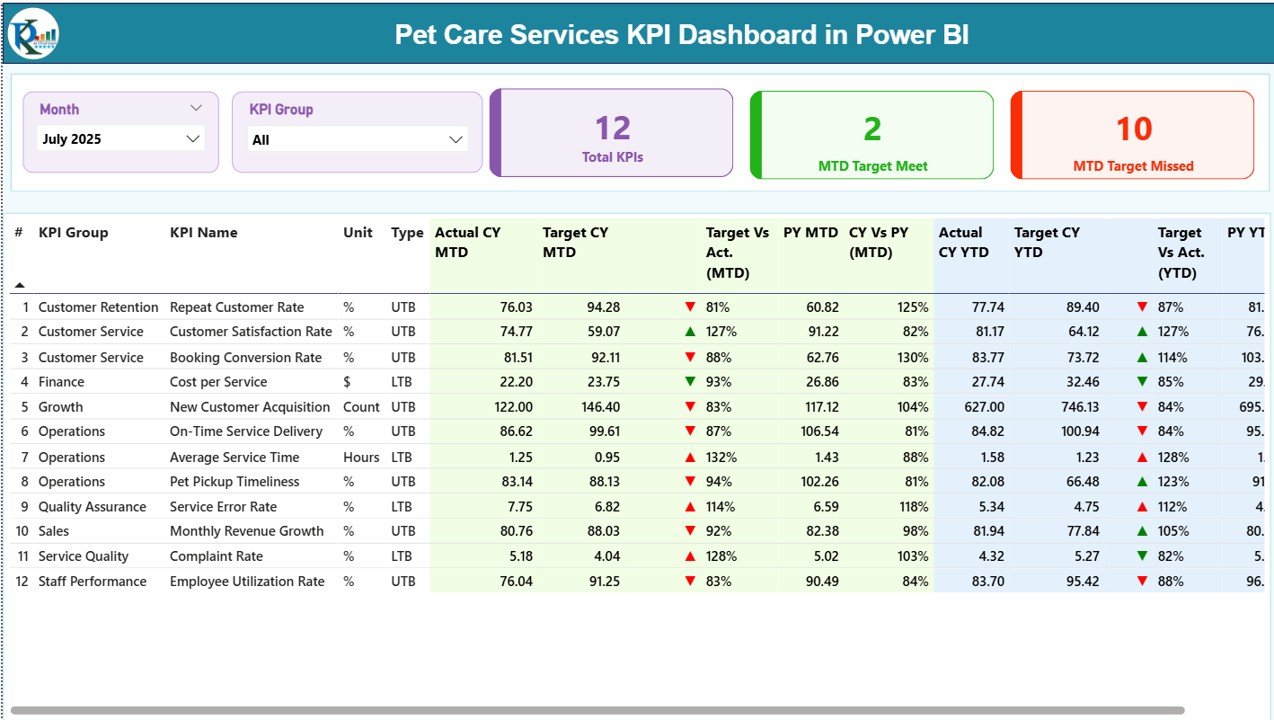
The Summary Page works as the main performance screen.
At the top of the dashboard, you will find:
-
Month slicer
-
KPI Group slicer
Therefore, you can filter data instantly.
Key KPI Cards
On this page, you will also see 3 KPI cards:
-
Total KPIs Count
-
MTD Target Meet Count
-
MTD Target Missed Count
Because of these cards, you quickly understand overall performance status.
Detailed KPI Table
Below the cards, the dashboard displays a structured KPI table with the following columns:
-
KPI Number
-
KPI Group
-
KPI Name
-
Unit
-
Type (LTB or UTB)
-
Actual CY MTD
-
Target CY MTD
-
MTD Icon (▲ or ▼ with color indicators)
-
Target Vs Actual (MTD %)
-
PY MTD
-
CY Vs PY (MTD %)
-
Actual CY YTD
-
Target CY YTD
-
YTD Icon (▲ or ▼)
-
Target Vs Actual (YTD %)
-
PY YTD
-
CY Vs PY (YTD %)
How Are Calculations Done?
-
Target vs Actual (MTD) = Actual MTD / Target MTD
-
CY vs PY (MTD) = Current Year MTD / Previous Year MTD
-
Target vs Actual (YTD) = Actual YTD / Target YTD
-
CY vs PY (YTD) = Current Year YTD / Previous Year YTD
Because of percentage calculations and visual icons, you can instantly detect performance gaps.
Click to Purchases Pet Care Services KPI Dashboard in Power BI
2️⃣ KPI Trend Page – Visual Performance Analysis
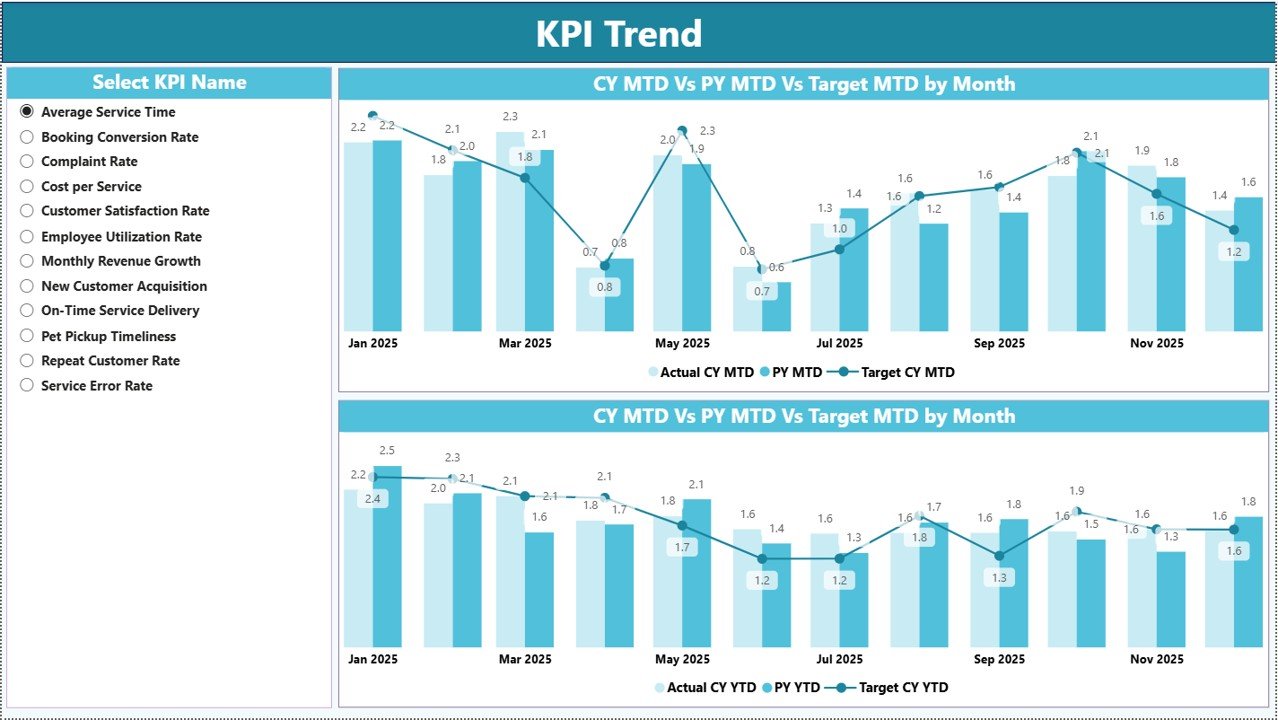
The KPI Trend Page allows deeper analysis.
On the left side, you can select the KPI name using a slicer.
Once selected, the page displays:
-
MTD Combo Chart (Actual, Target, Previous Year)
-
YTD Combo Chart (Actual, Target, Previous Year)
Therefore, you can analyze:
-
Growth trends
-
Seasonal performance
-
Target achievement patterns
Because the charts update dynamically, you can explore different KPIs without navigating away.
3️⃣ KPI Definition Page – Drill-Through Details
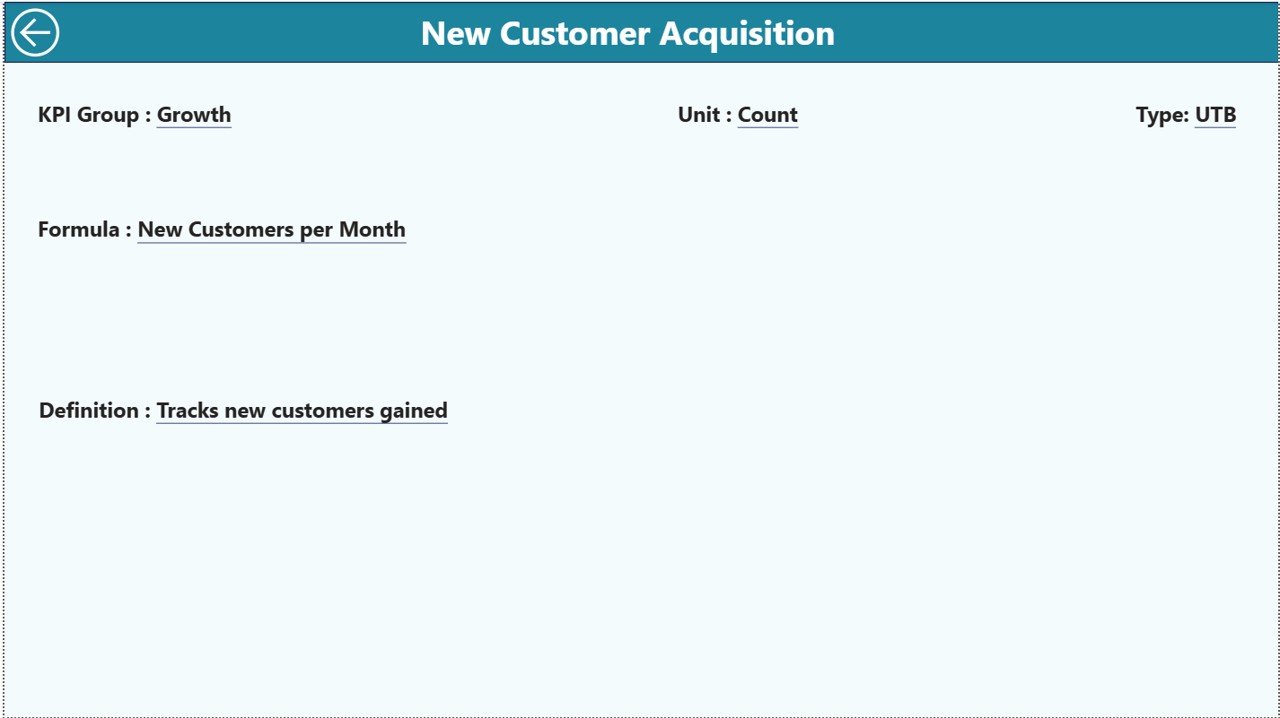
The KPI Definition Page remains hidden. However, you can access it using the drill-through feature from the Summary Page.
This page displays:
-
KPI Number
-
KPI Group
-
KPI Name
-
Unit
-
Formula
-
Definition
-
Type (LTB or UTB)
Therefore, whenever you need clarity about a KPI calculation, you can check its definition instantly.
To return to the Summary Page, simply click the back button at the top-left corner.
Click to Purchases Pet Care Services KPI Dashboard in Power BI
📊 What Excel Data Structure Supports This Dashboard?
The dashboard uses an Excel file as its data source. You must maintain three worksheets.
1️⃣ Input_Actual Sheet
In this sheet, you enter:
-
KPI Name
-
Month (first date of month)
-
MTD numbers
-
YTD numbers
Because you use structured data entry, Power BI updates automatically after refresh.
2️⃣ Input_Target Sheet
Here, you enter:
-
KPI Name
-
Month
-
MTD target
-
YTD target
As a result, the dashboard calculates Target vs Actual percentages accurately.
3️⃣ KPI Definition Sheet
This sheet stores:
-
KPI Number
-
KPI Group
-
KPI Name
-
Unit
-
Formula
-
Definition
-
Type (LTB or UTB)
Therefore, the dashboard maintains clarity and consistency.
Click to Purchases Pet Care Services KPI Dashboard in Power BI
🐕 What Are Important KPIs for Pet Care Services?
A pet care business must track financial, operational, and customer metrics.
Financial KPIs
-
Total Revenue
-
Revenue per Service
-
Average Transaction Value
-
Profit Margin
-
Cost per Service
Operational KPIs
-
Appointment Utilization Rate
-
Boarding Occupancy Rate
-
Service Completion Time
-
Staff Productivity Rate
Customer KPIs
-
Customer Retention Rate
-
Repeat Booking Rate
-
Customer Satisfaction Score
-
Net Promoter Score
Marketing KPIs
-
Lead Conversion Rate
-
Cost per Acquisition
-
Online Booking Percentage
When you track these KPIs consistently, you create a strong growth foundation.
⭐ Advantages of Pet Care Services KPI Dashboard in Power BI
The Pet Care Services KPI Dashboard in Power BI provides several advantages.
✅ 1. Real-Time Interactive Reporting
You can filter by month and KPI group instantly.
✅ 2. Clear Target Monitoring
You compare Actual vs Target easily.
✅ 3. Year-over-Year Comparison
You analyze performance against previous year data.
✅ 4. Visual Trend Analysis
Combo charts highlight growth patterns clearly.
✅ 5. Drill-Through Clarity
You can view KPI definitions in one click.
✅ 6. Professional Business Intelligence
Power BI offers a modern and interactive reporting experience.
Click to Purchases Pet Care Services KPI Dashboard in Power BI
🛠️ Best Practices for the Pet Care Services KPI Dashboard in Power BI
To maximize dashboard value, follow these best practices.
✔️ 1. Update Excel Data Monthly
Enter accurate MTD and YTD numbers regularly.
✔️ 2. Use Consistent Month Formatting
Always use the first date of the month.
✔️ 3. Define KPIs Clearly
Maintain proper KPI definitions in the Definition sheet.
✔️ 4. Review Dashboard Monthly
Analyze trends and take corrective action immediately.
✔️ 5. Focus on Missed Targets
Investigate KPIs showing red indicators.
✔️ 6. Train Your Team
Ensure managers understand KPI calculations and interpretation.
📈 How Can This Dashboard Help You Grow Faster?
This dashboard helps you:
-
Increase revenue visibility
-
Improve operational efficiency
-
Monitor staff performance
-
Identify seasonal trends
-
Plan marketing strategies
-
Make data-driven pricing decisions
Because you rely on real data, you reduce guesswork and improve results.
🏁 Conclusion
The pet care industry demands professional management. Therefore, you must adopt structured performance tracking systems.
The Pet Care Services KPI Dashboard in Power BI offers:
-
Interactive reporting
-
MTD and YTD tracking
-
Target monitoring
-
Year-over-year comparison
-
Drill-through KPI definitions
Moreover, it transforms simple Excel data into powerful business intelligence.
If you want to scale your grooming salon, veterinary clinic, boarding center, or pet daycare facility, this dashboard provides the perfect foundation.
Start tracking. Start analyzing. Start growing. 🐾📊
Click to Purchases Pet Care Services KPI Dashboard in Power BI
❓ Frequently Asked Questions (FAQs)
1. What type of pet businesses can use this dashboard?
Pet grooming salons, boarding centers, veterinary clinics, pet daycare providers, and training institutes can use it.
2. Do I need advanced Power BI knowledge?
No. You only need basic Power BI skills to refresh data and use slicers.
3. Can I customize KPIs?
Yes. You can modify KPI definitions and add new KPIs in the Excel file.
4. How often should I update the data?
You should update it monthly for accurate tracking.
5. Does this dashboard support multi-location tracking?
Yes. You can add location columns in the Excel file and extend filters in Power BI.
6. Can I share this dashboard with my team?
Yes. You can publish it to Power BI Service and share access securely.
Click to Purchases Pet Care Services KPI Dashboard in Power BI
Visit our YouTube channel to learn step-by-step video tutorials