The antique business demands precision, expertise, and strong financial control. Antique dealers handle rare collectibles, estate items, auction pieces, and vintage treasures. Therefore, they must monitor performance closely.
However, many antique businesses still depend on static spreadsheets. As a result, they struggle to track monthly revenue, inventory turnover, auction performance, profit margins, and year-over-year growth in one structured view.
So, how can antique dealers gain real-time business visibility?
The answer is clear.
You need an Antique Dealers KPI Dashboard in Power BI.
This ready-to-use Power BI dashboard converts Excel data into interactive visual reports. Moreover, it allows you to analyze MTD and YTD performance, compare targets, and evaluate growth trends. Consequently, you make faster and smarter business decisions.
In this detailed guide, you will learn:
-
What an Antique Dealers KPI Dashboard in Power BI is
-
Why antique businesses need KPI tracking
-
Detailed explanation of all 3 dashboard pages
-
Excel data structure requirements
-
Important KPIs for antique dealers
-
Advantages of Antique Dealers KPI Dashboard in Power BI
-
Best Practices for implementation
-
Frequently Asked Questions
Let us explore everything step by step.
Click to Purchases Antique Dealers KPI Dashboard in Power BI
📊 What Is an Antique Dealers KPI Dashboard in Power BI?
An Antique Dealers KPI Dashboard in Power BI is an interactive business intelligence tool that tracks key performance indicators for antique and collectible businesses.
Instead of manually analyzing spreadsheets, you can:
-
Filter data by month
-
Select KPI groups
-
Compare Actual vs Target
-
Analyze Current Year vs Previous Year
-
Monitor trends visually
Because Power BI supports dynamic slicers and drill-through features, you gain deep analytical power with simple clicks.
🏛️ Why Do Antique Dealers Need KPI Tracking?
Antique dealing involves complex financial movements. For example:
-
High-value single-item sales
-
Auction commissions
-
Restoration costs
-
Inventory holding expenses
-
Seasonal demand fluctuations
If you do not track KPIs systematically, you risk cash flow imbalance and inventory stagnation.
KPI tracking helps you:
-
Improve profitability
-
Control inventory turnover
-
Evaluate auction performance
-
Monitor customer repeat purchases
-
Track revenue growth trends
Moreover, when you review KPIs monthly, you respond quickly to market changes.
Click to Purchases Antique Dealers KPI Dashboard in Power BI
📁 What Are the 3 Pages in the Antique Dealers KPI Dashboard in Power BI?
This dashboard includes 3 structured pages:
1️⃣ Summary Page
2️⃣ KPI Trend Page
3️⃣ KPI Definition Page (Drill-Through)
Let us understand each page clearly.
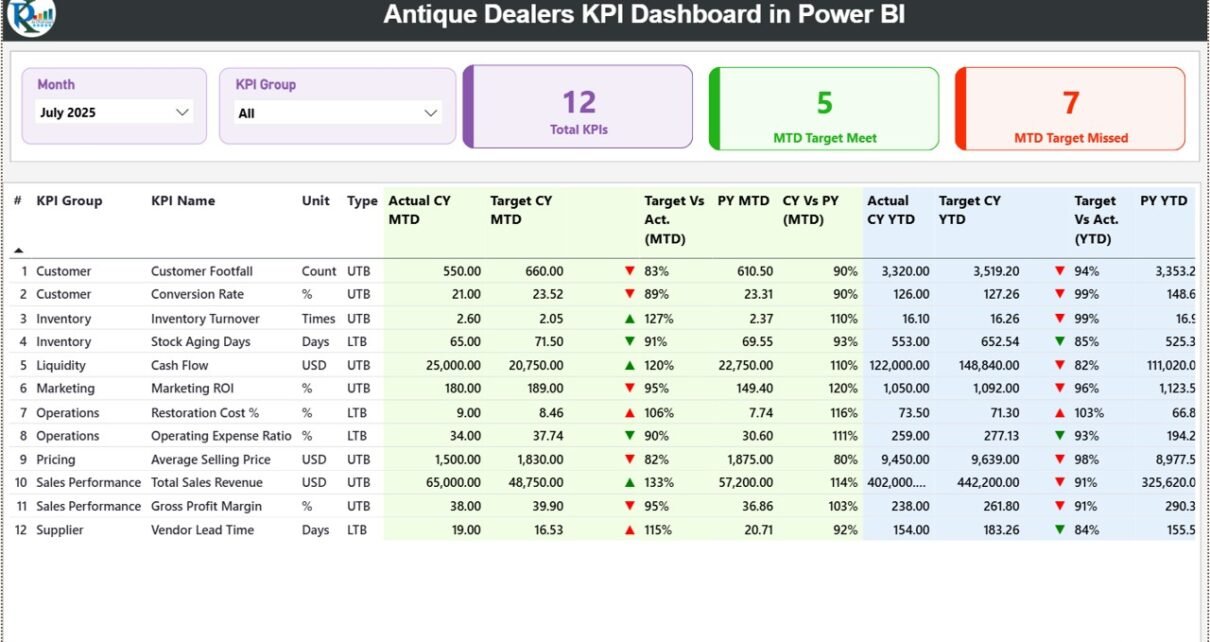
1️⃣ Summary Page – Complete KPI Overview
The Summary Page serves as the main performance screen.
At the top, you will find:
-
Month slicer
-
KPI Group slicer
These filters allow you to analyze performance instantly.
🔢 KPI Cards Section
The page includes 3 key performance cards:
-
Total KPIs Count
-
MTD Target Meet Count
-
MTD Target Missed Count
Because of these cards, you immediately understand overall business health.
📋 Detailed KPI Table
Below the cards, you see a structured KPI table with the following columns:
-
KPI Number
-
KPI Group
-
KPI Name
-
Unit
-
Type (LTB or UTB)
-
Actual CY MTD
-
Target CY MTD
-
MTD Icon (▲ Green / ▼ Red)
-
Target Vs Actual (MTD %)
-
PY MTD
-
CY Vs PY (MTD %)
-
Actual CY YTD
-
Target CY YTD
-
YTD Icon (▲ Green / ▼ Red)
-
Target Vs Actual (YTD %)
-
PY YTD
-
CY Vs PY (YTD %)
📐 How Are Calculations Done?
The dashboard uses clear formulas:
-
Target vs Actual (MTD) = Actual MTD / Target MTD
-
CY vs PY (MTD) = Current Year MTD / Previous Year MTD
-
Target vs Actual (YTD) = Actual YTD / Target YTD
-
CY vs PY (YTD) = Current Year YTD / Previous Year YTD
Because of percentage indicators and icons, you can quickly identify performance gaps.
Click to Purchases Antique Dealers KPI Dashboard in Power BI
2️⃣ KPI Trend Page – Visual Growth Analysis
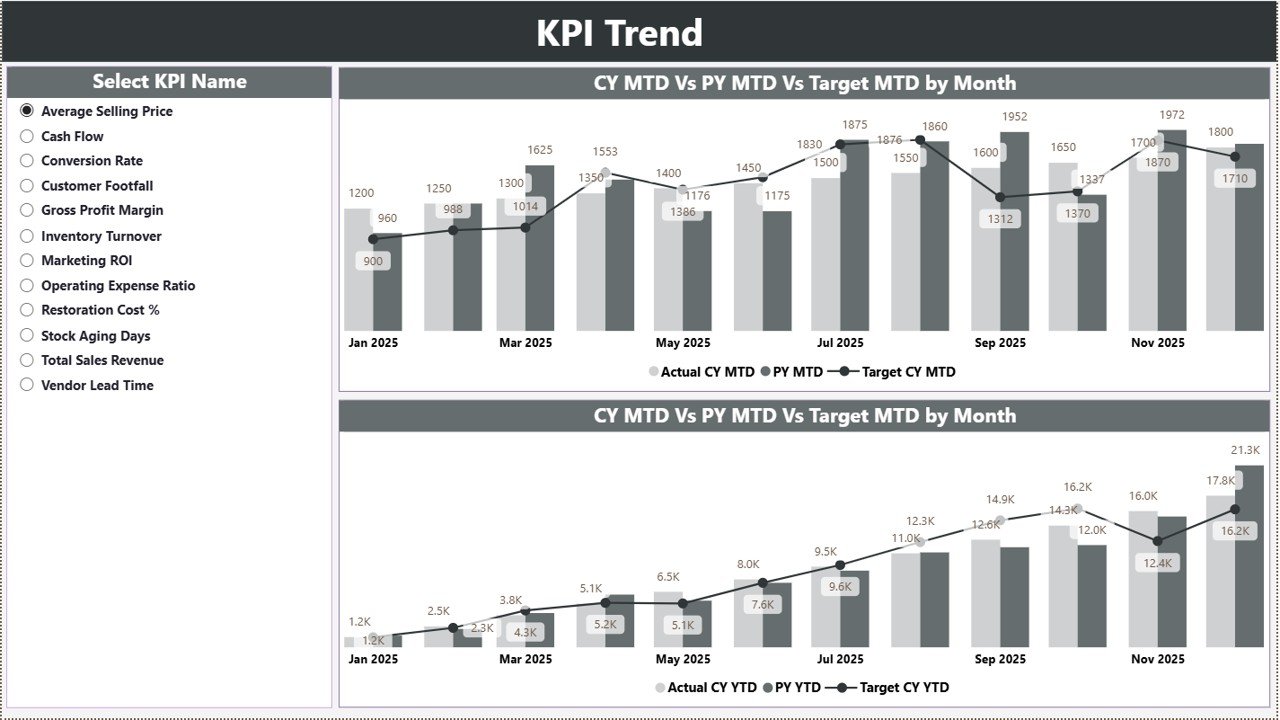
The KPI Trend Page helps you analyze performance patterns.
On the left side, you can select the KPI name using a slicer.
The page displays two combo charts:
-
MTD Chart (Actual, Target, Previous Year)
-
YTD Chart (Actual, Target, Previous Year)
Therefore, you can:
-
Identify seasonal sales patterns
-
Compare growth month-by-month
-
Evaluate target achievement trends
Because the charts update dynamically, analysis becomes fast and interactive.
Click to Purchases Antique Dealers KPI Dashboard in Power BI
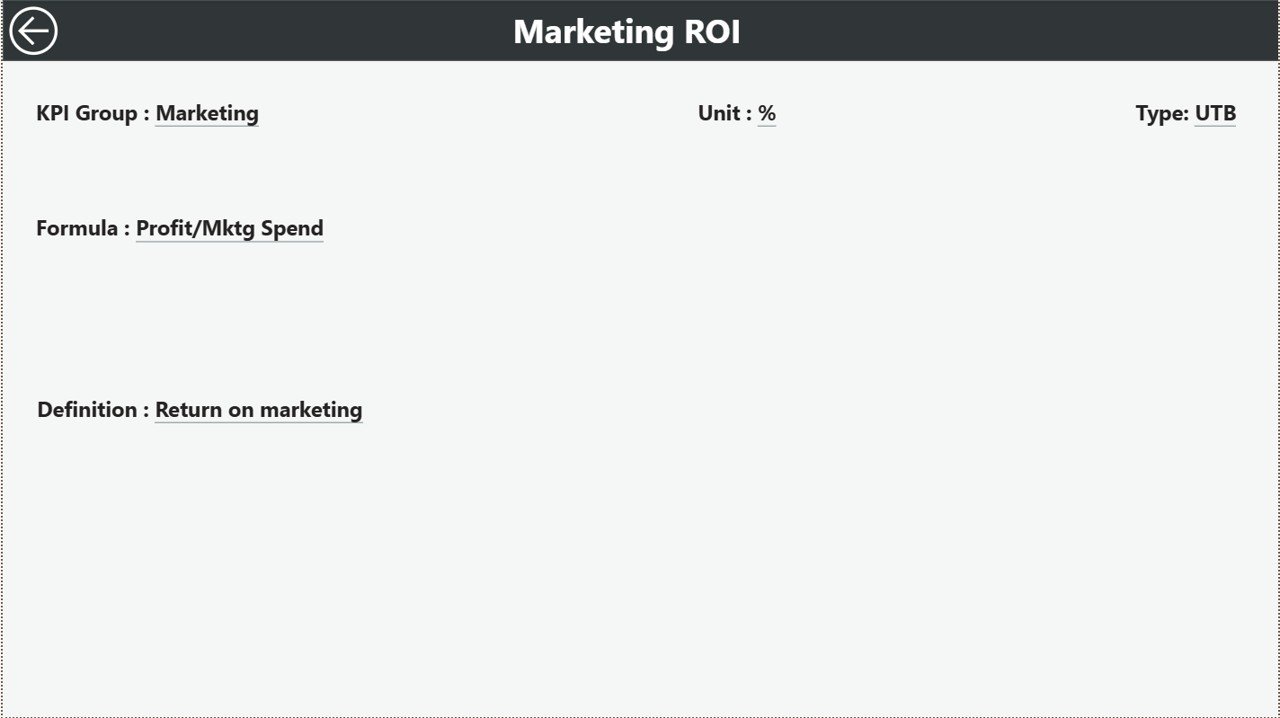
3️⃣ KPI Definition Page – Drill-Through Clarity
The KPI Definition Page remains hidden by default. However, you can drill through from the Summary Page.
This page shows:
-
KPI Number
-
KPI Group
-
KPI Name
-
Unit
-
Formula
-
KPI Definition
-
Type (LTB or UTB)
Whenever you need clarity about a KPI calculation, you can check its definition instantly.
To return to the main page, simply click the back button at the top-left corner.
📊 What Excel Data Structure Supports This Dashboard?
The dashboard uses an Excel file as its data source. You must maintain three worksheets properly.
1️⃣ Input_Actual Sheet
In this sheet, you enter:
-
KPI Name
-
Month (first date of the month)
-
MTD number
-
YTD number
After entering data, refresh Power BI to update the dashboard.
2️⃣ Input_Target Sheet
Here, you enter:
-
KPI Name
-
Month
-
MTD target
-
YTD target
This sheet supports target comparison calculations.
3️⃣ KPI Definition Sheet
In this sheet, you fill:
-
KPI Number
-
KPI Group
-
KPI Name
-
Unit
-
Formula
-
Definition
-
Type (LTB or UTB)
This structure ensures KPI consistency and clarity.
Click to Purchases Antique Dealers KPI Dashboard in Power BI
📈 What Are Important KPIs for Antique Dealers?
Antique businesses should track financial, inventory, and sales performance metrics.
💰 Financial KPIs
-
Total Sales Revenue
-
Gross Profit Margin
-
Net Profit Margin
-
Average Transaction Value
-
Commission Revenue
📦 Inventory KPIs
-
Inventory Turnover Ratio
-
Stock Holding Period
-
Dead Stock Percentage
-
High-Value Inventory Ratio
🛍️ Sales KPIs
-
Auction Success Rate
-
Private Sale Conversion Rate
-
Repeat Customer Rate
-
Lead Conversion Rate
⚙️ Operational KPIs
-
Restoration Cost per Item
-
Appraisal Accuracy Rate
-
Purchase-to-Sale Cycle Time
When you track these KPIs, you strengthen financial discipline and inventory control.
Click to Purchases Antique Dealers KPI Dashboard in Power BI
⭐ Advantages of Antique Dealers KPI Dashboard in Power BI
The Antique Dealers KPI Dashboard in Power BI offers multiple advantages.
✅ 1. Interactive Reporting
You filter data instantly using slicers.
✅ 2. Clear Target Monitoring
You compare Actual vs Target visually.
✅ 3. Year-over-Year Analysis
You evaluate growth against previous year performance.
✅ 4. Visual Trend Charts
Combo charts highlight seasonal patterns clearly.
✅ 5. Drill-Through Transparency
You access KPI formulas and definitions in one click.
✅ 6. Professional Business Intelligence
You present performance reports confidently to partners and investors.
Click to Purchases Antique Dealers KPI Dashboard in Power BI
🛠️ Best Practices for the Antique Dealers KPI Dashboard in Power BI
To maximize dashboard value, follow these best practices.
✔️ 1. Update Excel Data Monthly
Enter accurate MTD and YTD numbers consistently.
✔️ 2. Use Consistent Month Formatting
Always enter the first date of the month.
✔️ 3. Define KPIs Clearly
Maintain accurate KPI definitions in the definition sheet.
✔️ 4. Focus on Missed Targets
Investigate KPIs showing red indicators.
✔️ 5. Analyze Trends Regularly
Review trend charts to identify growth opportunities.
✔️ 6. Train Your Team
Ensure managers understand KPI calculations and interpretation.
📊 How Does This Dashboard Help Antique Businesses Grow?
This dashboard supports business growth by:
-
Improving inventory turnover
-
Optimizing pricing strategies
-
Identifying profitable categories
-
Strengthening cash flow planning
-
Enhancing strategic planning
Because you rely on structured analytics, you reduce guesswork and improve profitability.
🏁 Conclusion
The antique industry requires strategic management and financial clarity. Therefore, structured KPI tracking becomes essential.
The Antique Dealers KPI Dashboard in Power BI provides:
-
Interactive performance tracking
-
MTD and YTD analysis
-
Target vs Actual comparison
-
Year-over-Year evaluation
-
Drill-through KPI clarity
Moreover, it transforms Excel data into powerful visual intelligence.
If you want professional reporting and stronger business control, this dashboard offers the ideal solution.
Start tracking. Start analyzing. Start growing. 🏺📊
Click to Purchases Antique Dealers KPI Dashboard in Power BI
❓ Frequently Asked Questions (FAQs)
1. Who can use this dashboard?
Antique dealers, auction houses, estate sale managers, and collectible traders can use it.
2. Do I need advanced Power BI skills?
No. You only need basic knowledge to refresh data and use slicers.
3. Can I customize KPIs?
Yes. You can modify KPIs in the Excel source file.
4. How often should I update the data?
You should update it monthly for accurate tracking.
5. Can I track multiple store locations?
Yes. You can add location fields in the Excel file and extend filters.
6. Does this dashboard support financial planning?
Yes. It supports revenue tracking, profit analysis, and inventory performance monitoring.
Click to Purchases Antique Dealers KPI Dashboard in Power BI
Visit our YouTube channel to learn step-by-step video tutorials