Battery manufacturing plays a critical role in today’s fast-growing energy ecosystem. As electric vehicles, renewable energy storage, and portable electronics continue to expand, manufacturers must maintain high production efficiency, strict quality standards, and cost control. However, many battery manufacturers still rely on disconnected spreadsheets and manual reports. As a result, decision-makers struggle to monitor performance in real time.Therefore, organizations need a centralized analytics solution that converts manufacturing data into actionable insights. This is exactly where the Battery Manufacturing KPI Dashboard in Power BI becomes essential.A Battery Manufacturing KPI Dashboard helps manufacturers track operational performance, compare targets with actual results, analyze trends, and improve production efficiency using interactive visuals. Moreover, Power BI transforms complex production data into easy-to-understand dashboards that support faster decision-making.
In this comprehensive guide, you will learn everything about the Battery Manufacturing KPI Dashboard in Power BI, including features, dashboard structure, benefits, implementation steps, best practices, and frequently asked questions.
Click to buy Battery Manufacturing KPI Dashboard in Power BI
What Is a Battery Manufacturing KPI Dashboard in Power BI?
A Battery Manufacturing KPI Dashboard in Power BI is an interactive analytics tool designed to monitor manufacturing performance using Key Performance Indicators (KPIs).
Instead of reviewing multiple operational reports, managers can track all performance indicators in one centralized dashboard. Consequently, teams identify issues quickly and take corrective action without delay.
The dashboard tracks:
- Production efficiency
- Quality performance
- Target achievement
- Year-over-year comparison
- Monthly and yearly trends
- Operational performance metrics
Because Power BI updates visuals dynamically, users gain instant visibility into manufacturing performance.
Why Do Battery Manufacturers Need KPI Dashboards?
Battery production involves multiple complex processes such as electrode preparation, cell assembly, formation, testing, and packaging. Therefore, even small inefficiencies can create large financial losses.
Without structured KPI tracking:
- Production delays increase.
- Quality issues remain unnoticed.
- Targets become difficult to achieve.
- Management decisions slow down.
However, when organizations use a KPI dashboard, they monitor performance continuously and improve operational control.
Key Features of the Battery Manufacturing KPI Dashboard in Power BI
This ready-to-use dashboard captures data through an Excel file and visualizes it inside Power BI. The dashboard contains three interactive pages, each serving a specific purpose.
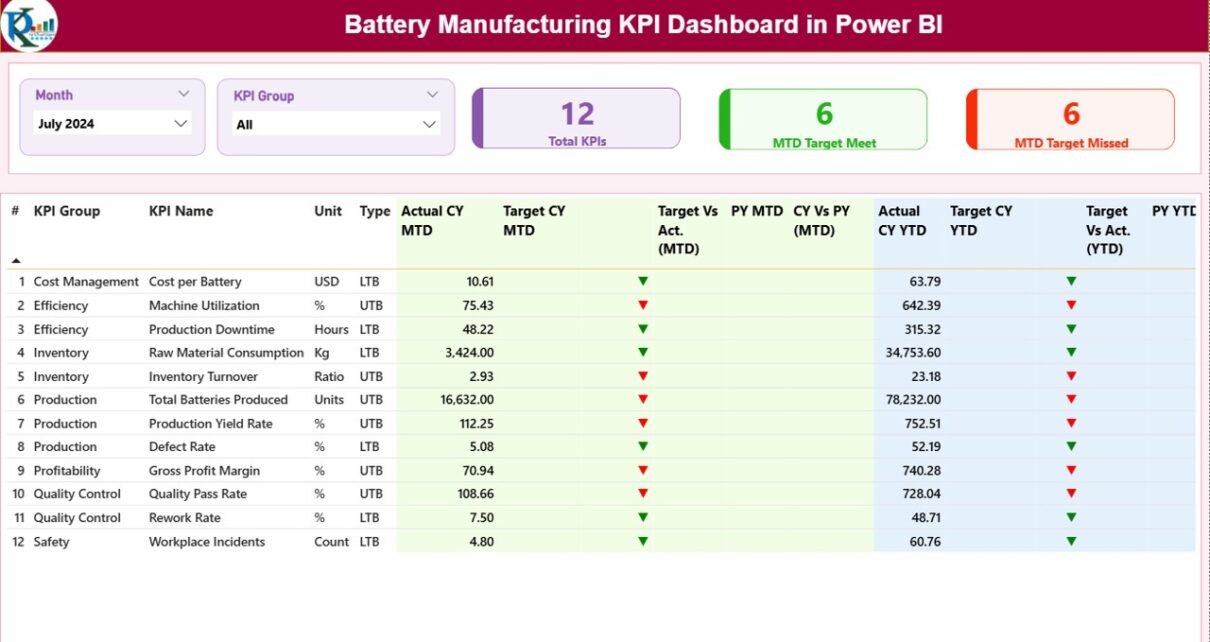
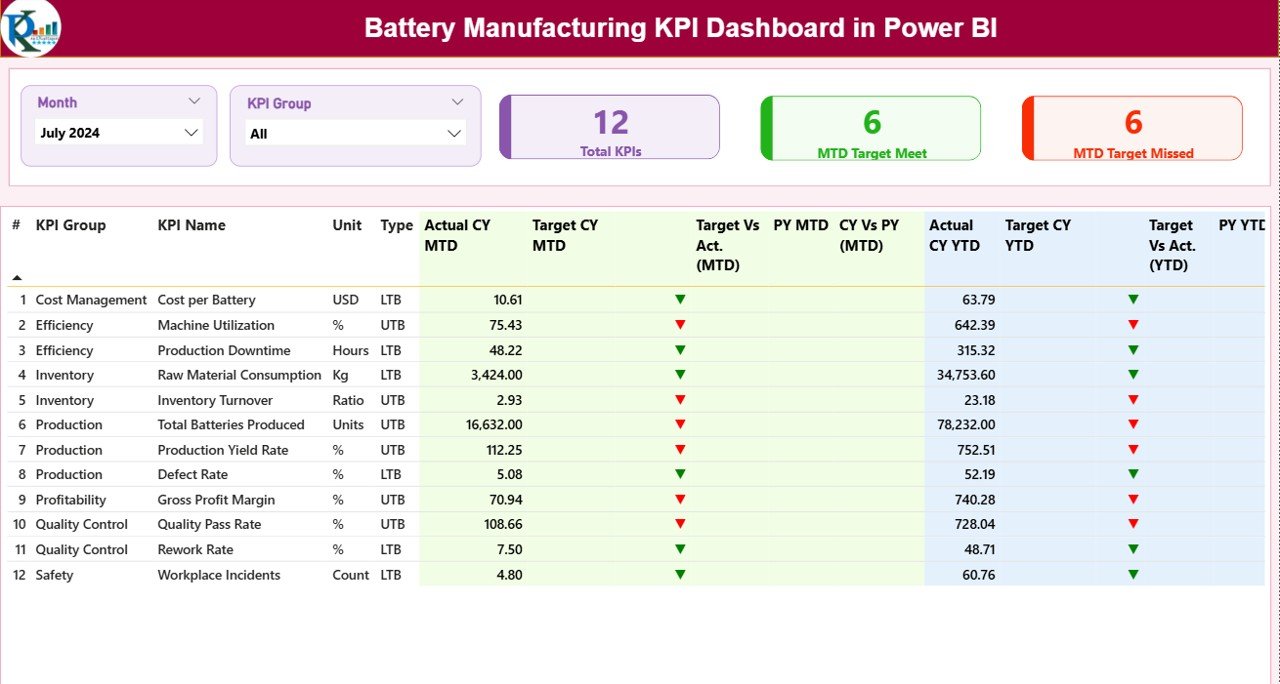
Summary Page – The Central Performance Overview
The Summary Page acts as the main dashboard where users monitor overall KPI performance.
Top Section Features
At the top, users find interactive slicers:
- Month Slicer – Filters performance by month.
- KPI Group Slicer – Filters KPIs by category.
These slicers allow users to analyze performance instantly.
KPI Performance Cards
The dashboard displays three important KPI cards:
- Total KPIs Count
- MTD Target Meet Count
- MTD Target Missed Count
These indicators immediately show whether operations stay on track.
Detailed KPI Performance Table
The dashboard includes a structured KPI table containing:
- KPI Number
- KPI Group
- KPI Name
- Unit of Measurement
- KPI Type (LTB or UTB)
- Actual CY MTD
- Target CY MTD
- MTD Status Icons (▲ ▼)
- Target vs Actual %
- Previous Year MTD
- Current vs Previous Year %
- Actual CY YTD
- Target CY YTD
- YTD Status Icons
- Target vs Actual YTD %
- Previous Year YTD
- CY vs PY YTD %
Because color indicators highlight performance instantly, managers identify underperforming KPIs quickly.
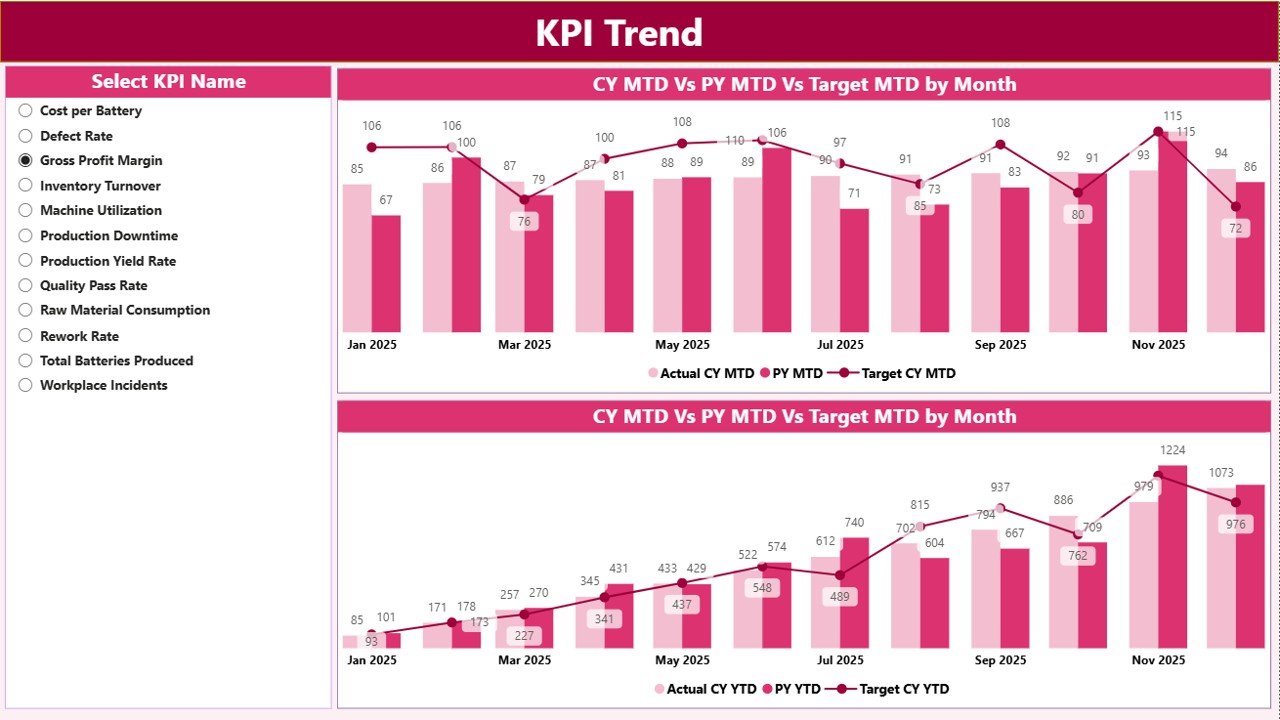
KPI Trend Page – Performance Over Time
While the summary page shows status, the KPI Trend Page explains performance behavior.
Key Components
- KPI selection slicer
- Two combo charts:
MTD performance comparison
YTD performance comparison
The charts compare:
- Current Year Actual
- Previous Year Actual
- Target Values
Therefore, users understand whether performance improves or declines over time.
Trend analysis helps management forecast production outcomes and adjust strategies early.
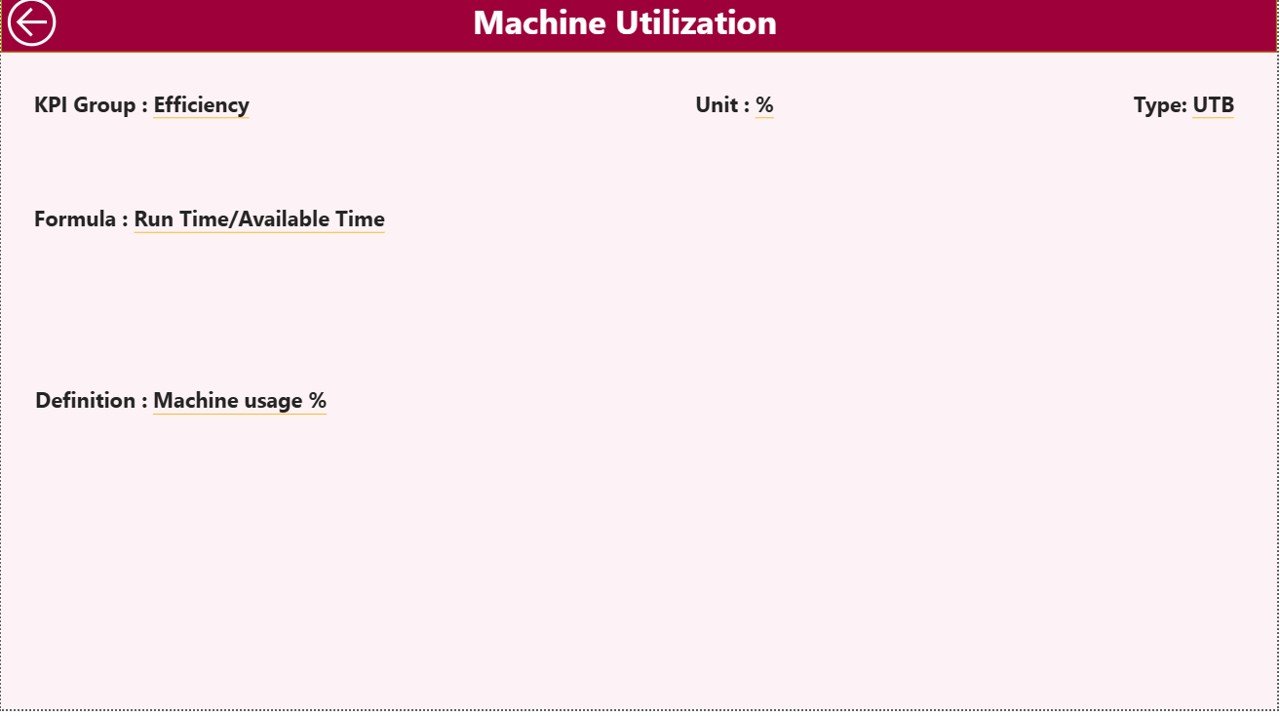
KPI Definition Page – Detailed KPI Insights
The KPI Definition Page works as a drill-through page.
Users can access it directly from the summary page to view:
- KPI Formula
- KPI Definition
- Measurement logic
- KPI type explanation
Since this page remains hidden, it keeps the dashboard clean while still providing detailed insights when needed.
A back button allows users to return instantly to the main dashboard.
Click to buy Battery Manufacturing KPI Dashboard in Power BI
What Data Source Does the Dashboard Use?
The dashboard uses an Excel file as the data source, which makes implementation simple and flexible.
The Excel file contains three worksheets.
Input_Actual Sheet
Here, users enter actual performance values:
- KPI Name
- Month (first date of month)
- MTD values
- YTD values
This sheet records real operational results.
Input_Target Sheet
This sheet stores target values:
- KPI Name
- Month
- Target MTD values
- Target YTD values
Because targets remain separate, users update planning data easily.
KPI Definition Sheet
This sheet defines KPI logic:
- KPI Number
- KPI Group
- KPI Name
- Unit
- Formula
- Definition
- Type (LTB or UTB)
This structure ensures data consistency across the dashboard.
How Does the Dashboard Improve Battery Manufacturing Operations?
A KPI dashboard does more than display numbers. It actively supports operational excellence.
Real-Time Monitoring
Managers track performance instantly instead of waiting for monthly reports.
Faster Decision-Making
Since data updates dynamically, leadership responds quickly to production issues.
Performance Transparency
Every department clearly understands targets and outcomes.
Continuous Improvement
Trend analysis highlights improvement opportunities.
Advantages of Battery Manufacturing KPI Dashboard in Power BI
Organizations gain several operational and strategic benefits.
Improved Production Visibility
Teams monitor manufacturing KPIs from one screen.
Better Target Tracking
Managers compare actual results against targets instantly.
Early Problem Detection
Visual alerts highlight issues before they escalate.
Data-Driven Decisions
Leaders rely on real numbers rather than assumptions.
Time Savings
Automation eliminates manual reporting work.
Historical Comparison
Year-over-year analysis supports strategic planning.
Increased Accountability
Departments stay responsible for KPI performance.
Which KPIs Should Battery Manufacturers Track?
Although organizations customize KPIs, common examples include:
- Production Output
- Defect Rate
- Yield Percentage
- Energy Consumption
- Machine Utilization
- Downtime Hours
- Scrap Rate
- On-Time Delivery
- Cycle Time
- Capacity Utilization
Tracking these metrics ensures balanced operational performance.
How to Implement the Battery Manufacturing KPI Dashboard?
Step 1: Define KPIs
First, identify critical manufacturing KPIs aligned with business goals.
Step 2: Prepare Excel Data
Next, structure the Excel sheets:
- Actual values
- Targets
- KPI definitions
Step 3: Load Data into Power BI
Import Excel files into Power BI Desktop.
Step 4: Build Relationships
Connect tables using KPI name and date fields.
Step 5: Create Measures
Develop calculations for:
- Target vs Actual %
- CY vs PY %
- MTD and YTD metrics
Step 6: Design Visualizations
Create cards, tables, and combo charts.
Step 7: Publish Dashboard
Finally, publish reports for organizational access.
How Does Power BI Enhance Manufacturing Analytics?
Power BI provides several advantages compared to traditional tools.
- Interactive filtering
- Dynamic visuals
- Automated calculations
- Drill-through analysis
- Real-time updates
- Easy sharing across teams
Therefore, manufacturers gain a modern analytics environment without complex software development.
Best Practices for the Battery Manufacturing KPI Dashboard
To achieve maximum value, organizations should follow proven practices.
Define Clear KPIs
Choose measurable KPIs aligned with production goals.
Maintain Data Accuracy
Update Excel data regularly to ensure reliable insights.
Use Consistent Units
Standardize measurement units across departments.
Review KPIs Monthly
Conduct regular performance reviews.
Focus on Actionable Metrics
Avoid tracking unnecessary indicators.
Train Users Properly
Ensure teams understand dashboard interpretation.
Automate Data Updates
Reduce manual entry whenever possible.
How Does Trend Analysis Improve Manufacturing Decisions?
Trend analysis allows managers to:
- Predict production outcomes
- Detect seasonal patterns
- Evaluate improvement initiatives
- Optimize resource allocation
Because trends reveal performance direction, leaders plan proactively instead of reacting late.
Future of KPI Dashboards in Battery Manufacturing
As battery demand increases globally, analytics will become more important.
Future dashboards will include:
- Real-time IoT integration
- AI-driven forecasting
- Predictive maintenance analytics
- Automated anomaly detection
- Cloud-based collaboration
Therefore, organizations that adopt dashboards today prepare for smart manufacturing tomorrow.
Conclusion
Battery manufacturing requires precision, efficiency, and continuous monitoring. Traditional reporting methods cannot support modern production demands. However, the Battery Manufacturing KPI Dashboard in Power BI provides a powerful solution.
By combining structured Excel data with interactive Power BI visuals, organizations gain complete performance visibility. Managers track targets, analyze trends, and identify improvement opportunities instantly. As a result, companies improve productivity, reduce operational risks, and make faster data-driven decisions.
In today’s competitive manufacturing environment, adopting a KPI dashboard no longer remains optional—it becomes a strategic necessity.
Frequently Asked Questions (FAQs)
What is a Battery Manufacturing KPI Dashboard?
A Battery Manufacturing KPI Dashboard is a Power BI report that tracks manufacturing performance using key performance indicators such as production efficiency, quality, and target achievement.
Why should manufacturers use Power BI for KPI tracking?
Power BI provides interactive visuals, automated calculations, and real-time analysis, which helps organizations make faster and smarter decisions.
What data source does the dashboard use?
The dashboard uses an Excel file containing Actual data, Target data, and KPI definitions.
What does LTB and UTB mean?
- LTB (Lower the Better): Lower values indicate better performance.
- UTB (Upper the Better): Higher values indicate better performance.
Can beginners use this dashboard?
Yes. Since users only update Excel sheets, they do not need advanced Power BI knowledge.
How often should KPI data be updated?
Organizations should update data monthly or weekly depending on operational requirements.
Can this dashboard support other industries?
Yes. You can customize KPI definitions and reuse the dashboard structure for different industries.
Visit our YouTube channel to learn step-by-step video tutorials
Watch the step-by-step video tutorial:
Click to buy Battery Manufacturing KPI Dashboard in Power BI