The renewable energy industry continues to grow rapidly across the world. As countries invest heavily in clean energy, wind turbine manufacturers face increasing pressure to improve productivity, reduce costs, and maintain high-quality standards. However, managing manufacturing performance using scattered spreadsheets and manual reports often creates confusion and delays decision-making.
Therefore, organizations need a centralized and intelligent analytics solution that converts manufacturing data into meaningful insights.
This is exactly where the Wind Turbine Manufacturing KPI Dashboard in Power BI becomes essential.
Click to Purchases Wind Turbine Manufacturing KPI Dashboard in Power BI
A Wind Turbine Manufacturing KPI Dashboard helps manufacturers monitor operational performance, track production efficiency, compare targets with actual results, and analyze trends using interactive visualizations. Moreover, Power BI transforms complex production data into easy-to-understand dashboards that support faster and smarter decisions.
In this comprehensive guide, you will learn everything about the Wind Turbine Manufacturing KPI Dashboard in Power BI, including features, dashboard structure, benefits, implementation steps, best practices, and frequently asked questions.
What Is a Wind Turbine Manufacturing KPI Dashboard in Power BI?
A Wind Turbine Manufacturing KPI Dashboard in Power BI is an interactive reporting solution designed to monitor manufacturing performance using Key Performance Indicators (KPIs).
Instead of reviewing multiple reports separately, managers can analyze all performance metrics in one centralized dashboard. As a result, teams quickly identify production gaps and take corrective actions.
This ready-to-use dashboard captures data from an Excel file and converts it into visual analytics such as:
-
KPI performance cards
-
Trend charts
-
Target vs Actual comparisons
-
Year-over-Year analysis
-
KPI definition drill-through views
Because Power BI updates visuals dynamically, decision-makers always work with current performance data.
Why Do Wind Turbine Manufacturers Need KPI Dashboards?
Wind turbine manufacturing involves complex processes such as blade production, tower assembly, gearbox manufacturing, quality inspection, logistics coordination, and installation readiness. Therefore, performance monitoring becomes critical.
Without structured KPI tracking:
-
Production delays increase
-
Cost overruns occur frequently
-
Quality issues remain unnoticed
-
Teams struggle to align with targets
However, a KPI dashboard solves these challenges by providing real-time visibility.
Key Reasons Organizations Use KPI Dashboards
-
Monitor manufacturing efficiency continuously
-
Compare performance against targets
-
Detect operational issues early
-
Improve resource utilization
-
Support data-driven management decisions
Consequently, companies gain better control over manufacturing operations.
Click to Purchases Wind Turbine Manufacturing KPI Dashboard in Power BI
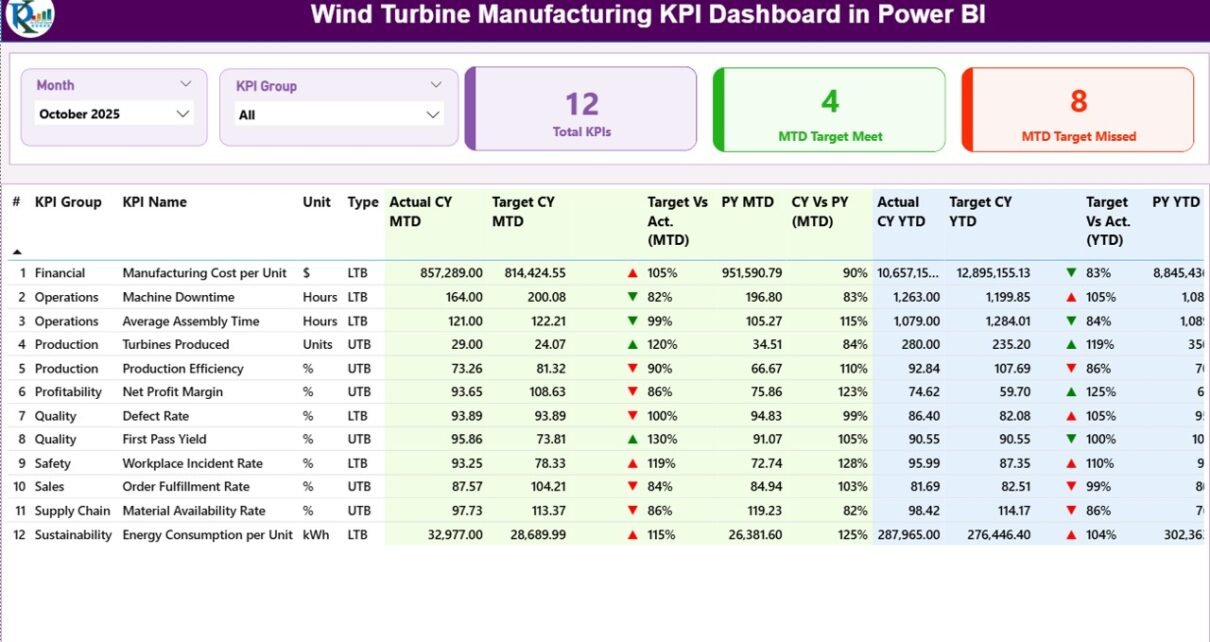
Overview of the Wind Turbine Manufacturing KPI Dashboard Structure
The dashboard contains three powerful pages within the Power BI Desktop application. Each page focuses on a specific analytical purpose.
1. Summary Page – How Does It Provide Instant Performance Insights?
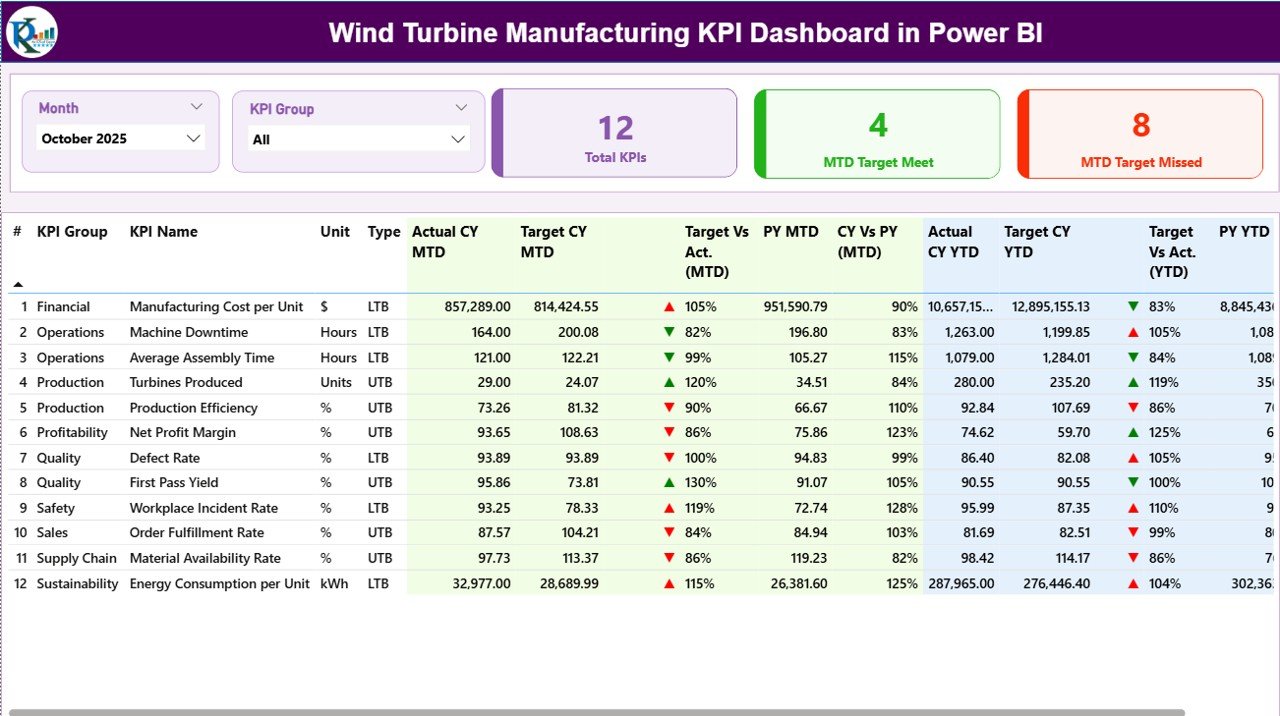
The Summary Page acts as the main control center of the dashboard. Users immediately understand overall KPI performance when they open this page.
Top Section Features
At the top, the dashboard includes interactive slicers:
-
Month Slicer – Filters data by selected month
-
KPI Group Slicer – Filters KPIs by category
Because slicers update visuals instantly, users analyze performance quickly without manual calculations.
KPI Performance Cards
The dashboard displays three important KPI cards:
-
Total KPIs Count – Shows total monitored KPIs
-
MTD Target Meet Count – KPIs achieving monthly targets
-
MTD Target Missed Count – KPIs falling behind targets
These indicators provide a quick health check of manufacturing performance.
Detailed KPI Performance Table
Below the cards, the dashboard presents a comprehensive KPI table containing detailed analytics.
KPI Information Columns
-
KPI Number – Sequential identifier
-
KPI Group – KPI category or department
-
KPI Name – Performance indicator name
-
Unit – Measurement unit
-
Type –
-
LTB (Lower the Better)
-
UTB (Upper the Better)
-
Monthly Performance Metrics (MTD)
The dashboard tracks Month-To-Date performance using multiple metrics:
-
Actual CY MTD – Current year actual value
-
Target CY MTD – Current year target value
-
MTD Icon – Visual indicator:
-
▲ Green = Target achieved
-
▼ Red = Target missed
-
-
Target vs Actual (MTD)
Formula:
Actual ÷ Target -
PY MTD – Previous year same period performance
-
CY vs PY (MTD)
Formula:
Current Year MTD ÷ Previous Year MTD
Therefore, managers instantly compare present performance with historical results.
Year-To-Date Performance Metrics (YTD)
Similarly, the dashboard evaluates long-term progress:
-
Actual CY YTD – Current year cumulative actuals
-
Target CY YTD – Current year cumulative targets
-
YTD Icon – Performance status indicator
-
Target vs Actual (YTD) – Achievement percentage
-
PY YTD – Previous year YTD value
-
CY vs PY (YTD) – Year-over-year comparison
As a result, leadership teams monitor both short-term and long-term manufacturing performance.
Click to Purchases Wind Turbine Manufacturing KPI Dashboard in Power BI
2. KPI Trend Page – How Can You Analyze Performance Trends?
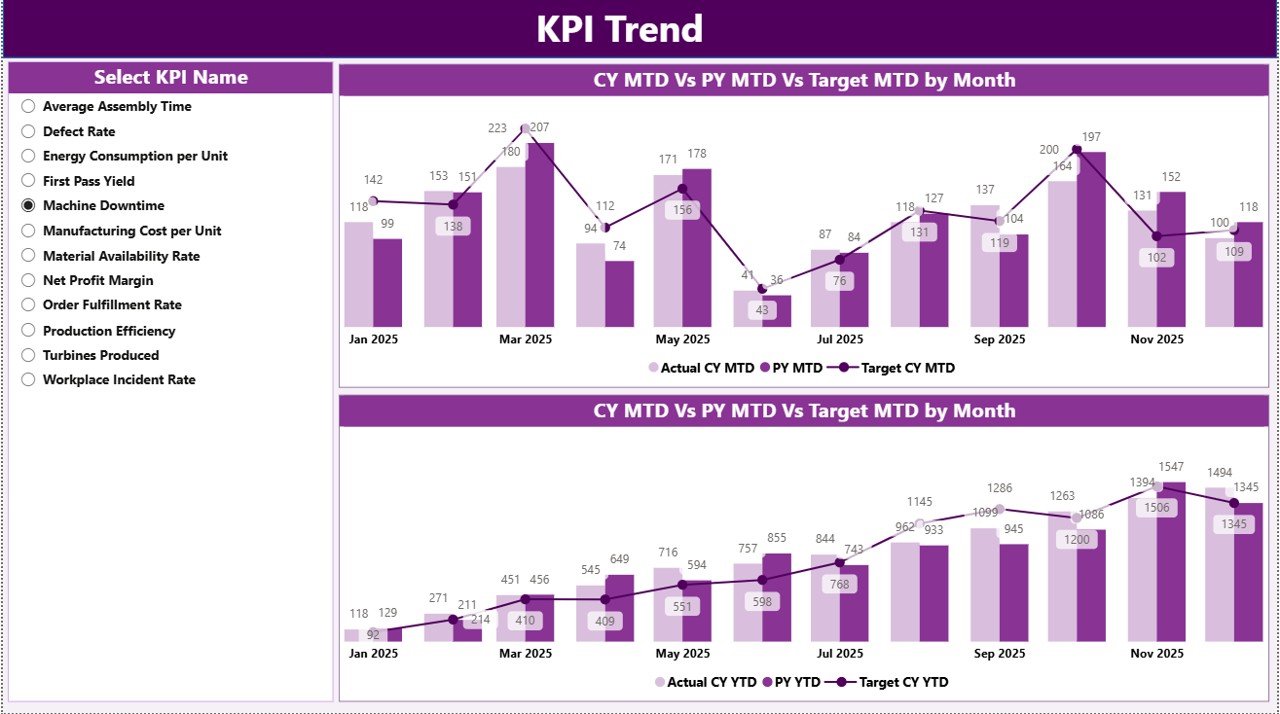
The KPI Trend Page focuses on historical performance analysis.
Instead of viewing static numbers, users understand performance movement over time.
Key Features
-
Two Combo Charts
-
Comparison between:
-
Current Year Actual
-
Previous Year Actual
-
Target Values
-
Charts analyze:
-
MTD Trends
-
YTD Trends
A slicer on the left allows users to select any KPI dynamically.
Therefore, managers easily identify:
-
Seasonal production changes
-
Performance improvement patterns
-
Declining KPIs requiring attention
Trend analysis helps organizations move from reactive decisions to proactive planning.
3. KPI Definition Page – Why Is KPI Transparency Important?
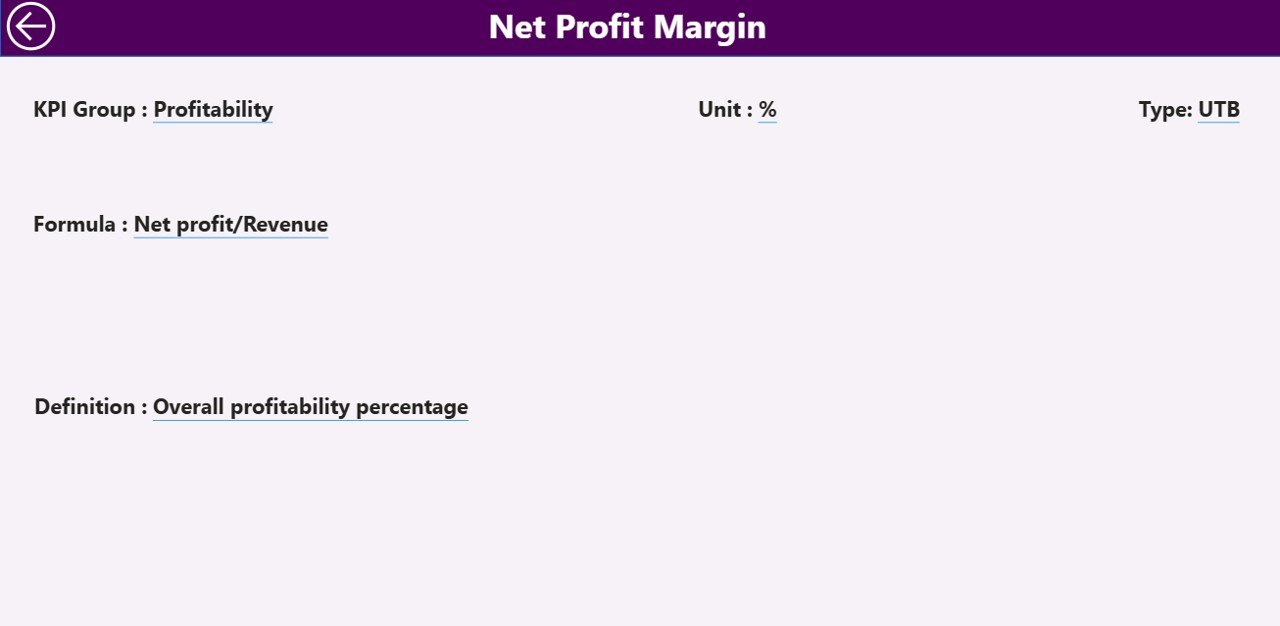
The KPI Definition Page acts as a hidden drill-through page.
Users access it directly from the Summary Page.
Information Available
-
KPI Formula
-
KPI Definition
-
Measurement logic
-
KPI Type (LTB or UTB)
Because every KPI includes a clear explanation, teams avoid confusion and maintain consistent performance evaluation standards.
A Back Button allows users to return to the main page instantly.
What Data Source Does the Dashboard Use?
Click to Purchases Wind Turbine Manufacturing KPI Dashboard in Power BI
The dashboard uses an Excel file as the data source. This design ensures flexibility because most organizations already maintain Excel-based operational data.
The Excel file contains three worksheets.
1. Input_Actual Sheet
Users enter actual KPI values here.
Required fields:
-
KPI Name
-
Month (First date of month)
-
MTD Numbers
-
YTD Numbers
Updating this sheet refreshes dashboard visuals automatically.
2. Input_Target Sheet
This sheet captures target values.
Fields include:
-
KPI Name
-
Month
-
Target MTD
-
Target YTD
Therefore, organizations easily compare planned vs achieved performance.
3. KPI Definition Sheet
This sheet stores KPI metadata:
-
KPI Number
-
KPI Group
-
KPI Name
-
Unit
-
Formula
-
Definition
-
KPI Type (LTB or UTB)
This structured setup ensures data consistency across reports.
Advantages of Wind Turbine Manufacturing KPI Dashboard in Power BI
Implementing this dashboard provides several operational and strategic benefits.
✅ Improved Decision Making
Managers access real-time insights instead of waiting for manual reports.
✅ Centralized Performance Monitoring
All manufacturing KPIs appear in one unified platform.
✅ Faster Problem Identification
Visual indicators highlight underperforming KPIs immediately.
✅ Better Production Planning
Trend analysis helps forecast manufacturing outcomes.
✅ Increased Accountability
Teams clearly understand performance expectations.
✅ Historical Performance Comparison
Year-over-year analysis supports long-term strategy.
✅ Reduced Reporting Time
Automation eliminates repetitive reporting tasks.
How Does the Dashboard Improve Manufacturing Efficiency?
The dashboard directly impacts operational efficiency.
Production Monitoring
Managers track output performance daily and adjust schedules quickly.
Quality Control
KPI tracking identifies defect trends early.
Resource Optimization
Data insights help allocate labor and materials effectively.
Performance Alignment
Departments work toward shared goals using measurable KPIs.
Consequently, manufacturing operations become more predictable and efficient.
Best Practices for the Wind Turbine Manufacturing KPI Dashboard in Power BI
To achieve maximum value, organizations should follow proven best practices.
1. Define Clear KPIs
Choose measurable and actionable indicators aligned with manufacturing goals.
2. Maintain Data Accuracy
Update Excel input sheets regularly to ensure reliable insights.
3. Use Consistent KPI Definitions
Document formulas and definitions clearly.
4. Review KPIs Monthly
Regular reviews help detect performance issues early.
5. Focus on Actionable Metrics
Avoid tracking unnecessary KPIs that do not influence decisions.
6. Train Users Properly
Ensure managers understand slicers, drill-through features, and charts.
7. Monitor Trends, Not Just Numbers
Always analyze performance direction over time.
How to Implement the Wind Turbine Manufacturing KPI Dashboard?
Organizations can implement the dashboard using a structured approach.
Step 1: Identify Manufacturing KPIs
Examples include:
-
Production Output Rate
-
Defect Rate
-
Assembly Time
-
Equipment Utilization
-
Energy Consumption
Step 2: Prepare Excel Data
Fill Actual and Target sheets with accurate data.
Step 3: Load Data into Power BI
Click to Purchases Wind Turbine Manufacturing KPI Dashboard in Power BI
Connect Excel files using Power BI data connectors.
Step 4: Validate KPI Calculations
Verify formulas and KPI types.
Step 5: Publish Dashboard
Share reports with management teams.
Step 6: Schedule Regular Updates
Refresh data weekly or monthly.
Common KPIs Used in Wind Turbine Manufacturing
Manufacturers often track KPIs across multiple operational areas.
Production KPIs
-
Turbine units produced
-
Production cycle time
-
Assembly efficiency
Quality KPIs
-
Defect percentage
-
Rework rate
-
Inspection pass rate
Operational KPIs
-
Machine downtime
-
Capacity utilization
-
Maintenance compliance
Financial KPIs
-
Manufacturing cost per unit
-
Budget variance
-
Productivity index
Tracking these KPIs ensures balanced performance monitoring.
How Does Power BI Enhance Manufacturing Analytics?
Power BI provides several advantages compared to traditional reporting tools.
-
Interactive dashboards
-
Dynamic filtering
-
Automated calculations
-
Visual storytelling
-
Real-time updates
Moreover, users explore data without technical expertise.
Therefore, analytics becomes accessible to operational teams.
Challenges Without a KPI Dashboard
Organizations that avoid structured dashboards often face:
-
Delayed decision-making
-
Data inconsistencies
-
Manual reporting errors
-
Poor performance visibility
-
Inefficient resource planning
However, implementing a KPI dashboard eliminates these limitations.
Future of KPI Dashboards in Renewable Energy Manufacturing
As renewable energy expands, manufacturers increasingly rely on data analytics.
Future dashboards will include:
-
AI-driven predictions
-
IoT machine integration
-
Real-time sensor analytics
-
Automated anomaly detection
Therefore, KPI dashboards will evolve into intelligent decision systems.
Conclusion
The Wind Turbine Manufacturing KPI Dashboard in Power BI provides a powerful and structured solution for monitoring manufacturing performance. Instead of relying on fragmented reports, organizations gain a centralized platform that delivers actionable insights.
The dashboard combines KPI tracking, trend analysis, and performance comparison into one easy-to-use interface. As a result, managers identify issues faster, improve production efficiency, and align operations with strategic goals.
In today’s competitive renewable energy market, data-driven manufacturing no longer remains optional. Organizations that adopt KPI dashboards achieve better transparency, stronger performance control, and sustainable operational growth.
Frequently Asked Questions (FAQs)
What is a Wind Turbine Manufacturing KPI Dashboard?
It is a Power BI dashboard that tracks manufacturing performance using KPIs such as production efficiency, targets, and trend analysis.
Why should manufacturers use Power BI for KPI tracking?
Power BI provides interactive visuals, automated calculations, and real-time analytics that simplify performance monitoring.
What data source does this dashboard use?
The dashboard uses an Excel file containing Actual data, Target data, and KPI Definitions.
What does LTB and UTB mean?
-
LTB (Lower the Better) – Lower values indicate better performance.
-
UTB (Upper the Better) – Higher values indicate better performance.
Can beginners use this dashboard?
Yes. The dashboard uses slicers and simple navigation, so users analyze KPIs without advanced technical skills.
How often should KPI data be updated?
Organizations typically update data monthly, although weekly updates provide deeper operational insights.
Does the dashboard support historical comparison?
Yes. It compares current performance with previous year values using MTD and YTD analysis.
How does the KPI Trend page help management?
It shows performance trends over time, helping leaders predict outcomes and take proactive actions.
Visit our YouTube channel to learn step-by-step video tutorials