The fitness industry continues to grow rapidly. Today, fitness studios manage memberships, trainers, classes, revenues, and customer satisfaction simultaneously. However, many studio owners still depend on manual spreadsheets and scattered reports. As a result, they struggle to understand performance trends and make timely decisions.
So, how can fitness studio managers monitor business performance clearly without investing in expensive software?
The answer lies in the Fitness Studios Dashboard in Excel.
Click to Purchases Fitness Studios Dashboard in Excel
A well-designed Fitness Studios Dashboard converts raw operational data into meaningful visual insights. Moreover, it helps studio owners track memberships, analyze class performance, monitor trainer ratings, and optimize revenue using one centralized Excel solution.
In this comprehensive guide, you will learn everything about the Fitness Studios Dashboard in Excel, including dashboard structure, features, benefits, analytics capabilities, best practices, and frequently asked questions.
What Is a Fitness Studios Dashboard in Excel?
A Fitness Studios Dashboard in Excel is an interactive reporting tool designed to analyze fitness studio operations using structured data, Pivot Tables, and dynamic charts.
Instead of reviewing multiple sheets manually, managers can instantly view performance metrics through visual dashboards. Consequently, decision-making becomes faster and more accurate.
This dashboard tracks important business areas such as:
-
Studio performance
-
Customer ratings
-
Membership trends
-
Session revenue
-
Class capacity utilization
-
Monthly growth patterns
-
Trainer effectiveness
Because Excel remains flexible and widely available, businesses can implement this dashboard without technical complexity.
Why Do Fitness Studios Need a Dashboard?
Fitness studios generate large volumes of operational data every day. For example, studios record attendance, memberships, bookings, payments, and customer feedback continuously. Without structured analytics, managers miss important insights.
Common Challenges Without a Dashboard
-
Difficulty tracking revenue performance
-
Lack of visibility into trainer effectiveness
-
Poor class scheduling decisions
-
Underutilized studio capacity
-
Manual reporting delays
-
Inconsistent performance evaluation
However, when studios adopt an Excel dashboard, they gain complete operational visibility.
Key Features of the Fitness Studios Dashboard in Excel
The Fitness Studios Dashboard in Excel provides a ready-to-use analytical environment. Furthermore, it allows users to navigate easily between different analytical pages.
Page Navigator
Located on the left side, the Page Navigator enables quick switching between dashboard pages. Therefore, users can analyze different business areas without searching through worksheets.
Dashboard Structure: 5 Analytical Pages Explained
The dashboard contains five powerful analytical pages, each focusing on a specific performance dimension.
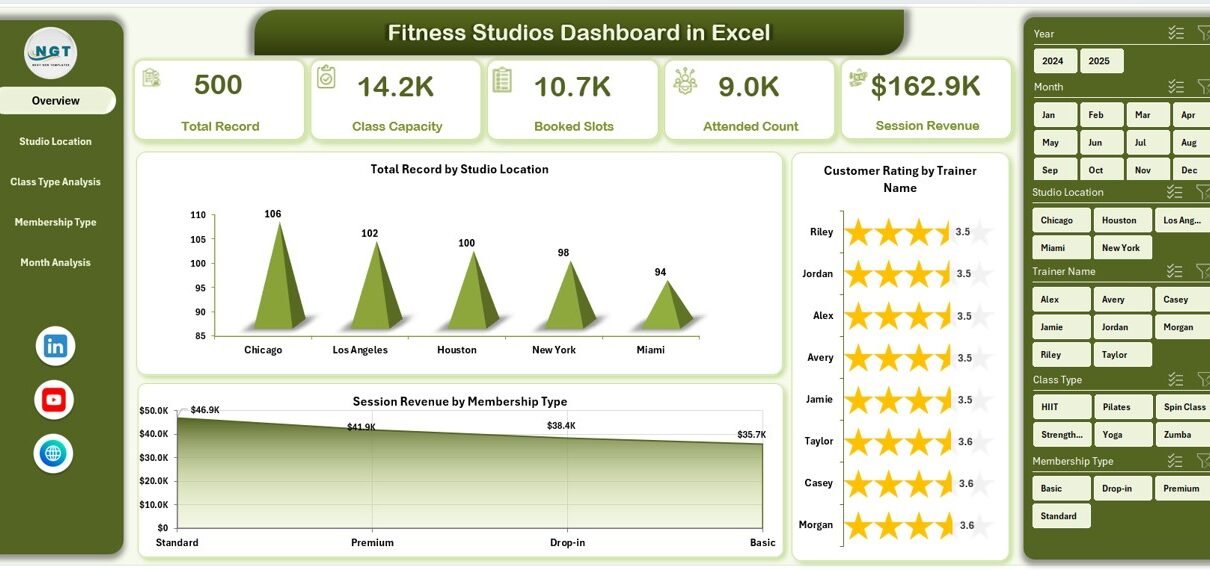
1. Overview Page – The Central Performance Hub
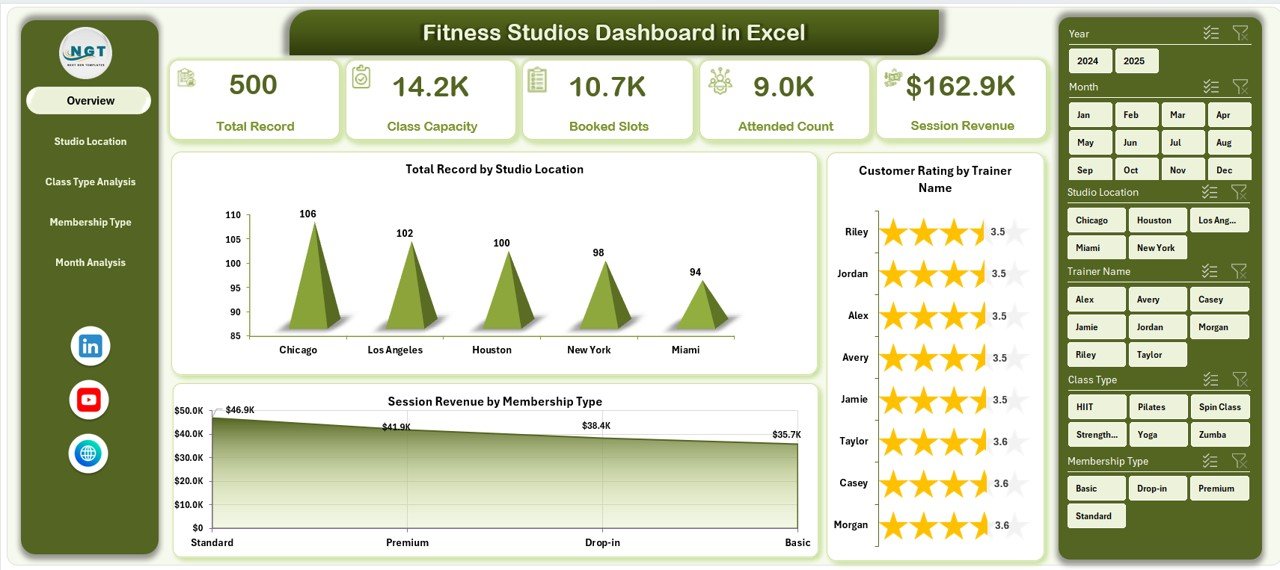
The Overview Page acts as the main control center of the dashboard.
Key Elements
-
Right-side slicers for dynamic filtering
-
Four KPI cards showing key summary indicators
-
Interactive charts displaying business performance
Charts Included
-
Total Records by Studio Location
-
Customer Rating by Trainer Name
-
Session Revenue by Membership Type
-
Performance Summary Visualization
Why Is the Overview Page Important?
Because managers need quick insights, this page provides an instant snapshot of operations. Additionally, users can filter results instantly using slicers.
2. Studio Location Analysis – How Do Different Locations Perform?
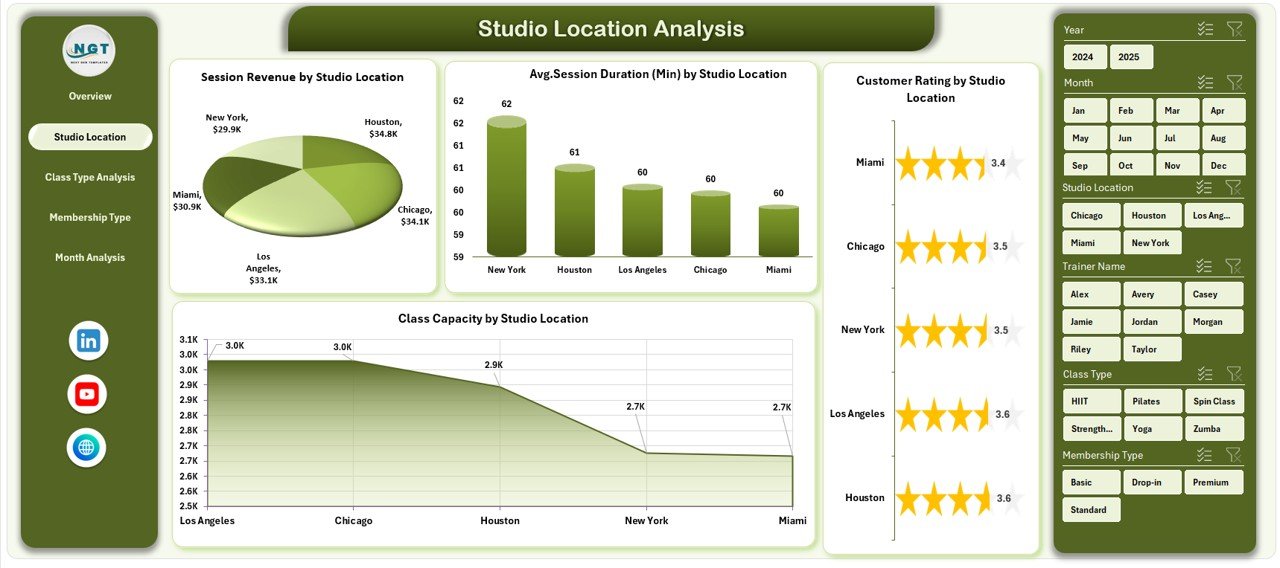
Fitness businesses often operate multiple branches. Therefore, location-based analysis becomes essential.
Click to Purchases Fitness Studios Dashboard in Excel
Charts Included
-
Customer Rating by Studio Location
-
Session Revenue by Studio Location
-
Average Session Duration by Studio Location
-
Class Capacity by Studio Location
Insights You Can Gain
-
Identify high-performing locations
-
Compare revenue across studios
-
Detect underperforming branches
-
Improve resource allocation
As a result, studio owners can make data-driven expansion decisions.
3. Class Type Analysis – Which Classes Generate Maximum Value?
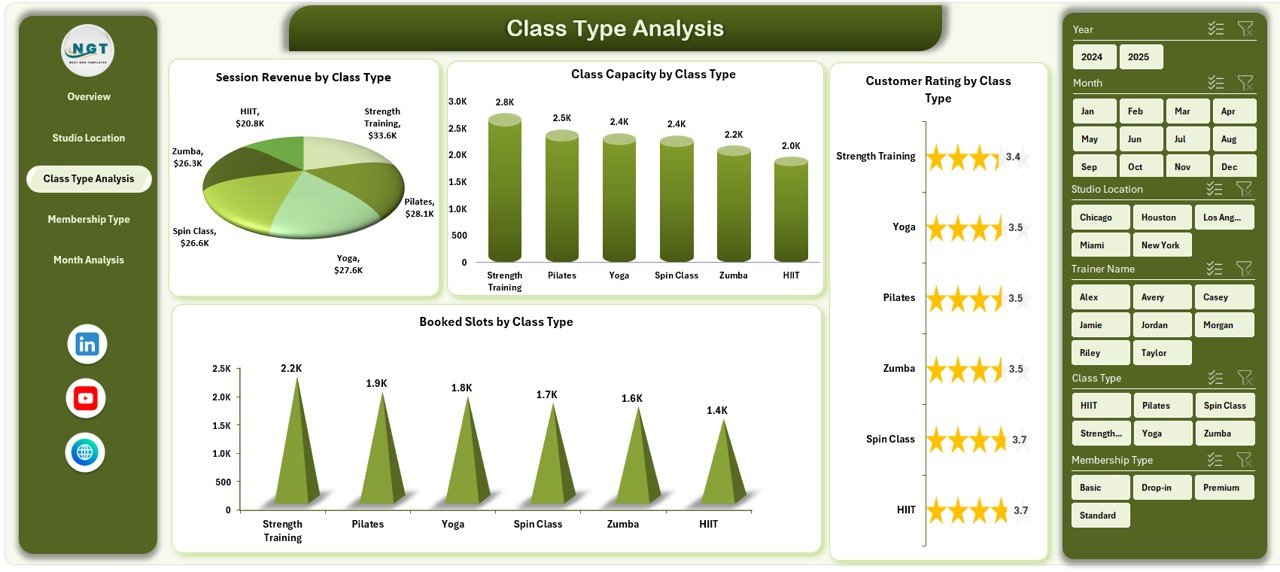
Different class types attract different audiences. Hence, analyzing class performance helps improve scheduling and profitability.
Charts Included
-
Customer Rating by Class Type
-
Session Revenue by Class Type
-
Class Capacity by Class Type
-
Booked Slots by Class Type
Business Benefits
-
Understand popular classes
-
Optimize class schedules
-
Increase attendance rates
-
Improve customer satisfaction
Therefore, studios can focus on high-demand fitness programs.
4. Membership Type Analysis – Which Membership Plans Work Best?
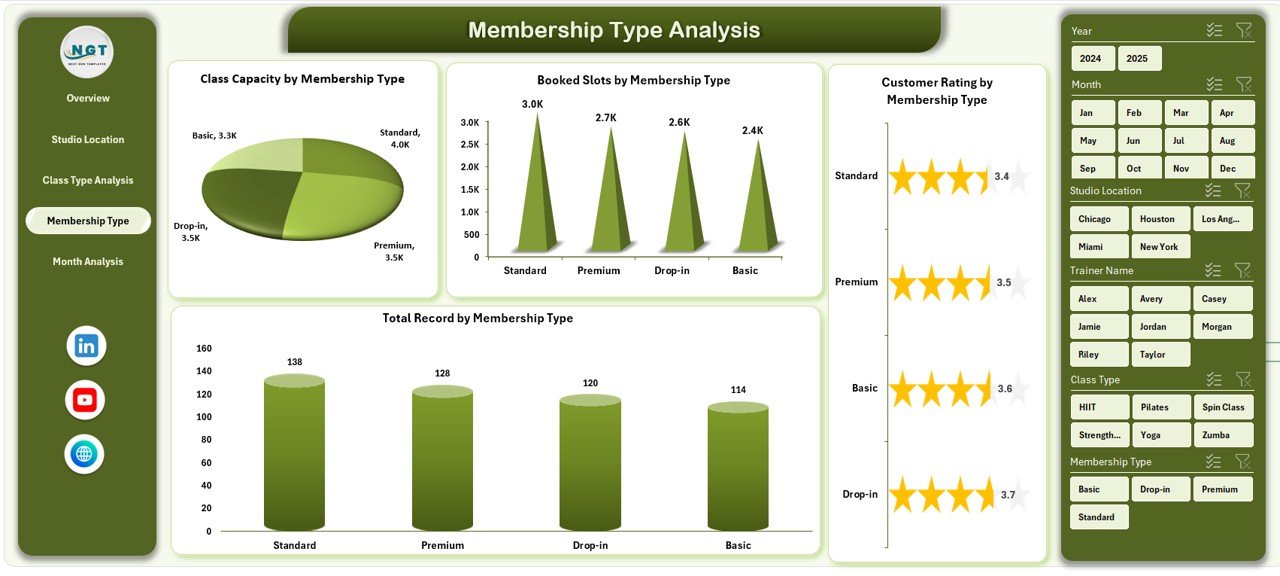
Membership plans directly influence revenue stability. Consequently, tracking membership performance becomes crucial.
Charts Included
-
Customer Rating by Membership Type
-
Total Records by Membership Type
-
Class Capacity by Membership Type
-
Booked Slots by Membership Type
Key Insights
-
Identify profitable membership plans
-
Evaluate member engagement
-
Improve pricing strategies
-
Increase retention rates
Moreover, studios can design better membership packages based on real data.
5. Month Analysis – How Does Performance Change Over Time?
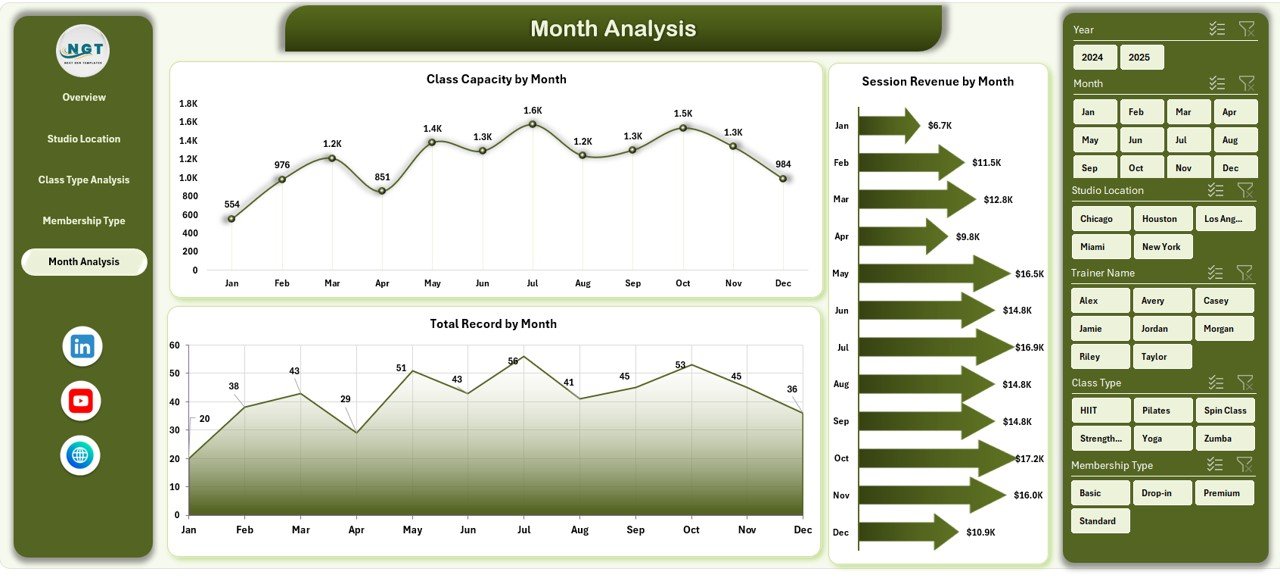
Trend analysis helps businesses understand growth patterns.
Charts Included
-
Total Records by Month
-
Class Capacity by Month
-
Session Revenue by Month
Why Monthly Analysis Matters
Because seasonal trends affect attendance, monthly insights help studios:
-
Forecast demand
-
Plan marketing campaigns
-
Adjust staffing levels
-
Improve revenue planning
Data Sheet and Support Sheet – The Dashboard Foundation
Click to Purchases Fitness Studios Dashboard in Excel
Data Sheet
The Data Sheet stores all operational records such as:
-
Studio location
-
Trainer name
-
Class type
-
Membership type
-
Session duration
-
Revenue
-
Customer ratings
-
Booking details
-
Date and month information
Since Pivot Tables use this data, updating records automatically refreshes the dashboard.
Support Sheet
The Support Sheet manages:
-
Lookup tables
-
Dropdown lists
-
Calculations
-
Helper columns
Thus, it ensures smooth dashboard functionality.
What Type of Analysis Can You Perform Using This Dashboard?
The Fitness Studios Dashboard allows multi-dimensional analysis.
Operational Analysis
-
Attendance trends
-
Booking utilization
-
Session duration tracking
Financial Analysis
-
Revenue by membership type
-
Revenue by location
-
Monthly revenue growth
Customer Experience Analysis
-
Trainer performance ratings
-
Class satisfaction levels
-
Member engagement trends
Capacity Analysis
-
Class utilization
-
Available vs booked slots
-
Studio efficiency
Advantages of Fitness Studios Dashboard in Excel
A structured dashboard delivers multiple business advantages.
1. Centralized Data Management
All performance metrics appear in one place. Therefore, managers avoid switching between reports.
2. Faster Decision Making
Visual charts simplify complex data. As a result, decisions become quicker.
3. Improved Revenue Tracking
Managers monitor income streams easily and identify growth opportunities.
4. Better Customer Experience
Customer ratings highlight improvement areas.
5. Cost-Effective Solution
Excel eliminates the need for expensive analytics software.
6. Real-Time Insights
Updating data instantly refreshes all reports.
7. Easy Customization
Businesses can modify KPIs based on their needs.
How Does This Dashboard Improve Fitness Studio Operations?
Improved Scheduling
Managers schedule classes based on demand trends.
Enhanced Trainer Management
Performance ratings help evaluate trainers objectively.
Increased Member Retention
Studios identify engagement patterns quickly.
Revenue Optimization
High-performing services receive more focus.
Consequently, studios achieve sustainable growth.
Best Practices for the Fitness Studios Dashboard in Excel
To achieve maximum value, follow these best practices.
Maintain Clean Data
Always standardize naming conventions for locations and class types.
Update Data Regularly
Frequent updates ensure accurate insights.
Use Slicers Effectively
Apply filters to analyze specific segments.
Monitor KPIs Weekly
Regular review improves operational control.
Avoid Manual Formula Changes
Keep formulas protected to prevent errors.
Validate Data Entries
Use dropdown lists to maintain consistency.
Review Trends Monthly
Monthly evaluation helps strategic planning.
How to Implement the Fitness Studios Dashboard Step-by-Step?
Click to Purchases Fitness Studios Dashboard in Excel
Step 1: Collect Operational Data
Gather membership, booking, and revenue information.
Step 2: Structure the Data Sheet
Organize data into tabular format.
Step 3: Create Pivot Tables
Summarize performance metrics.
Step 4: Build Pivot Charts
Design visual representations for insights.
Step 5: Add Slicers
Enable interactive filtering.
Step 6: Design Dashboard Layout
Arrange charts logically across pages.
Step 7: Test Filters and Navigation
Ensure seamless user experience.
Who Can Benefit from This Dashboard?
This dashboard supports multiple roles:
-
Fitness studio owners
-
Operations managers
-
Franchise managers
-
Trainers and coordinators
-
Business analysts
-
Gym consultants
Because it simplifies analytics, both small studios and large fitness chains benefit equally.
Common Mistakes to Avoid While Using Fitness Dashboards
-
Ignoring data validation
-
Overloading charts with information
-
Not reviewing KPIs regularly
-
Using inconsistent data formats
-
Avoiding trend analysis
Therefore, disciplined dashboard usage remains essential.
Future Enhancements You Can Add
You can expand the dashboard further by adding:
-
Trainer attendance tracking
-
Profit margin analysis
-
Customer retention KPIs
-
Automated data import
-
Power Query integration
-
Forecasting models
Hence, the dashboard grows with business needs.
Conclusion
The Fitness Studios Dashboard in Excel provides a powerful yet simple way to manage fitness business performance. Instead of relying on scattered spreadsheets, studio owners gain centralized analytics that reveal actionable insights.
Moreover, the dashboard improves decision-making, enhances customer satisfaction, and optimizes operational efficiency. Because Excel offers flexibility and familiarity, businesses implement this solution quickly without additional costs.
Ultimately, fitness studios that adopt data-driven management achieve stronger growth, better member engagement, and improved profitability.
Frequently Asked Questions (FAQs)
1. What is a Fitness Studios Dashboard in Excel used for?
It helps fitness studios track performance metrics such as revenue, customer ratings, memberships, and class utilization using interactive visuals.
2. Do I need advanced Excel skills to use this dashboard?
No. The dashboard works using slicers and Pivot Charts, so basic Excel knowledge remains sufficient.
3. Can I customize the dashboard?
Yes. You can add KPIs, charts, or filters based on business requirements.
4. How often should I update the data?
You should update data daily or weekly for accurate insights.
5. Can small fitness studios use this dashboard?
Yes. Both small studios and multi-location fitness businesses benefit from it.
6. Does the dashboard support multiple locations?
Yes. Location-based analysis remains one of its core features.
7. Can this dashboard track trainer performance?
Yes. Customer ratings by trainer help evaluate performance effectively.
Visit our YouTube channel to learn step-by-step video tutorials