Investment management has evolved significantly in recent years. Today, investors, portfolio managers, and financial analysts must track multiple assets, monitor performance continuously, and make quick data-driven decisions. However, managing investments using traditional spreadsheets often creates confusion, delays analysis, and limits visibility.Therefore, organizations and individual investors now prefer dynamic analytics tools that transform raw investment data into meaningful insights. This is exactly where the Investment Management Dashboard in Power BI becomes a powerful solution.The Investment Management Dashboard in Power BI helps users monitor invested capital, track portfolio performance, analyze ROI trends, and evaluate investment health using interactive visuals and automated analytics. Instead of reviewing multiple reports manually, users can access all investment insights from one centralized dashboard.
In this comprehensive guide, you will learn everything about the Investment Management Dashboard in Power BI, including features, dashboard structure, benefits, analysis capabilities, best practices, and frequently asked questions.
Click to buy Investment Management Dashboard in Power BI
What Is an Investment Management Dashboard in Power BI?
An Investment Management Dashboard in Power BI is an interactive financial analytics solution designed to monitor and analyze investment performance using visual reports and real-time calculations.
Instead of relying on static reports, this dashboard converts investment data into dynamic charts, KPIs, and performance indicators. As a result, investors can easily evaluate profitability, diversification, and risk exposure.
The dashboard typically tracks:
- Invested Amount
- Current Portfolio Value
- Return on Investment (ROI)
- Active Investments
- Closed Investments
- Portfolio Performance
- Regional Investment Distribution
- Monthly Investment Trends
Because Power BI supports interactive filtering and drill-down analysis, users can explore investment performance from multiple perspectives instantly.
Why Do Investors Need an Investment Management Dashboard?
Managing investments without structured analytics creates several challenges. For example, investors struggle to identify underperforming assets, compare portfolios, or monitor growth trends.
However, a Power BI dashboard solves these problems effectively.
Key Reasons Investors Use Investment Dashboards
- Centralized investment tracking
- Faster financial decision-making
- Clear visualization of portfolio performance
- Real-time ROI monitoring
- Improved risk assessment
- Better asset allocation planning
Moreover, visual dashboards help both beginners and experienced investors understand financial performance quickly.
Key Features of the Investment Management Dashboard in Power BI
This ready-to-use dashboard includes five analytical pages inside the Power BI Desktop application. Each page focuses on a specific aspect of investment performance.
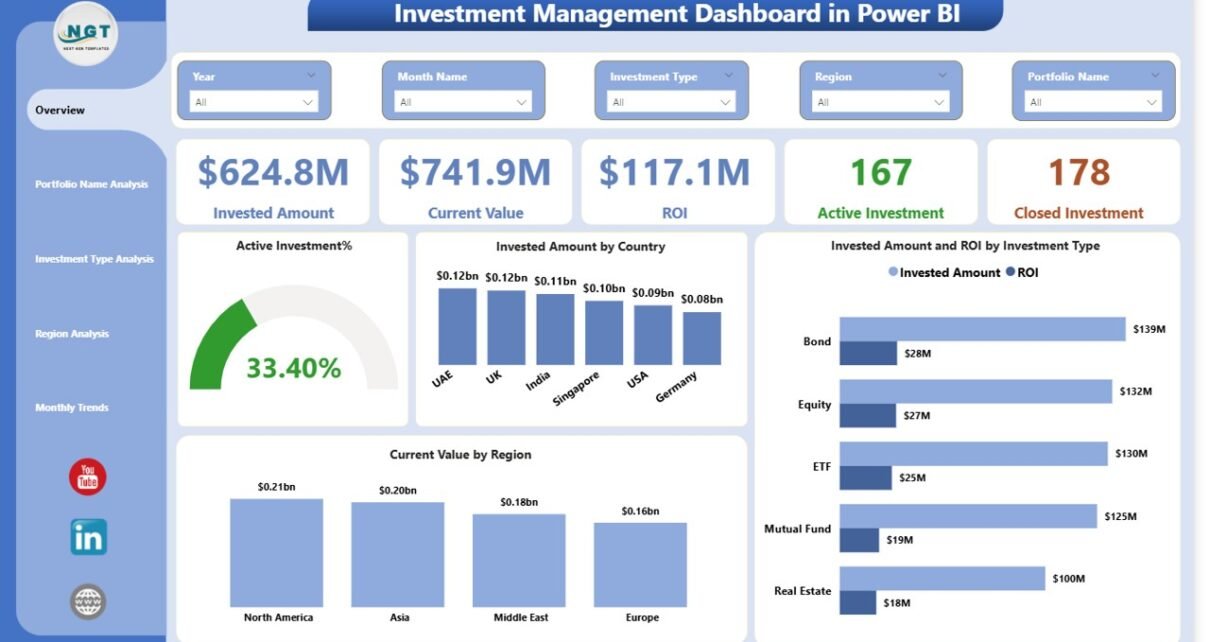
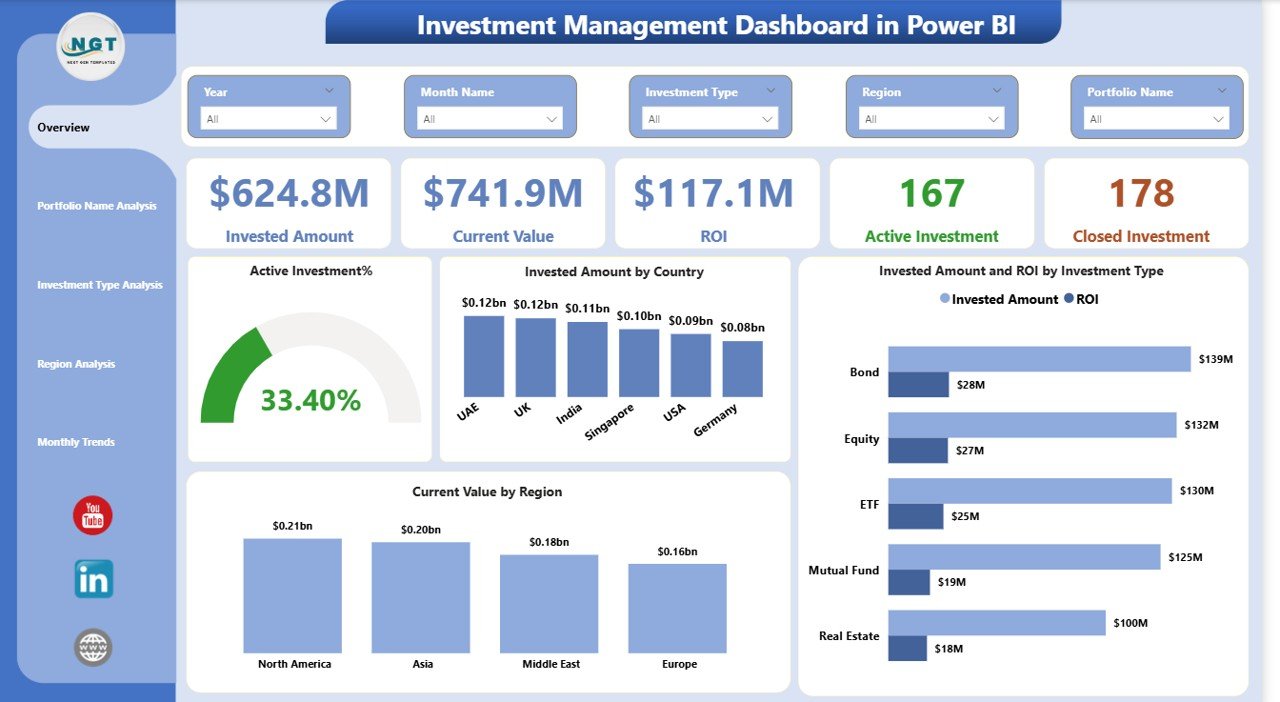
Overview Page – The Central Investment Control Panel
The Overview Page works as the main summary page of the dashboard. It provides a quick snapshot of overall investment performance.
KPI Cards Displayed
The dashboard includes five important KPI cards:
- Invested Amount – Total capital invested
- Current Value – Present portfolio valuation
- ROI – Overall investment return
- Active Investments – Ongoing investments
- Closed Investments – Completed investments
These cards allow users to understand portfolio health instantly.
Charts Available on the Overview Page
- Active Investment %
Shows the proportion of ongoing investments. - Invested Amount by Country
Helps analyze geographic diversification. - Invested Amount by Investment Type
Displays allocation across investment categories. - ROI by Investment Type
Highlights profitable investment segments.
Because slicers appear on this page, users can filter data dynamically based on different conditions.
Click to buy Investment Management Dashboard in Power BI
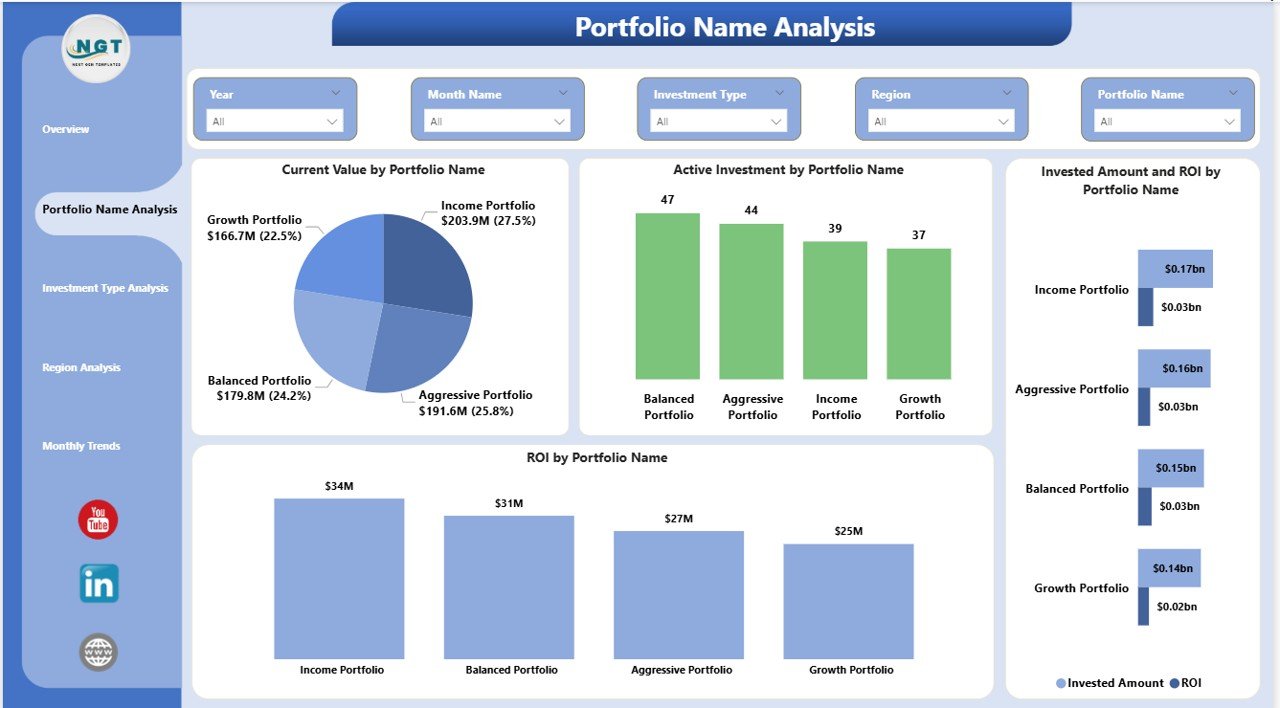
Portfolio Name Analysis – How Does Each Portfolio Perform?
The Portfolio Name Analysis Page focuses on evaluating individual portfolios. Investors often manage multiple portfolios, so this page helps compare performance efficiently.
Charts Included
- Current Value by Portfolio Name
- Active Investment by Portfolio Name
- Invested Amount and ROI by Portfolio Name
- ROI by Portfolio Name
Insights You Can Gain
- Identify top-performing portfolios
- Detect underperforming assets
- Compare portfolio profitability
- Improve diversification strategy
Consequently, portfolio managers can rebalance investments more effectively.
Click to buy Investment Management Dashboard in Power BI
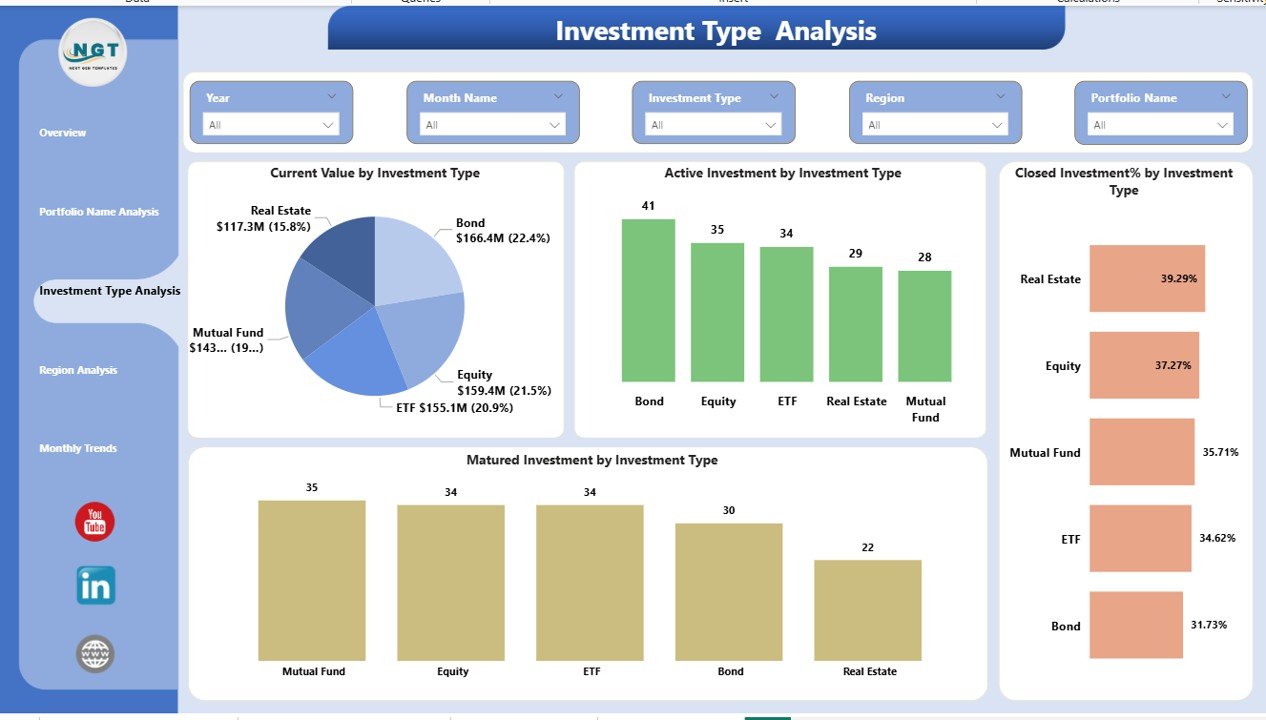
Investment Type Analysis – Which Investment Category Performs Best?
Different investment types behave differently under market conditions. Therefore, analyzing performance by investment type becomes essential.
Charts Available
- Current Value by Investment Type
- Active Investment by Investment Type
- Closed Investment % by Investment Type
- Matured Investment by Investment Type
Analytical Benefits
- Understand category-wise performance
- Monitor maturity distribution
- Evaluate investment lifecycle stages
- Optimize allocation decisions
For example, investors can compare equities, bonds, real estate, or mutual funds instantly.
Click to buy Investment Management Dashboard in Power BI
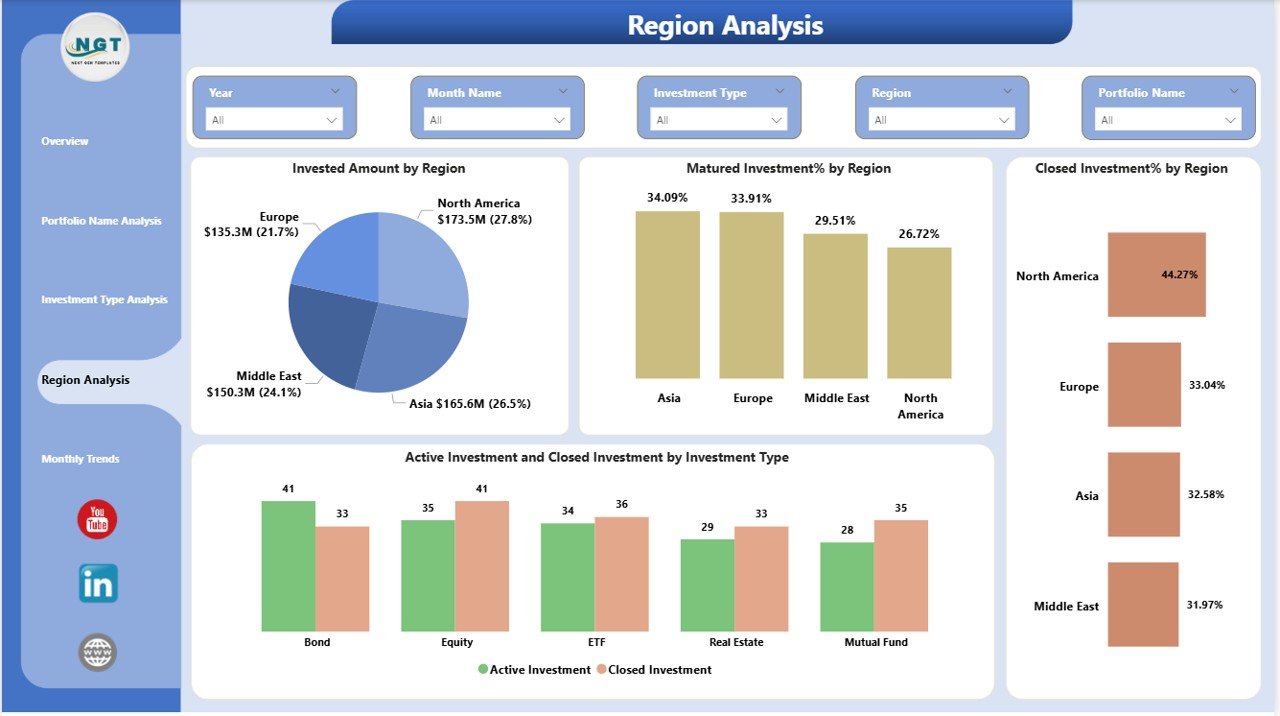
Region Analysis – Where Are Investments Performing Strongly?
Geographical diversification plays a critical role in investment strategy. The Region Analysis Page helps investors analyze performance based on regions.
Charts Included
- Invested Amount by Region
- Matured Investment % by Region
- Closed Investment % by Region
- Active vs Closed Investment by Investment Type
Why Regional Analysis Matters
- Identifies high-performing regions
- Reduces geographic risk exposure
- Supports expansion planning
- Improves international diversification
As markets vary across regions, this analysis provides valuable strategic insights.
Click to buy Investment Management Dashboard in Power BI
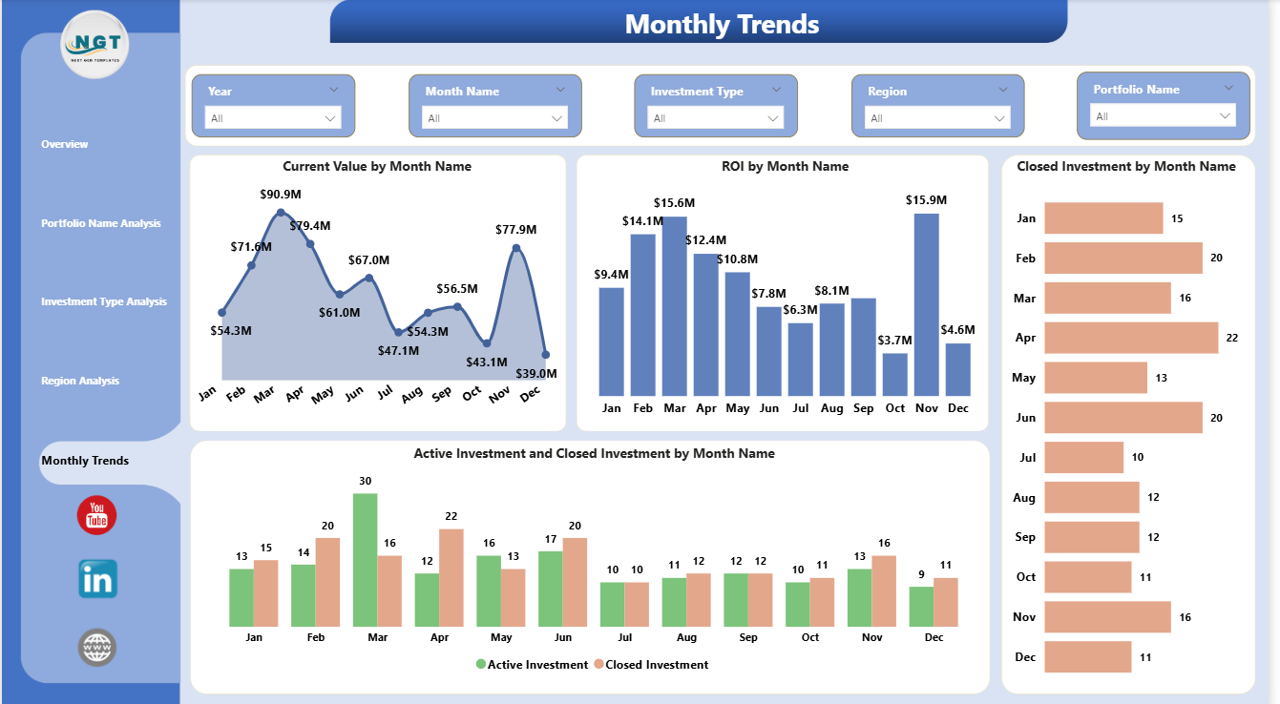
Monthly Trends – How Does Investment Performance Change Over Time?
Trend analysis helps investors understand performance patterns and seasonal behaviors.
The Monthly Trends Page focuses on time-based investment analytics.
Charts Available
- Current Value by Month Name
- ROI by Month Name
- Closed Investment by Month Name
- Active vs Closed Investment by Month Name
Key Insights
- Detect growth trends
- Monitor ROI fluctuations
- Analyze investment cycles
- Forecast future performance
Therefore, investors can plan future strategies based on historical trends.
Click to buy Investment Management Dashboard in Power BI
What Type of Analysis Can You Perform Using This Dashboard?
This dashboard enables multiple levels of investment analysis.
Performance Analysis
- Portfolio profitability tracking
- ROI comparison across investments
- Value growth monitoring
Allocation Analysis
- Investment distribution by type
- Country-wise allocation
- Region-based exposure
Lifecycle Analysis
- Active vs closed investments
- Matured investment tracking
- Investment duration evaluation
Trend Analysis
- Monthly ROI performance
- Portfolio growth patterns
- Market timing insights
Because Power BI supports interactivity, users can drill into details easily.
Advantages of Investment Management Dashboard in Power BI
Using an investment dashboard provides several strategic benefits.
- Real-Time Investment Visibility
Users instantly see performance updates without manual calculations.
- Improved Decision-Making
Visual analytics simplify complex financial data.
- Better Portfolio Diversification
Investors identify concentration risks quickly.
- Time Savings
Automation eliminates repetitive reporting tasks.
- Enhanced Financial Planning
Historical trends help forecast future investments.
- Interactive Reporting
Slicers allow dynamic filtering and deeper analysis.
- Professional Financial Reporting
Dashboards present investment data clearly to stakeholders.
How Does Power BI Improve Investment Analysis?
Power BI adds powerful capabilities that traditional tools cannot match.
Key Power BI Benefits
- Interactive dashboards
- Automated data refresh
- Drill-through analysis
- Dynamic filters and slicers
- Visual storytelling
- Easy sharing and collaboration
As a result, investment analysis becomes faster and more accurate.
Best Practices for the Investment Management Dashboard
To maximize dashboard effectiveness, follow these best practices.
- Maintain Clean Data
Ensure consistent investment records and formats.
- Update Data Regularly
Frequent updates keep analysis accurate.
- Use Meaningful KPIs
Track metrics aligned with investment goals.
- Monitor ROI Frequently
Early detection prevents losses.
- Segment Investments Properly
Categorize investments by type and region.
- Avoid Overloading Visuals
Keep dashboard design simple and clear.
- Use Filters Strategically
Enable users to explore insights quickly.
Who Can Benefit from an Investment Management Dashboard?
This dashboard serves multiple professionals:
- Portfolio Managers
- Financial Analysts
- Wealth Advisors
- Investment Firms
- Individual Investors
- Asset Management Companies
- Finance Teams
Therefore, both organizations and individuals can use it effectively.
How to Implement an Investment Management Dashboard in Power BI?
Step 1: Prepare Investment Data
Collect investment details such as amount, type, region, and returns.
Step 2: Import Data into Power BI
Load Excel or database files.
Step 3: Create Data Relationships
Connect investment tables properly.
Step 4: Build Measures
Calculate ROI, active investments, and performance metrics.
Step 5: Design Dashboard Pages
Create visuals for overview, portfolios, regions, and trends.
Step 6: Add Slicers
Enable interactive filtering.
Step 7: Publish and Share
Distribute dashboards securely.
Future of Investment Analytics with Power BI
Investment analytics continues to evolve rapidly. Power BI supports future-ready capabilities such as:
- AI-driven insights
- Predictive analytics
- Automated anomaly detection
- Cloud-based collaboration
Therefore, investment professionals gain smarter decision tools.
Conclusion
The Investment Management Dashboard in Power BI transforms complex investment data into clear, actionable insights. Instead of analyzing multiple spreadsheets, investors can monitor performance, compare portfolios, and evaluate ROI from one powerful dashboard.
Moreover, the five analytical pages — Overview, Portfolio Analysis, Investment Type Analysis, Region Analysis, and Monthly Trends — provide a complete 360-degree view of investment performance.
As financial markets become more competitive, data-driven investment decisions become essential. Therefore, adopting a structured Power BI dashboard helps investors improve efficiency, reduce risk, and maximize returns.
Frequently Asked Questions (FAQs)
- What is an Investment Management Dashboard in Power BI?
It is an interactive dashboard that tracks investment performance, ROI, portfolio value, and trends using visual analytics.
- Who should use this dashboard?
Portfolio managers, investors, financial analysts, and investment firms can use it to monitor investment performance.
- Can beginners use this dashboard?
Yes. The dashboard uses simple visuals and slicers, so beginners can understand investment insights easily.
- What KPIs does the dashboard track?
It tracks invested amount, current value, ROI, active investments, closed investments, and trend metrics.
- Does Power BI support real-time investment tracking?
Yes. Power BI supports automatic data refresh for near real-time analytics.
- Can I customize the dashboard?
Yes. You can modify visuals, KPIs, and filters according to your investment strategy.
- Why is ROI analysis important in investment management?
ROI helps investors measure profitability and compare investment performance effectively.
- How often should investment data be updated?
You should update data regularly — daily, weekly, or monthly — depending on investment activity.
Visit our YouTube channel to learn step-by-step video tutorials
Watch the step-by-step video tutorial:
Click to buy Investment Management Dashboard in Power BI