Modern financial institutions operate in a highly competitive and data-driven environment. Credit card companies process millions of transactions every day. Therefore, they must continuously monitor approvals, revenue streams, customer behavior, and regional performance. However, many organizations still rely on scattered reports and manual spreadsheets. As a result, decision-makers often struggle to gain real-time insights.
A Credit Card Companies Dashboard in Power BI solves this challenge by transforming complex financial data into interactive and actionable visual insights. Instead of reviewing multiple reports separately, managers can analyze approvals, fees, interest revenue, and customer satisfaction from a single centralized dashboard.
Click to Purchases Credit Card Companies Dashboard in Power BI
In this comprehensive guide, you will learn everything about the Credit Card Companies Dashboard in Power BI, including its structure, features, advantages, analysis capabilities, implementation approach, best practices, and frequently asked questions.
What Is a Credit Card Companies Dashboard in Power BI?
A Credit Card Companies Dashboard in Power BI is an interactive business intelligence solution designed to track and analyze credit card operations using visual reports and automated analytics.
It helps financial organizations monitor:
-
Card approval performance
-
Transaction behavior
-
Revenue generation
-
Customer satisfaction trends
-
Regional and segment performance
-
Monthly financial growth
Because Power BI connects directly with structured datasets, companies can update dashboards automatically. Consequently, leadership teams make faster and more accurate decisions.
Why Do Credit Card Companies Need a Power BI Dashboard?
Credit card businesses generate massive volumes of transactional data. Although data exists, companies often fail to convert it into meaningful insights. Therefore, they require a smart analytics platform.
A Power BI dashboard provides:
-
Centralized performance monitoring
-
Real-time financial visibility
-
Automated reporting
-
Interactive filtering using slicers
-
Faster executive decision-making
Moreover, teams can quickly identify performance gaps and take corrective actions.
What Problems Does a Credit Card Dashboard Solve?
Many financial organizations face similar challenges. For example:
-
Reports remain scattered across departments
-
Manual analysis consumes time
-
Approval trends remain unclear
-
Revenue drivers stay hidden
-
Customer satisfaction patterns go unnoticed
However, when organizations implement a Power BI dashboard, they eliminate these inefficiencies. As a result, teams focus more on strategy instead of data preparation.
Structure of the Credit Card Companies Dashboard in Power BI
The dashboard contains five powerful analytical pages, each designed to answer specific business questions.
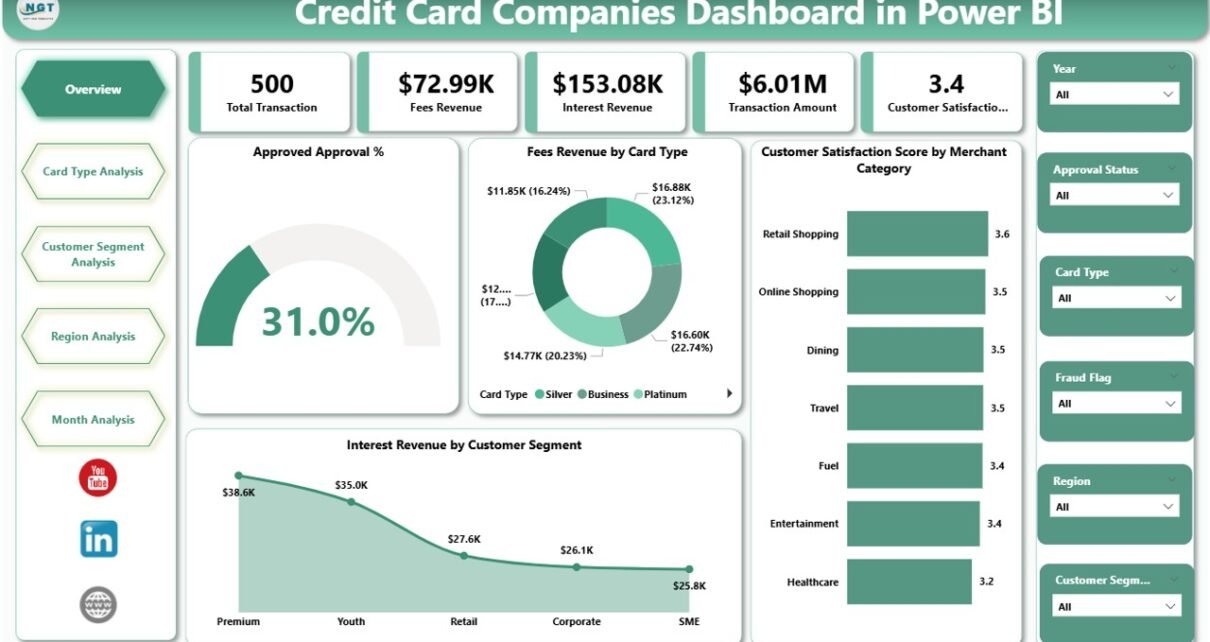
1. Overview Page – The Executive Snapshot
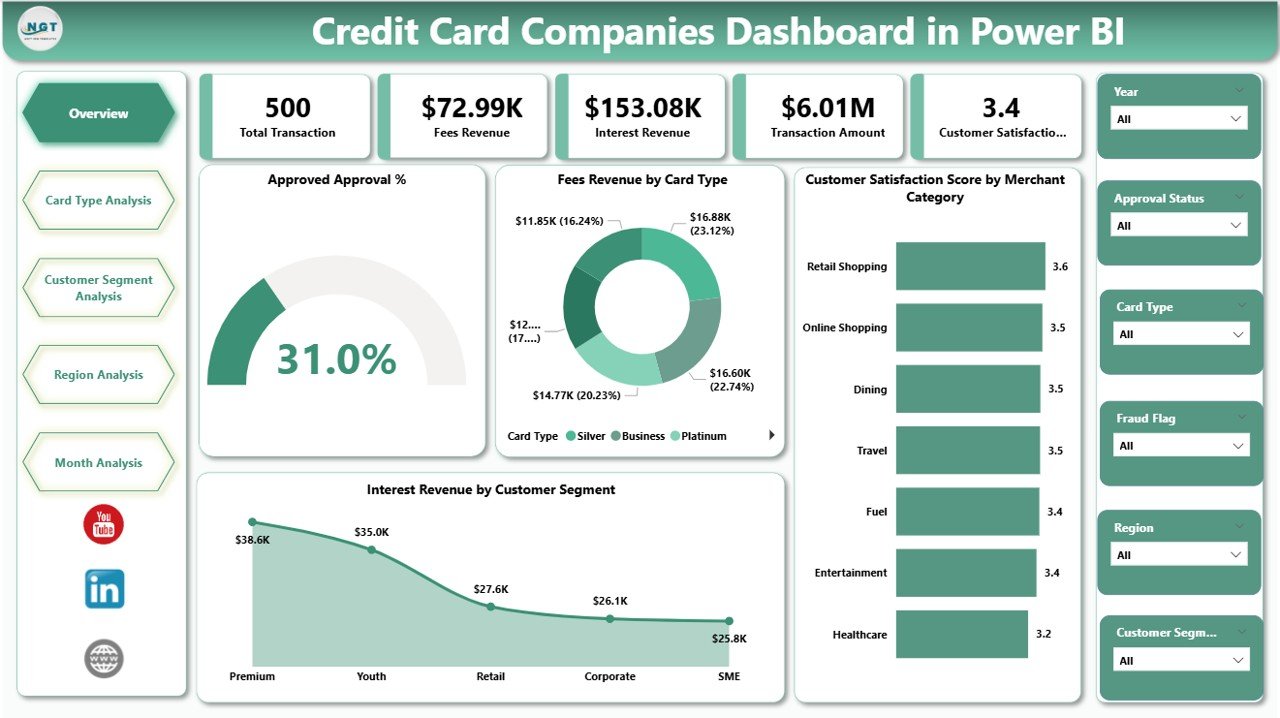
The Overview Page acts as the main control center of the dashboard. It provides high-level insights that executives need daily.
Key Elements Included
Click to Purchases Credit Card Companies Dashboard in Power BI
-
Interactive slicers for filtering data
-
Five KPI cards showing major performance indicators
-
Revenue and satisfaction insights
KPI Cards Available
-
Approved Approval %
-
Fee Revenue by Card Type
-
Customer Satisfaction Score by Merchant Category
-
Interest Revenue by Customer Segment
-
Overall Performance Summary
Because this page consolidates essential metrics, leaders immediately understand business health.
What Questions Does the Overview Page Answer?
-
How many applications get approved?
-
Which card type generates higher fees?
-
Which customer segment drives interest income?
-
Are customers satisfied with merchant services?
Therefore, executives start analysis from this page before diving deeper.
2. Card Type Analysis – Which Cards Perform Best?
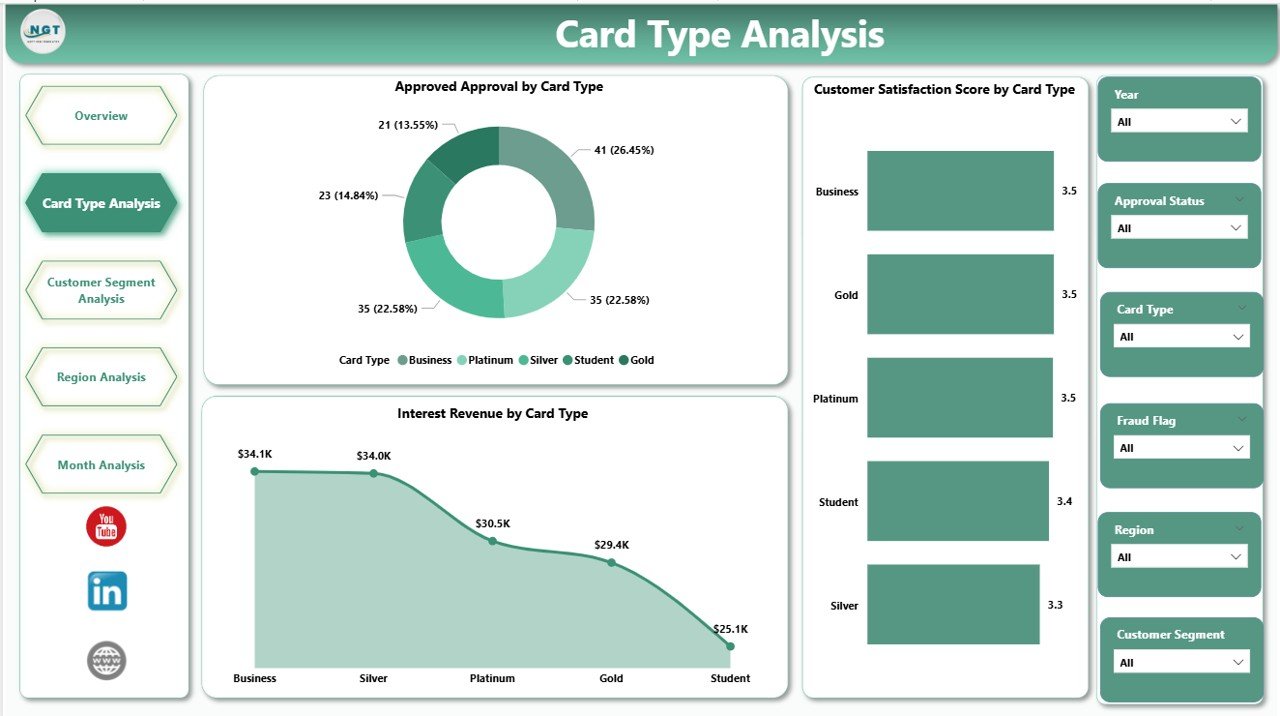
The Card Type Analysis Page focuses on performance comparison among different credit card categories.
Charts Included
-
Approved Approval by Card Type
-
Customer Satisfaction Score by Card Type
-
Interest Revenue by Card Type
Business Insights Generated
This page helps organizations understand:
-
Premium vs standard card performance
-
Customer preference trends
-
Profitability differences between card products
For instance, companies may discover that premium cards generate higher interest revenue while basic cards deliver higher approval rates.
Consequently, product teams can redesign offerings strategically.
Click to Purchases Credit Card Companies Dashboard in Power BI
3. Customer Segment Analysis – Understanding Customer Behavior
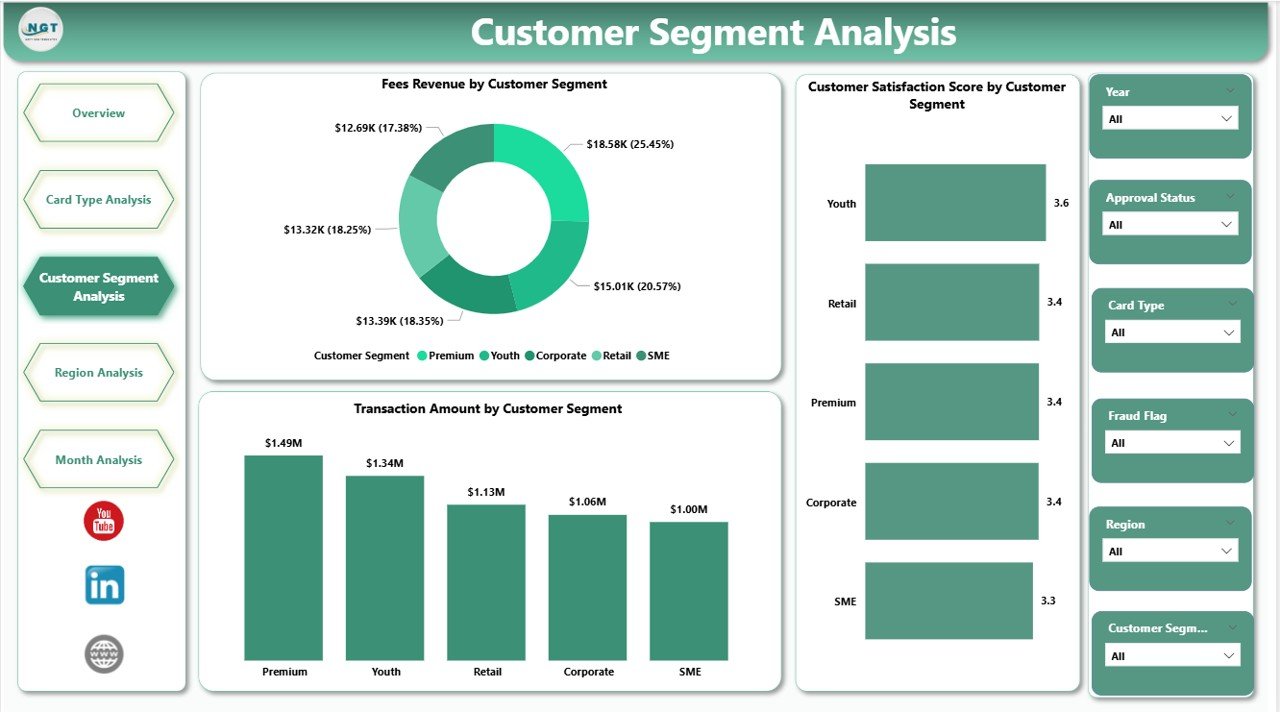
Customer segmentation plays a critical role in financial analytics. Therefore, this page analyzes performance across customer groups.
Charts Available
-
Customer Satisfaction Score by Customer Segment
-
Fees Revenue by Customer Segment
-
Transaction Amount by Customer Segment
Insights Businesses Can Gain
-
Which customer segment spends more?
-
Which segment generates higher fees?
-
Which customers show higher satisfaction levels?
Because each segment behaves differently, companies can personalize marketing campaigns and credit strategies.
4. Region Analysis – Geographic Performance Insights
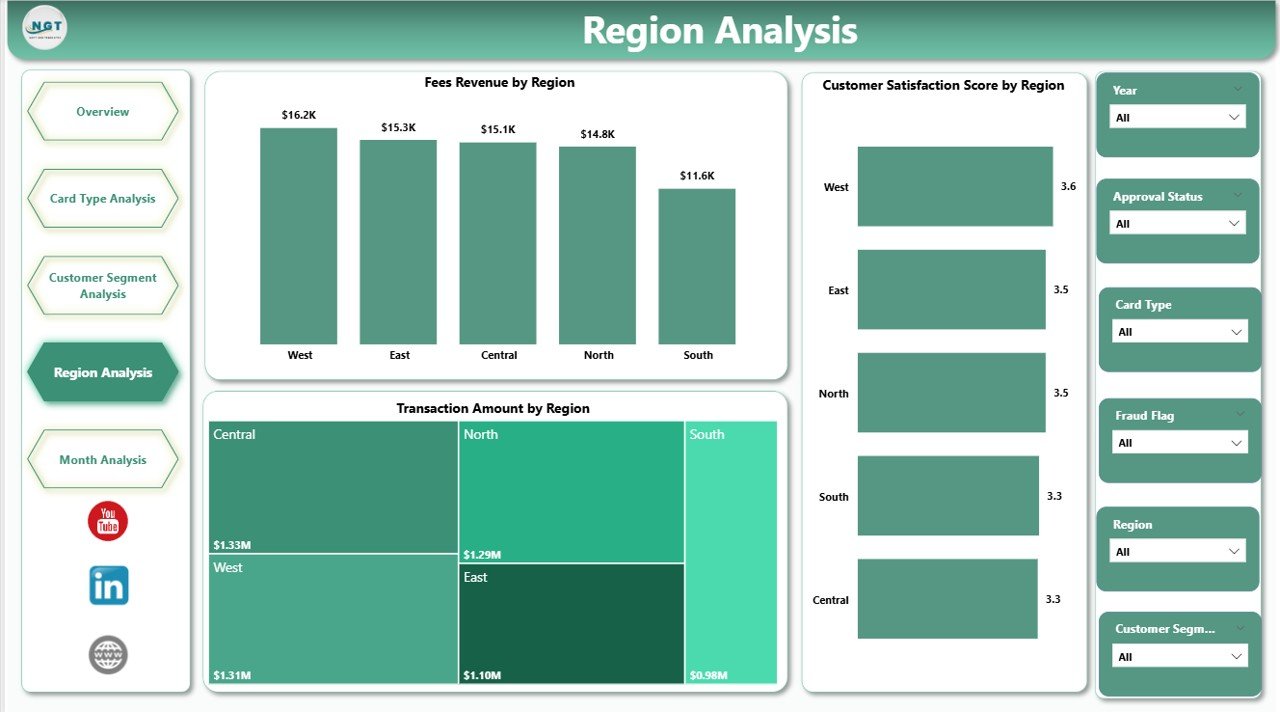
Financial performance often varies across locations. Therefore, the Region Analysis Dashboard highlights geographic trends.
Charts Included
-
Customer Satisfaction Score by Region
-
Fees Revenue by Region
-
Transaction Amount by Region
Why Regional Analysis Matters
Regional insights help organizations:
-
Identify high-performing markets
-
Detect underperforming regions
-
Improve localized marketing strategies
-
Allocate resources efficiently
For example, one region may show strong transaction volume but lower satisfaction scores. As a result, companies can investigate service quality issues.
Click to Purchases Credit Card Companies Dashboard in Power BI
5. Month Analysis – Tracking Time-Based Trends
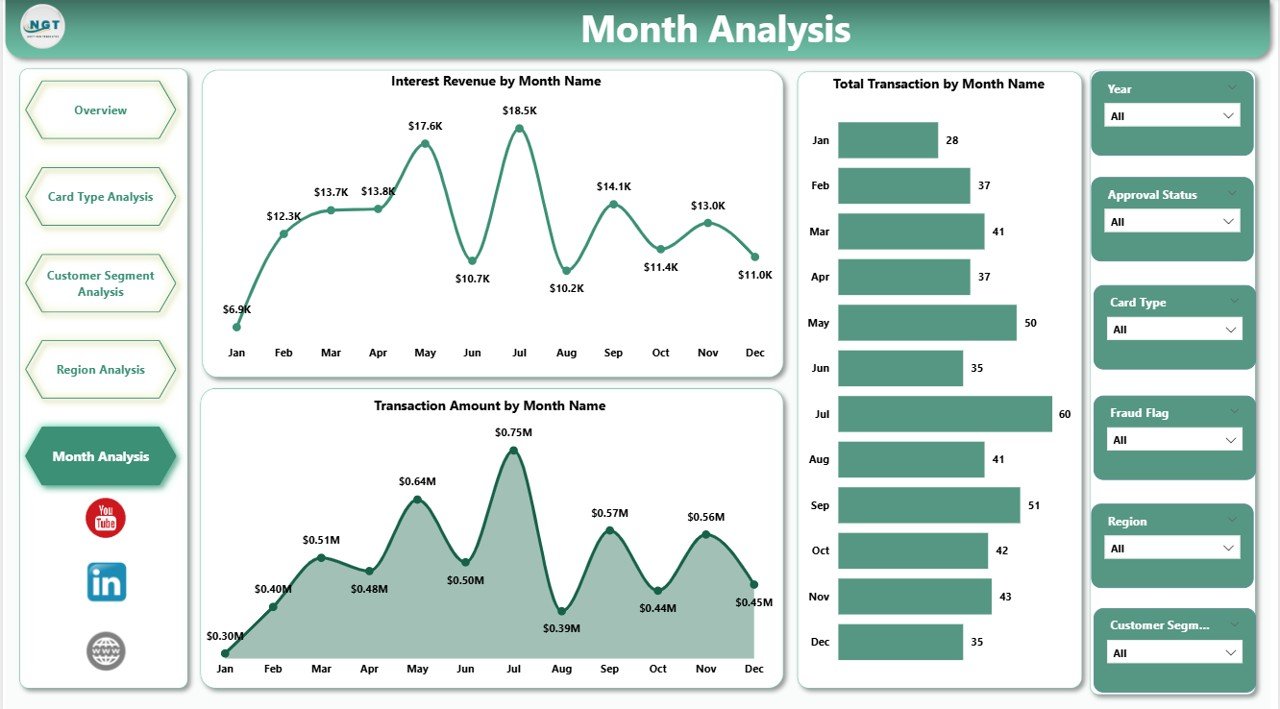
Financial performance changes over time. Hence, monthly analysis becomes essential.
Charts Included
-
Transaction Amount by Month
-
Total Transactions by Month
-
Interest Revenue by Month
Key Benefits of Monthly Analysis
-
Identify seasonal spending patterns
-
Track revenue growth trends
-
Monitor business expansion progress
-
Forecast future performance
Because trends appear visually, management teams quickly identify growth or decline periods.
How Does Power BI Improve Credit Card Analytics?
Power BI enhances analytics through automation and visualization.
Key Capabilities
-
Dynamic filtering using slicers
-
Interactive drill-down analysis
-
Real-time dashboard refresh
-
Automated calculations
-
Data modeling support
Furthermore, users do not require advanced technical knowledge. Therefore, both analysts and managers can use the dashboard effectively.
Advantages of Credit Card Companies Dashboard in Power BI
Implementing this dashboard provides several strategic benefits.
✅ Improved Decision-Making
Managers analyze performance instantly and act faster.
✅ Centralized Reporting
All KPIs appear in one unified interface.
✅ Better Revenue Optimization
Companies identify profitable card types and segments easily.
✅ Enhanced Customer Experience
Customer satisfaction insights help improve services.
✅ Time Savings
Automation eliminates manual reporting efforts.
✅ Data Transparency
Teams access consistent and reliable metrics.
What KPIs Can Be Tracked in a Credit Card Dashboard?
Click to Purchases Credit Card Companies Dashboard in Power BI
Organizations typically monitor multiple performance indicators.
Financial KPIs
-
Interest Revenue
-
Fee Revenue
-
Transaction Volume
-
Approval Rate
Customer KPIs
-
Satisfaction Score
-
Customer Segmentation Performance
-
Merchant Category Feedback
Operational KPIs
-
Monthly Transaction Growth
-
Regional Performance
-
Card Type Efficiency
Because KPIs update dynamically, businesses always view current performance.
How to Build a Credit Card Companies Dashboard in Power BI?
Creating the dashboard involves structured steps.
Step 1: Prepare Data
Collect datasets including:
-
Customer details
-
Transaction records
-
Card types
-
Regions
-
Revenue metrics
Step 2: Clean and Structure Data
Remove duplicates and standardize formats.
Step 3: Import Data into Power BI
Load Excel or database sources directly.
Step 4: Create Data Model
Build relationships between tables.
Step 5: Design Visualizations
Create charts and KPI cards.
Step 6: Add Slicers
Enable interactive filtering.
Step 7: Publish Dashboard
Share reports securely across teams.
Best Practices for the Credit Card Companies Dashboard in Power BI
Following best practices ensures maximum dashboard effectiveness.
✔ Keep Visuals Simple
Avoid overcrowding dashboards with excessive charts.
✔ Use Consistent KPIs
Maintain standard definitions across departments.
✔ Apply Meaningful Colors
Use color coding to highlight performance status.
✔ Optimize Performance
Reduce unnecessary calculations to improve speed.
✔ Enable Drill-Down Analysis
Allow users to explore detailed insights.
✔ Update Data Regularly
Schedule automatic refresh for accurate reporting.
✔ Focus on Business Questions
Every visual should answer a specific question.
How Does This Dashboard Help Different Teams?
Click to Purchases Credit Card Companies Dashboard in Power BI
Executive Leadership
-
Monitor company performance instantly
-
Identify revenue trends quickly
Product Teams
-
Improve card offerings
-
Analyze customer preferences
Marketing Teams
-
Target profitable customer segments
-
Design region-based campaigns
Risk & Operations Teams
-
Track approval efficiency
-
Monitor transaction growth patterns
Thus, the dashboard supports organization-wide decision-making.
Common Challenges While Creating Credit Card Dashboards
Even though dashboards provide strong benefits, organizations may face challenges.
-
Poor data quality
-
Inconsistent KPI definitions
-
Overloaded visuals
-
Lack of user adoption
However, proper planning solves these issues effectively.
Future Trends in Credit Card Analytics
The financial analytics landscape continues to evolve.
Emerging Trends
-
AI-driven customer insights
-
Predictive approval modeling
-
Real-time fraud monitoring
-
Personalized financial recommendations
-
Cloud-based analytics collaboration
Therefore, Power BI dashboards will become even more powerful in the future.
Why Power BI Is Ideal for Financial Dashboards?
Power BI stands out because it combines usability with advanced analytics.
Key Reasons
-
Easy integration with Excel and databases
-
Interactive visual storytelling
-
Secure data sharing
-
Scalable enterprise solution
-
Strong visualization library
Consequently, financial institutions increasingly adopt Power BI for analytics.
Conclusion
A Credit Card Companies Dashboard in Power BI transforms raw financial data into meaningful business intelligence. Instead of relying on manual reports, organizations gain real-time visibility into approvals, revenues, customer satisfaction, and regional performance.
Because the dashboard includes five dedicated analytical pages — Overview, Card Type Analysis, Customer Segment Analysis, Region Analysis, and Month Analysis — decision-makers understand performance from every angle.
Moreover, companies improve operational efficiency, enhance customer experience, and optimize revenue strategies. Therefore, implementing a Power BI dashboard becomes a strategic necessity for modern credit card companies.
Frequently Asked Questions (FAQs)
1. What is a Credit Card Companies Dashboard in Power BI?
It is an interactive analytics dashboard that tracks credit card performance using KPIs, charts, and automated reports.
2. Who can use this dashboard?
Executives, analysts, finance teams, marketing professionals, and operations managers can use it.
3. Can beginners use this dashboard?
Yes. Power BI provides a user-friendly interface, so non-technical users can easily interact with visuals.
4. What data sources can connect to Power BI?
You can connect Excel files, databases, cloud services, and financial systems.
5. How often should the dashboard refresh data?
Organizations usually refresh data daily or in real time depending on operational needs.
6. Does the dashboard support decision-making?
Yes. It provides actionable insights that help leaders make faster and better decisions.
7. Can companies customize this dashboard?
Absolutely. Businesses can modify KPIs, visuals, and filters according to their requirements.
Visit our YouTube channel to learn step-by-step video tutorials