In today’s fast-moving manufacturing environment, companies must monitor performance continuously to stay competitive. The adhesives and sealants industry operates with complex production processes, strict quality standards, and cost-sensitive operations. Therefore, organizations must rely on accurate data instead of assumptions when making decisions.
However, many manufacturers still depend on manual reports and disconnected spreadsheets. As a result, managers struggle to track performance trends, compare targets, and identify operational issues quickly.
To solve this challenge, businesses increasingly adopt business intelligence solutions like the Adhesives and Sealants KPI Dashboard in Power BI. This ready-to-use dashboard transforms raw operational data into meaningful insights using interactive visuals and automated calculations.
In this comprehensive guide, you will learn everything about the Adhesives and Sealants KPI Dashboard in Power BI, including its structure, features, advantages, implementation strategy, best practices, and frequently asked questions.
Click to Purchases Adhesives and Sealants KPI Dashboard in Power BI
What Is an Adhesives and Sealants KPI Dashboard in Power BI?
An Adhesives and Sealants KPI Dashboard in Power BI is an interactive analytics solution designed to monitor key performance indicators across manufacturing operations using dynamic visual reports.
Instead of reviewing multiple Excel sheets manually, decision-makers can analyze KPIs in one centralized dashboard. Consequently, teams gain faster insights and improve operational efficiency.
Moreover, Power BI automatically updates visuals whenever data changes. Because of this automation, organizations maintain accurate and real-time performance tracking.
Why Do Adhesives and Sealants Manufacturers Need KPI Dashboards?
The adhesives and sealants sector includes multiple operational stages such as formulation, mixing, testing, packaging, logistics, and distribution. Each stage generates performance data.
Without structured monitoring, companies may face:
-
Production inefficiencies
-
Missed targets
-
Quality variations
-
Increased operational costs
-
Delayed decision-making
Therefore, KPI dashboards become essential tools for performance visibility and strategic planning.
Click to Purchases Adhesives and Sealants KPI Dashboard in Power BI
Key Features of Adhesives and Sealants KPI Dashboard in Power BI
This dashboard includes three powerful report pages designed for performance monitoring and analysis.
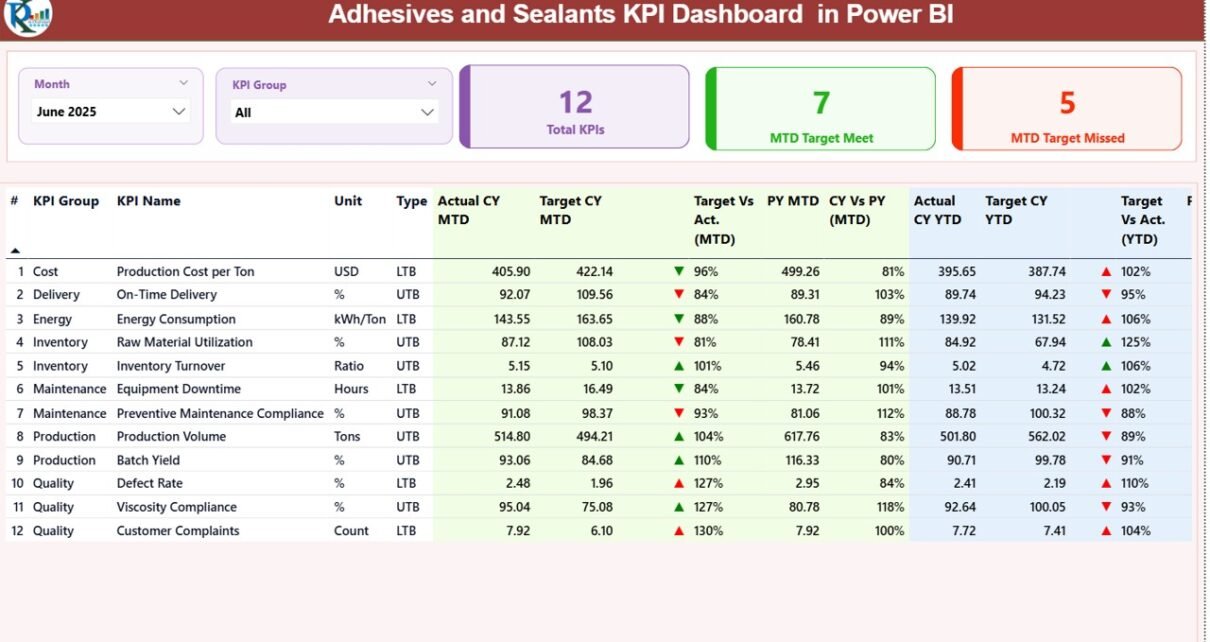
1. Summary Page – Central Performance Overview
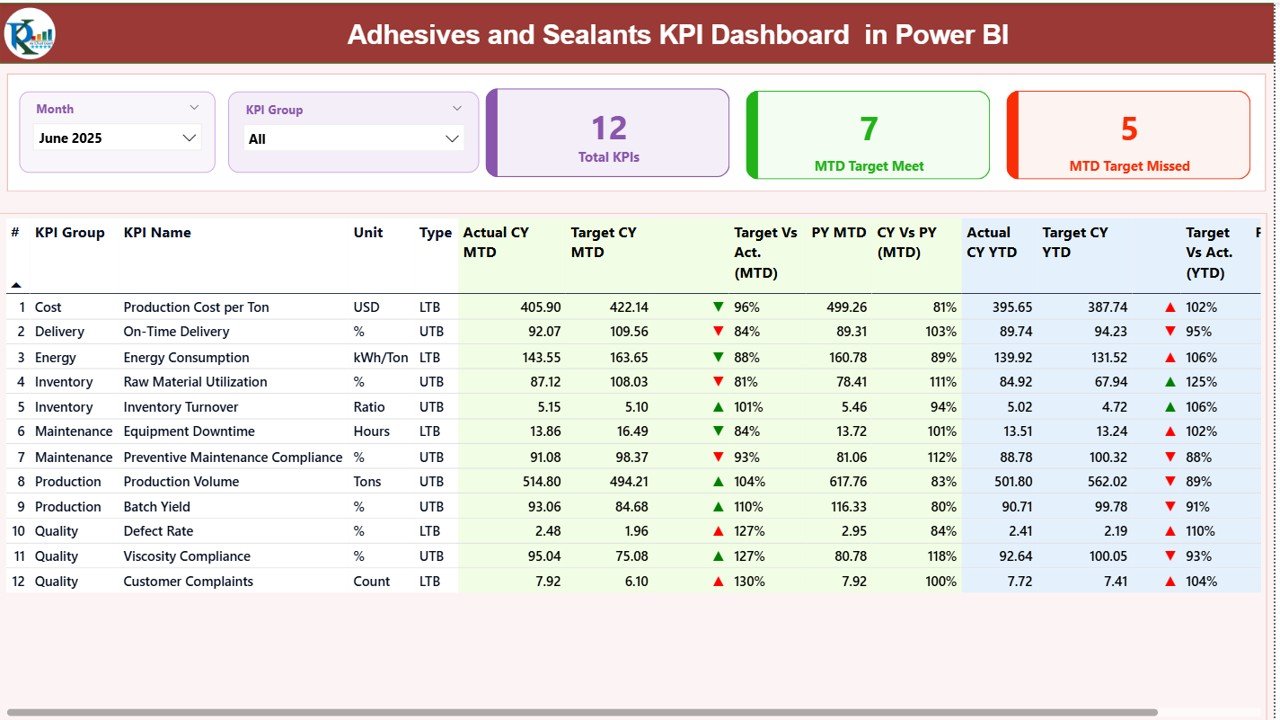
The Summary Page acts as the main control center of the dashboard.
Interactive Slicers
At the top of the page, users can filter data using:
-
Month slicer
-
KPI Group slicer
Because filters work dynamically, users instantly analyze specific time periods or KPI categories.
KPI Performance Cards
The dashboard displays three key performance cards:
-
Total KPI Count
-
MTD Target Met Count
-
MTD Target Missed Count
These cards provide a quick performance snapshot.
Detailed KPI Table
Below the cards, a detailed KPI table presents complete performance information.
KPI Identification Details
-
KPI Number
-
KPI Group
-
KPI Name
-
Unit of Measurement
-
KPI Type (LTB – Lower the Better / UTB – Upper the Better)
MTD Performance Metrics
-
Actual CY MTD
-
Target CY MTD
-
MTD Status Icon (▲ Green / ▼ Red)
-
Target vs Actual %
-
Previous Year MTD
-
Current Year vs Previous Year %
YTD Performance Metrics
-
Actual CY YTD
-
Target CY YTD
-
YTD Status Icon
-
Target vs Actual %
-
Previous Year YTD
-
Current Year vs Previous Year %
Because visual indicators highlight performance instantly, managers quickly identify improvement areas.
Click to Purchases Adhesives and Sealants KPI Dashboard in Power BI
2. KPI Trend Page – Performance Trend Visualization
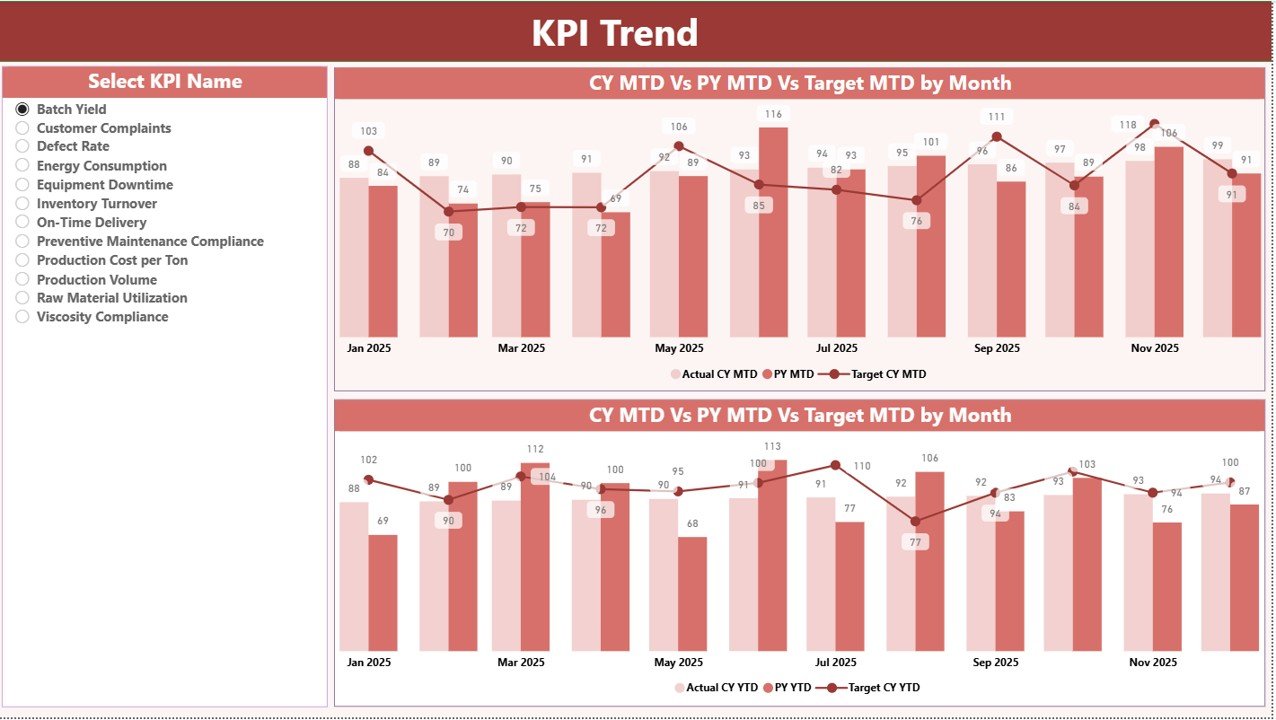
The KPI Trend Page focuses on analytical insights through visual comparisons.
KPI Selection Slicer
Users select any KPI from the slicer on the left side. Immediately, charts update automatically.
Combo Charts Included
The page contains two combo charts showing:
-
Current Year Actual values
-
Previous Year values
-
Target values
Charts are available for:
-
MTD performance trends
-
YTD performance trends
Therefore, organizations understand performance direction instead of only viewing numbers.
3. KPI Definition Page – Drill-Through Analysis
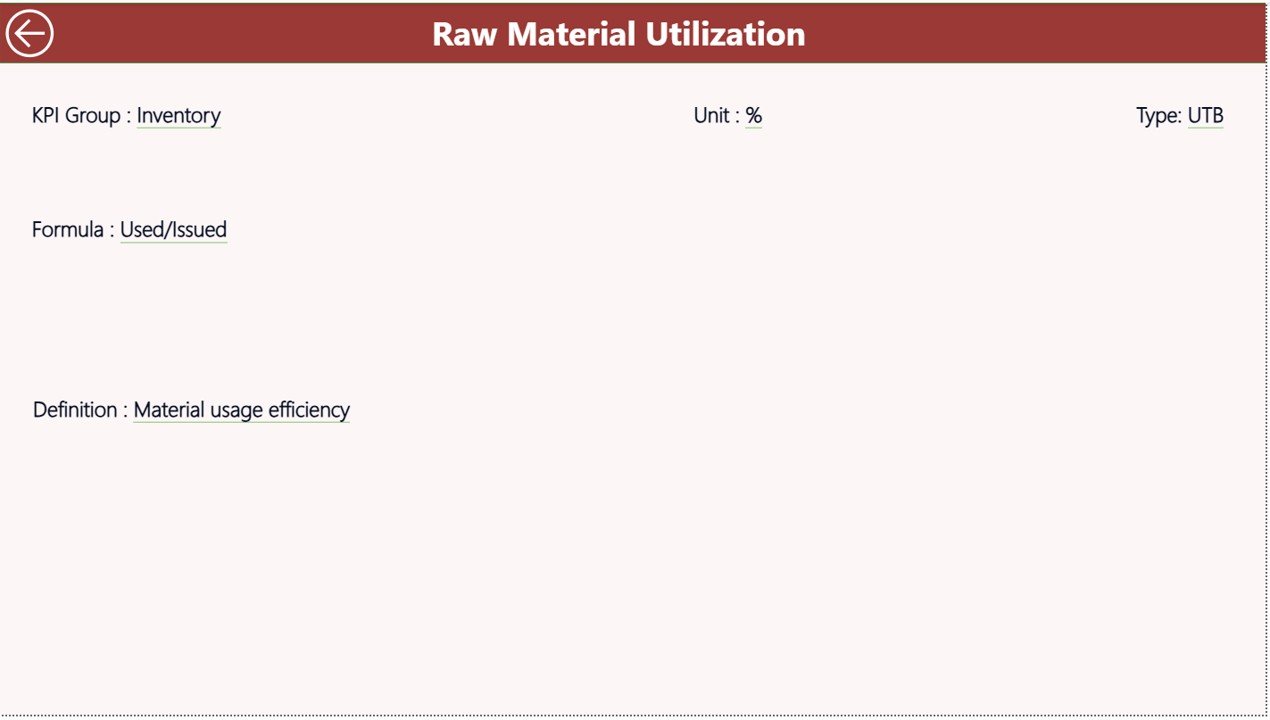
The KPI Definition Page serves as a detailed information layer.
Key Characteristics
-
Hidden drill-through page
-
Accessible from Summary Page
-
Back button available for navigation
Information Displayed
-
KPI Formula
-
KPI Definition
-
KPI Classification
-
Measurement logic
Because users can drill into KPI details, they understand calculation methods clearly.
Excel Data Source Structure
The dashboard uses an Excel file as the data source, which makes updates simple and flexible.
Users only need to maintain three worksheets.
1. Input_Actual Sheet
Enter:
-
KPI Name
-
Month (first date of month)
-
MTD Actual values
-
YTD Actual values
Once data updates, Power BI refreshes automatically.
2. Input_Target Sheet
Users enter:
-
KPI Name
-
Month
-
MTD Target values
-
YTD Target values
Targets allow variance analysis and performance tracking.
3. KPI Definition Sheet
This sheet stores KPI master information:
-
KPI Number
-
KPI Group
-
KPI Name
-
Unit
-
Formula
-
Definition
-
KPI Type (LTB or UTB)
Because definitions remain centralized, reporting stays consistent.
Click to Purchases Adhesives and Sealants KPI Dashboard in Power BI
Which KPIs Can Be Monitored in Adhesives and Sealants Manufacturing?
Organizations can track operational, quality, and financial KPIs such as:
Production KPIs
-
Production output volume
-
Batch efficiency
-
Machine utilization
-
Downtime percentage
Quality KPIs
-
Defect rate
-
Product rejection percentage
-
Customer complaints
-
Quality consistency score
Supply Chain KPIs
-
Delivery performance
-
Inventory turnover
-
Raw material usage efficiency
Financial KPIs
-
Production cost per unit
-
Profit margin
-
Revenue growth
-
Operational cost ratio
How Does Power BI Improve KPI Monitoring?
Power BI enhances KPI tracking through automation and visualization.
Real-Time Insights
Dashboards update instantly after data refresh.
Interactive Analysis
Users filter KPIs by time and category.
Visual Decision Support
Icons and charts simplify complex data.
Centralized Reporting
All performance metrics appear in one platform.
As a result, management teams spend less time preparing reports and more time improving performance.
Click to Purchases Adhesives and Sealants KPI Dashboard in Power BI
Advantages of Adhesives and Sealants KPI Dashboard in Power BI
Implementing this dashboard delivers multiple business benefits.
✅ Centralized Performance Monitoring
All KPIs appear in one structured interface.
✅ Faster Decision-Making
Visual alerts identify performance gaps quickly.
✅ Improved Accountability
Departments track measurable goals clearly.
✅ Historical Performance Comparison
Year-over-year analysis highlights growth trends.
✅ Reduced Manual Reporting Effort
Automation eliminates repetitive tasks.
✅ Better Strategic Planning
Data-driven insights support long-term planning.
✅ Scalable Analytics Platform
Power BI grows with organizational needs.
How to Implement the Adhesives and Sealants KPI Dashboard in Power BI?
Successful implementation requires a structured process.
Step 1: Define KPI Objectives
Align KPIs with production and business goals.
Step 2: Prepare Excel Data
Organize Actual, Target, and Definition sheets.
Step 3: Load Data into Power BI
Connect Excel as the data source.
Step 4: Validate KPI Calculations
Ensure formulas produce accurate results.
Step 5: Train Users
Explain filters, drill-through features, and navigation.
Step 6: Schedule Regular Updates
Refresh data periodically.
Click to Purchases Adhesives and Sealants KPI Dashboard in Power BI
Best Practices for the Adhesives and Sealants KPI Dashboard in Power BI
Following best practices ensures maximum value.
✔ Focus on Critical KPIs
Avoid dashboard overcrowding.
✔ Maintain Data Accuracy
Verify data before refreshing reports.
✔ Use Consistent KPI Definitions
Standardization improves clarity.
✔ Review Trends Regularly
Analyze performance direction monthly.
✔ Use Visual Indicators Effectively
Icons should clearly represent status.
✔ Encourage Data Ownership
Assign responsibility for updates.
✔ Monitor Target Variances
Act quickly when KPIs fall behind targets.
Common Challenges and Solutions
Challenge: Data Inconsistency
Solution: Standardize input templates.
Challenge: User Adoption Issues
Solution: Provide simple training sessions.
Challenge: Overloaded Dashboards
Solution: Keep visuals focused on key metrics.
Challenge: Irregular Updates
Solution: Establish reporting schedules.
Click to Purchases Adhesives and Sealants KPI Dashboard in Power BI
Why Power BI Is Ideal for Manufacturing KPI Dashboards?
Power BI offers several advantages compared to traditional reporting tools.
-
Interactive visuals
-
Automated calculations
-
Drill-through analysis
-
Dynamic filtering
-
Scalable reporting
-
Easy integration with Excel
Therefore, manufacturing organizations gain enterprise-level analytics without complex development.
Future of KPI Dashboards in Manufacturing Analytics
Manufacturers increasingly integrate dashboards with:
-
ERP systems
-
IoT production sensors
-
Predictive analytics models
-
AI-driven forecasting
Although technology evolves, structured KPI dashboards remain the foundation of performance management.
Conclusion
The Adhesives and Sealants KPI Dashboard in Power BI provides a powerful and practical solution for monitoring manufacturing performance. Instead of relying on manual reporting, organizations gain real-time insights through interactive visuals and automated comparisons.
Because the dashboard combines MTD and YTD analysis, KPI trends, drill-through definitions, and Excel-based data management, decision-makers understand performance quickly and accurately.
Ultimately, companies that adopt KPI dashboards improve operational efficiency, enhance accountability, and make smarter data-driven decisions. Therefore, implementing this dashboard represents a major step toward modern manufacturing analytics.
Click to Purchases Adhesives and Sealants KPI Dashboard in Power BI
Frequently Asked Questions (FAQs)
1. What is a KPI dashboard in Power BI?
A KPI dashboard in Power BI is an interactive report that tracks key performance indicators using visuals, filters, and automated calculations.
2. Can this dashboard work with Excel data?
Yes. The dashboard uses Excel as its primary data source, making updates simple and flexible.
3. What does LTB and UTB mean?
-
LTB (Lower the Better): Lower values indicate better performance.
-
UTB (Upper the Better): Higher values indicate better performance.
4. How often should data be refreshed?
Organizations usually refresh data monthly, although weekly updates also work depending on requirements.
5. Can users customize KPIs?
Yes. Users can modify KPI definitions, targets, and calculations based on business needs.
6. Is Power BI suitable for manufacturing analytics?
Absolutely. Power BI provides interactive visualization, automation, and scalable analytics ideal for manufacturing environments.
7. Do users need advanced technical skills?
No. The dashboard uses simple slicers and navigation, so business users can operate it easily.
Click to Purchases Adhesives and Sealants KPI Dashboard in Power BI
Visit our YouTube channel to learn step-by-step video tutorials